

Abstract
Mammalian cells contain genetic information in two compartments, the nucleus and the mitochondria. Mitochondrial gene expression must be coordinated with nuclear gene expression to respond to cellular energetic needs. To gain insight into the coordination between the nucleus and mitochondria, there is a need to understand the regulation of transcription of mitochondrial DNA (mtDNA). Reversible protein post-translational modifications of the mtDNA transcriptional machinery may be one way to control mtDNA transcription. Here we focus on a member of the mtDNA transcription initiation complex, mitochondrial transcription factor B2 (TFB2M). TFB2M melts mtDNA at the promoter to allow the RNA polymerase (POLRMT) to access the DNA template and initiate transcription. Three phosphorylation sites have been previously identified on TFB2M by mass spectrometry: threonine 184, serine 197, and threonine 313. Phosphomimetics were established at these positions. Proteins were purified and analyzed for their ability to bind mtDNA and initiate transcription in vitro. Our results indicate phosphorylation at threonine 184 and threonine 313 impairs promoter binding and prevents transcription. These findings provide a potential regulatory mechanism of mtDNA transcription and help clarify the importance of protein post-translational modifications in mitochondrial function.
Keywords: mitochondrial DNA, mitochondrial transcription factor B2 (TFB2M), phosphorylation, transcription regulation
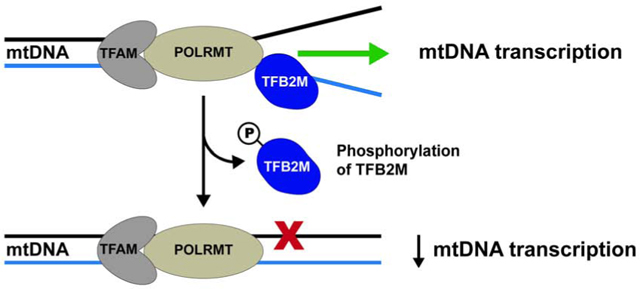
Graphical Abstract
1. Introduction:
Mitochondria serve as central locations for numerous critical cellular processes, including producing the majority of cellular ATP via oxidative phosphorylation. Mitochondria possess small, circular DNA molecules (mtDNA) encoding two mitochondria-specific rRNAs and 22 tRNAs, as well as 13 of the 90 protein subunits of the oxidative phosphorylation machinery [1]. The rest of the mitochondrial proteome, including the remaining 77 oxidative phosphorylation protein subunits and the machinery required for mtDNA replication and transcription, is encoded by genes within nuclear DNA. In order for oxidative phosphorylation complexes to be properly assembled, coordination of gene expression between the nucleus and the mitochondria is required. As such, the regulation of expression of oxidative phosphorylation subunit genes may play a role in cellular adaptations to specific metabolic demands. However, the details of the mechanisms regulating mtDNA transcription are currently lacking, limiting the ability to understand the coordination between the mitochondrial and nuclear genome, as well as human mitochondrial disorders associated with the aberrant expression of mitochondrial genes [2].
Post-translational modifications (PTMs) of proteins associated with mtDNA may provide a potential means of regulating mtDNA transcription. Reversible PTMs such as acetylation of lysine and phosphorylation of serine, threonine, and tyrosine on nuclear histone proteins play a role in regulating chromatin structure and nuclear DNA transcription [3]. Like nuclear DNA, mtDNA is associated with a variety of proteins, forming complexes within the mitochondrial matrix known as nucleoids [4]. The presence of numerous PTMs on mitochondrial nucleoid proteins identified in mass spectrometry-based proteomics of mitochondrial extracts from mouse and human samples suggest that reversible modifications may also play a role in controlling mtDNA transcription [5–8].
Indeed, PTMs have been identified on the three nucleoid proteins that comprise the essential mtDNA transcription machinery: mitochondrial RNA polymerase (POLRMT), transcription factor A (TFAM), and transcription factor B2 (TFB2M) [5]. Transcription initiation occurs from two promoters, the light strand and the heavy strand promoter (LSP and HSP1, respectively). TFAM is necessary for promoter recognition and recruitment of POLRMT to the transcription start site, while TFB2M is required for promoter melting and template alignment [9–12]. Previous reports on TFAM indicate phosphorylation reduces the ability of TFAM to bind DNA and serves as a mechanism to fine-tune cellular levels of TFAM and mtDNA [13,14]. These studies provided some of the first evidence that PTMs may control the mtDNA transcriptional machinery. TFB2M has previously been shown to be phosphorylated at three sites (serine 197 (S197), threonine 184 (T184), and threonine 313 (T313)) [5]. However, the function of these phosphorylation sites has not been investigated. Here, we present the impact of phosphorylation on the promoter binding and transcription initiation abilities of TFB2M.
2. Materials and Methods:
2.1. Materials
All oligonucleotides were synthesized and purified from Integrated DNA Technologies or Eurofins Genomics. For binding and transcription assays, double stranded (ds) DNA was prepared by annealing complementary strands of DNA in annealing buffer (10 mM Tris-HCl pH 8.0, 50 mM NaCl, 1 mM EDTA) and heating at 95ºC for 5 minutes followed by ramp cooling to 25ºC over 70 one minute cycles. Annealing was confirmed by agarose gel electrophoresis. Oligonucleotides for the mtDNA binding assay were labeled with biotin on the 5’ end and correspond to LSP (−17 to +19, 5’-AAAAGTGCATACCGCCAAAAGATAAAATTTGAAATC-3’) or HSP1 region (−25 to +20, 5’-CCATACCCCGAACCAACCAAACCCCAAAGACACCCCCCACAGTTT-3’). Control probes without biotin were also synthesized. For anisotropy measurements, the same sequences corresponding to the LSP were used with the addition of a fluorescein label on the 5’ end of the coding strand.
2.2. Plasmid construction
For bacterial protein expression and purification of TFB2M, the portion of the human cDNA sequence encoding amino acids 21–396 of TFB2M were cloned out of the pANT7_cGST vector (DNASU [15]) and into the pQE-80L vector with a 6xHis tag on the N-terminus (Addgene plasmid #13736, a kind gift from John Denu) using restriction digest and ligation. The bacterial expression vector used to overexpress TFB2M T184E with a N-terminal 6xHis tag (pET-6xHis/hTFB2M[NM_022366.3]) was constructed and provided by VectorBuilder (vector ID: VB190523–1093aej). A plasmid containing the human cDNA sequence for amino acids 43–1230 of POLRMT in the pProEX-Htb vector was obtained from Smita Patel [9]. Site-directed mutagenesis was performed using the Q5® Hot Start Site-Directed Mutagenesis Kit (New England Biolabs). All cloning and mutagenesis steps were verified by DNA sequencing.
2.3. Expression and purification of TFB2M and POLRMT
Purification of TFB2M and phosphomimetics was performed as previously described with modification [16]. BL-21(DE3) E. coli transformed with TFB2M vectors were grown from starter cultures in 2XYT media at 37°C until the OD 600 reached 0.8. The cultures were induced with 0.5 mM IPTG and allowed to incubate at room temperature with shaking for 12–16 hours. Cell pellets were lysed and sonicated in wash buffer (50 mM sodium phosphate pH 8.0, 0.3 M NaCl, 10% glycerol, 0.1% Tween-20, 10 mM imidazole) containing 1 mM β-mercaptoethanol, 1 mM PMSF, 5 μg/mL aprotinin, and 5 μg/mL leupeptin. After centrifugation, the supernatant was applied to TALON Metal Affinity Resin (Takara Cat# 635502). The resin was washed with wash buffer, and protein was eluted in wash buffer containing 150 mM imidazole. Protein was concentrated and dialyzed overnight into storage buffer (20 mM Tris-HCl pH 8.0, 0.5 mM EDTA, 0.25 M sucrose, 15% glycerol, 1 mM DTT). POLRMT was purified as previously described [17]. The presence of TFB2M or POLRMT was visualized by SDS-PAGE and Coomassie staining. Protein concentrations were determined via the Bradford assay and normalized for percent purity by SDS-PAGE. Proteins were stored at −80°C.
2.4. Mitochondrial DNA binding assay
An in vitro mitochondrial DNA pull-down assay [14] was performed to determine protein-DNA binding interactions between TFB2M and LSP or HSP1 dsDNA. dsDNA (1.5 μM) with or without a biotin tag on the 5’ end was incubated at room temperature with 400 nM WT or phosphomimetic TFB2M for 15 minutes while rotating in a 1:1 mixture of binding and blocking buffer (binding buffer: 40 mM Tris-HCl pH 7.7, 0.2 mM EDTA, 100 mM NaCl, 10% glycerol, 1% Triton X-100; blocking buffer: 20 mM Tris-HCl pH 7.7, 4.4 mM EDTA, 9% sucrose, 110 mM NaCl, 5 mM MgCl2, 12% glycerol, 0.02% Tween-20, 0.5 mg/mL BSA, 8 mM DTT). EZview Red Streptavidin affinity gel beads (Sigma #E5529) were added to the mixture and incubated while rotating for 15 minutes. Extensive washing was performed using 20 mM Tris-HCl pH 7.7, 0.1 mM EDTA, 50 mM NaCl, 5% glycerol, 0.1% Triton X-100, 4 mM DTT. Samples were eluted by boiling in Laemmli Sample Buffer (Sigma #S3401). In some experiments, equimolar amounts of POLRMT and TFB2M were added to the assay. Western blotting was performed using primary antibodies against TFB2M or POLRMT (Santa Cruz Biotechnologies: TFB2M 2E10 (SC-517095), MtRPOL B-1 (SC-365082)) and goat anti-mouse IRDye 800CW (LI-COR 925–32210) secondary antibody. Blots were scanned using an Odyssey Fc imaging station (LI-COR Biosciences), and ImageStudio was used to quantify the amounts of protein interacting with LSP or HSP1 DNA. Protein binding to DNA in each condition was quantified by dividing signal from the eluted sample by signal from the reaction mix sample removed before the addition of beads to control for the total TFB2M amount in each reaction. Results were compared relatively to WT. Control experiments for non-specific interactions were performed with unbiotinylated dsDNA of the same sequence. GraphPad Prism or Microsoft Excel were used to produce graphs and calculate statistics.
2.5. Fluorescence anisotropy
Fluorescence anisotropy was used to monitor the interactions of TFB2M proteins with 5’-fluorescein labeled LSP dsDNA. Measurements were performed on an ISS PC1 Photon Counting Spectrofluorometer equipped with an autopolarizer and DC Amperes Simpson Illuminator Power Supply (model PS300–1) adjusted to 18 amps. A 550/49 filter was used to control for the emission wavelength. DNA (3 nM) was titrated with increasing amounts of TFB2M (0 nM to 500 nM) in buffer (20 mM Tris-HCl pH 8, 5 mM EDTA). Anisotropy was measured after excitation at 492 nm and emission at 510 nm using a 490/10 bandpass filter and 0.5–1 mm slits. Intensities (IVV and IVH) were averaged across 100 iterations and background corrected with the average intensity values for the buffer alone. Anisotropy (r) was calculated using the following equation: r = (IVV - (G*IVH)) / (IVV + (2*G*IVH)), where G is an experimental correction for the polarization bias of the instrument (G = IHV/IHH). The Kd values of the protein-DNA complexes were determined in GraphPad Prism using the following fit equation: y = Bmax*[X]/(Kd+[X]).
2.6. In vitro transcription assay
In vitro transcription assays were performed as previously described [12,18]. Reactions were performed with 1 μM LSP duplex DNA (−42 to +21) and 1 μM each of POLRMT and TFB2M in the presence or absence of 1 μM TFAM in reaction buffer (50 mM Tris acetate pH 7.5, 50 mM Na-glutamate, 10 mM Mg-acetate, 1 mM DTT, 0.05% Tween-20). Reactions were initiated by the addition of 250 μM each of ATP, GTP, UTP, dCTP and spiked with γ-32P-ATP. After 30 minutes, reactions were quenched with 400 mM EDTA and formamide dye mixture (98% formamide, 0.025% bromophenol blue, 10 mM EDTA). RNA products were resolved on 24% polyacrylamide/4M urea sequencing gels. The gels were exposed to a phosphor screen and visualized using a Typhoon 9410 PhosphorImager instrument (Amersham Biosciences). The bands were quantified using ImageQuant, and the molar amounts of RNA synthesized were calculated as previously described [12,18].
3. Results and Discussion:
3.1. TFB2M phosphomimetics display altered binding to mtDNA promoters
To test the effect of T184, S197, and T313 phosphorylation on TFB2M function, site-directed mutagenesis was used to introduce phosphomimetics at these amino acids. For each site, the amino acid was replaced with glutamate to mimic the size and charge of a phosphorylated amino acid. Phosphomimetics are routinely used in literature to probe the function of site-specific phosphorylation [19]. Wild-type (WT) and phosphomimetic (T184E, S197E, or T313E) TFB2M were purified using affinity chromatography. TFB2M phosphomimetics were monitored for their ability to bind to mtDNA using two approaches. First, proteins were screened for their ability to bind to the LSP (−17 to +19) or HSP1 (−25 to +20) using a biochemical pull-down experiment [14] (Figure 1). Proteins were incubated with biotinylated LSP or HSP1 dsDNA. After washing, the amount of TFB2M pulled down with the DNA was quantified by western blot. Unbiotinylated DNA was used to control for non-specific interactions. Very limited to no TFB2M was observed by western blotting in control experiments. TFB2M binding to the LSP region of the mtDNA was reduced compared to WT for all phosphomimetics, especially T313E (Figure 1A, B). Binding to the HSP1 region was significantly lower than WT for T313E, while S197E showed no significant difference (Figure 1C, D). T184E displayed reduced binding affinity for both LSP and HSP1, but the differences were not statistically significant. The differences between LSP and HSP1 are unclear, as structurally there is little difference between the initiation complex with LSP and HSP1 [10]. However, promoter-specific features of transcription initiation have been documented [20,21].
Figure 1. TFB2M phosphomimetics display altered binding to mtDNA promoter regions.

A. Representative western blot of LSP binding. WT or phosphomimetic TFB2M (400 nM) was incubated with 1.5 μM biotinylated-LSP dsDNA (−17 to +19) for 15 minutes. Streptavidin conjugated agarose beads were added to capture DNA-protein complexes. After extensive washing, bound protein was eluted by heating with 1x Laemmli sample buffer. Proteins were subject to western blotting using a TFB2M primary antibody and IRDye 800CW labeled secondary antibodies for quantitation. B. Quantitation of western blots. Results are shown relative to WT and were normalized to total protein controls. Data presented are averages and standard deviations of experiments performed with 2 to 4 independent protein preparations, with 2 technical replicates performed in each experiment. C, D. The experiment in A was repeated in the presence of 1.5 μM biotinylated-HSP1 duplex DNA (−25 to +20), and western blots were quantified as in B. *p<0.1, **p<0.05, Student’s t-test.
3.2. Binding dissociation constants determined for the LSP confirm altered mtDNA binding by phosphomimetics
As both the LSP and HSP1 displayed similar trends in the pull-down assay, we decided to continue experimentation with the more widely-studied LSP. Fluorescence anisotropy experiments confirmed pull-down results and allowed the binding constants (Kd) of WT TFB2M and each phosphomimetic to be determined (Figure 2). Fluorescein-labeled dsLSP (−17 to +19) was incubated with increasing amounts of TFB2M or phosphomimetic. The phosphomimetics T184E and T313E exhibited reduced affinity for LSP DNA compared to WT (Kd = 66 nM, consistent with a recent report [18]), with Kd’s of greater than 150 nM. This represents a 2.5- to 6-fold decrease in binding affinity compared to WT TFB2M. Saturation binding was not quite reached with T184E or T313E due to the prohibitively high amounts of protein required for the analysis. Interestingly, S197E demonstrated slightly higher affinity for LSP DNA compared to WT in these experiments (Figure 2).
Figure 2. Binding dissociation constants for the LSP determined by fluorescence anisotropy confirm altered binding affinity of TFB2M phosphomimetics.

A. 5’-fluorescein labeled LSP (−17 to +19, 3 nM) was titrated with increasing concentrations of TFB2M WT or phosphomimetic. Anisotropy was measured and background corrected. Anisotropy values from two independent experiments were averaged and plotted. The average binding data were fit to determine binding dissociation constants (Kd), tabulated in (B). The error is the standard error of the fit.
3.3. T184 and T313 TFB2M phosphomimetics are unable to initiate transcription in vitro
To correlate deficiencies in mtDNA binding to transcription activity, an in vitro transcription assay was performed with recombinant POLRMT and TFB2M in the presence or absence of TFAM using a dsLSP template (−42 to +21, Figure 3A). The amounts of run-off (18- and 19-mer) or abortive (2-mer to 6-mer) products were quantified by autoradiography. WT TFB2M and phosphomimetics were each capable of producing abortive products in the presence or absence of TFAM (Figure 3B, C). Consistent with previous results [9], substantial run-off products were observed only in the presence of TFAM (Figure 3C). T184E and T313E TFB2M were unable to produce run-off products (Figure 3D), but could produce abortive products (Figure 3E), albeit at much lower levels than WT and S197E TFB2M. These transcription initiation defects are consistent with mtDNA binding data (Figure 1, 2). Interestingly, S197E TFB2M produces more run-off products than WT TFB2M. This result is consistent with a lower Kd for the LSP observed in fluorescence anisotropy measurements.
Figure 3. Transcription initiation activity of TFB2M phosphomimetics.

A. The sequence of LSP DNA used in the experiment is shown. B, C. The denaturing gel image identifies abortive products (2- to 6-mer) and run-off products (18- and 19-mer) of transcription reactions performed for 30 minutes at 25°C. Reactions were ca rried out in the presence of NTPs (250 μM each of ATP, GTP, UTP, dCTP, and spiked with γ-32P-ATP) and 1 μM each of POLRMT, TFB2M, LSP DNA, and in the absence (B) or presence (C) of TFAM. D, E. Quantitation of run-off products (D) and abortive products (E). Error bars represent the percent error between two technical gel replicates of the same reaction samples. A comparison of the ratio of run-off versus abortive products indicates transcription initiation efficiency is unchanged across samples.
3.4. Models to explain the role of phosphorylation of TFB2M in the control of transcription initiation
Our findings indicate that phosphorylation of TFB2M at T184 and T313 may limit the ability of TFB2M to bind to mtDNA and form productive transcription initiation complexes. The first possible mechanism to explain these findings is that TFB2M phosphomimetics have impaired binding to POLRMT. The other possibility is that the phosphomimetics are defective in trapping the non-template DNA to generate the open complex required for transcription initiation. We attempted to determine whether POLRMT-TFB2M complex binding to LSP was altered by the phosphomimetics using the pull-down assay. This experiment was performed with equimolar POLRMT and TFB2M. The results from these experiments (data not shown) were not conclusive, although they suggest that the amount of POLRMT pulled down with dsLSP DNA was unchanged between WT TFB2M and the phosphomimetics. Challenges in assessing specific interactions between POLRMT and TFB2M have been previously noted [18], and efforts are ongoing to further address this question.
In order to explore the structural implications of phosphorylation of TFB2M, we turned to the existing protein structure of the human initiation complex [10] and elongation complex [22] to investigate the position of the sites of interest in relation to POLRMT and mtDNA (Figure 4A). Interestingly, T313 lies at the N-terminal end of a helix containing two arginine residues (R330/R331) that are essential for DNA binding and a histidine (H326) required for transcription initiation [10,23] (Figure 4B). In silico modeling using available structure prediction and energy minimization tools [24] shows a slight reduction in helix propensity for the amino acids in this helix when threonine 313 is changed to a glutamate. Therefore, it is possible that phosphorylation of this site perturbs the helix and reduces mtDNA binding and transcription initiation.
Figure 4. Structural model to explain the role of phosphorylation of TFB2M in transcription initiation.

A. Crystal structure (PDB 6ERP [10]) of human TFB2M (blue) in complex with open LSP mtDNA (blue/teal) and POLRMT (wheat). Phosphorylation sites are labeled. TFAM was removed for clarity. B. Close up view of TFB2M helix α8 (shown in gray) and key amino acids required for mtDNA binding and transcription initiation. Threonine 313 lies at the N-terminal end of this helix and may cause structural changes leading to movements of R330/331 and H326 that are unfavorable for mtDNA binding and transcription. C. T184 and T313 lie within 10–12Å of the thumb domain of POLRMT (shown in green), suggesting a negative impact of modification of these amino acids on POLRMT-TFB2M interactions (PDB 4BOC [22]).
The crystal structure of POLRMT in the elongation complex contains the thumb domain of POLRMT that is not observed in the initiation complex. This domain is critical for complex stability during elongation [22]. An alignment of POLRMT containing the thumb domain [22] to the initiation complex with TFB2M [10] revealed potential interactions between T313 and T184 of TFB2M and the C-terminus of the thumb domain of POLRMT (Figure 4C). T313 is roughly 10Å from histidine 748 of POLRMT, while T184 is approximately 12Å from proline 752 of POLRMT. This suggests that the introduction of a phosphate at these sites could impair intermolecular interactions between POLRMT and TFB2M.
The results obtained for the phosphomimetic at position S197 were unexpected. S197 lies within an open structural region where DNA is unwound for initiation and is close to a number of positively charged amino acids required for DNA binding [10]. Introducing a negative charge at this site had the least impact on DNA binding and transcription, opposite of what was expected. It is possible that the negative charge at this position may cause DNA repulsion to stabilize the open complex, providing some explanation for the slight increase in transcription initiation. Interestingly, sequence alignment of TFB2M from mammalian species reveals T184 and T313 are more highly conserved as phosphorylatable residues (S or T) than S197, suggesting a greater potential importance of these residues for TFB2M function and regulation [20]. Finally, a structure of TFB2M bound to DNA alone does not yet exist, and structural analysis suggests significant conformational changes in all of the members of the transcriptional machinery upon assembly [10]. Therefore, it is possible that structural changes in TFB2M cannot be entirely predicted from existing information.
3.5. Concluding remarks
There is a growing appreciation of the importance of protein phosphorylation and dephosphorylation in the mitochondria. Interestingly, while it remains unclear what kinase catalyzes the phosphorylation of the majority of mitochondrial proteins and where in the cell phosphorylation of mitochondrial proteins occurs, there are numerous resident mitochondrial phosphatases. Genetic knockout in mice of one of these phosphatases (Pptc7) was recently shown to lead to severe metabolic defects and death within one day of birth [19], further implicating reversible phosphorylation in the mitochondria as biologically relevant. Our work continues to address the role of phosphorylation in regulating mitochondrial transcription and identifies a potential mechanism for transcriptional control.
Highlights:
Phosphorylation of mitochondrial transcription factor B2 alters DNA binding
Phosphomimetics of transcription factor B2 reduce transcription in vitro
Regulatory role for post-translational modifications in mitochondrial transcription
Acknowledgements:
Funding:
This material is based upon work supported by the National Science Foundation under Grant No. 28126 to KDR, Beckman Scholars Program to AMB, National Institute of General Medicine Sciences grant GM118086 to SSP, and American Heart Association (16PRE30400001) and University and Louis Bevier Dissertation Completion Fellowship from Rutgers University to UB. Any opinions, findings, and conclusions or recommendations expressed in this material are those of the authors and do not necessarily reflect the views of the National Science Foundation.
Footnotes
Declaration of competing interests
The authors declare that they have no known competing financial interests or personal relationships that could have appeared to influence the work reported in this paper.
Publisher's Disclaimer: This is a PDF file of an unedited manuscript that has been accepted for publication. As a service to our customers we are providing this early version of the manuscript. The manuscript will undergo copyediting, typesetting, and review of the resulting proof before it is published in its final form. Please note that during the production process errors may be discovered which could affect the content, and all legal disclaimers that apply to the journal pertain.
References Cited:
- [1].Anderson S, Bankier AT, Barrell BG, de Bruijn MHL, Coulson AR, Drouin J, Eperon IC, Nierlich DP, Roe BA, Sanger F, Schreier PH, Smith AJH, Staden R, Young IG, Sequence and organization of the human mitochondrial genome, Nature. 290 (1981) 457–465. 10.1038/290457a0. [DOI] [PubMed] [Google Scholar]
- [2].Wallace DC, Mitochondrial genetics: a paradigm for aging and degenerative diseases?, Science. 256 (1992) 628–632. 10.1126/science.1533953. [DOI] [PubMed] [Google Scholar]
- [3].Strahl BD, Allis CD, The language of covalent histone modifications, Nature. 403 (2000) 41–45. 10.1038/47412. [DOI] [PubMed] [Google Scholar]
- [4].Bogenhagen DF, Mitochondrial DNA nucleoid structure, Biochimica et Biophysica Acta (BBA) - Gene Regulatory Mechanisms. 1819 (2012) 914–920. 10.1016/j.bbagrm.2011.11.005. [DOI] [PubMed] [Google Scholar]
- [5].Hornbeck PV, Zhang B, Murray B, Kornhauser JM, Latham V, Skrzypek E, PhosphoSitePlus, 2014: mutations, PTMs and recalibrations, Nucleic Acids Res. 43 (2015) D512–520. 10.1093/nar/gku1267. [DOI] [PMC free article] [PubMed] [Google Scholar]
- [6].Dittenhafer-Reed KE, Richards AL, Fan J, Smallegan MJ, Fotuhi Siahpirani A, Kemmerer ZA, Prolla TA, Roy S, Coon JJ, Denu JM, SIRT3 Mediates Multi-Tissue Coupling for Metabolic Fuel Switching, Cell Metabolism. 21 (2015) 637–646. 10.1016/j.cmet.2015.03.007. [DOI] [PMC free article] [PubMed] [Google Scholar]
- [7].Grimsrud PA, Carson JJ, Hebert AS, Hubler SL, Niemi NM, Bailey DJ, Jochem A, Stapleton DS, Keller MP, Westphall MS, Yandell BS, Attie AD, Coon JJ, Pagliarini DJ, A Quantitative Map of the Liver Mitochondrial Phosphoproteome Reveals Posttranslational Control of Ketogenesis, Cell Metabolism. 16 (2012) 672–683. 10.1016/j.cmet.2012.10.004. [DOI] [PMC free article] [PubMed] [Google Scholar]
- [8].Hebert AS, Dittenhafer-Reed KE, Yu W, Bailey DJ, Selen ES, Boersma MD, Carson JJ, Tonelli M, Balloon AJ, Higbee AJ, Westphall MS, Pagliarini DJ, Prolla TA, Assadi-Porter F, Roy S, Denu JM, Coon JJ, Calorie Restriction and SIRT3 Trigger Global Reprogramming of the Mitochondrial Protein Acetylome, Molecular Cell. 49 (2013) 186–199. 10.1016/j.molcel.2012.10.024. [DOI] [PMC free article] [PubMed] [Google Scholar]
- [9].Ramachandran A, Basu U, Sultana S, Nandakumar D, Patel SS, Human mitochondrial transcription factors TFAM and TFB2M work synergistically in promoter melting during transcription initiation, Nucleic Acids Res. 45 (2017) 861–874. 10.1093/nar/gkw1157. [DOI] [PMC free article] [PubMed] [Google Scholar]
- [10].Hillen HS, Morozov YI, Sarfallah A, Temiakov D, Cramer P, Structural Basis of Mitochondrial Transcription Initiation, Cell. 171 (2017) 1072–1081.e10. 10.1016/j.cell.2017.10.036. [DOI] [PMC free article] [PubMed] [Google Scholar]
- [11].Posse V, Gustafsson CM, Human Mitochondrial Transcription Factor B2 Is Required for Promoter Melting during Initiation of Transcription, J. Biol. Chem. 292 (2017) 2637–2645. 10.1074/jbc.M116.751008. [DOI] [PMC free article] [PubMed] [Google Scholar]
- [12].Basu U, Lee S-W, Deshpande A, Shen J, Sohn B-K, Cho H, Kim H, Patel SS, The C-terminal tail of the yeast mitochondrial transcription factor Mtf1 coordinates template strand alignment, DNA scrunching and timely transition into elongation, Nucleic Acids Research. (2020) gkaa040. 10.1093/nar/gkaa040. [DOI] [PMC free article] [PubMed] [Google Scholar]
- [13].King GA, Hashemi Shabestari M, Taris K-KH, Pandey AK, Venkatesh S, Thilagavathi J, Singh K, Krishna Koppisetti R, Temiakov D, Roos WH, Suzuki CK, Wuite GJL, Acetylation and phosphorylation of human TFAM regulate TFAM–DNA interactions via contrasting mechanisms, Nucleic Acids Res. 46 (2018) 3633–3642. 10.1093/nar/gky204. [DOI] [PMC free article] [PubMed] [Google Scholar]
- [14].Lu B, Lee J, Nie X, Li M, Morozov YI, Venkatesh S, Bogenhagen DF, Temiakov D, Suzuki CK, Phosphorylation of Human TFAM in Mitochondria Impairs DNA Binding and Promotes Degradation by the AAA+ Lon Protease, Molecular Cell. 49 (2013) 121–132. 10.1016/j.molcel.2012.10.023. [DOI] [PMC free article] [PubMed] [Google Scholar]
- [15].Seiler CY, Park JG, Sharma A, Hunter P, Surapaneni P, Sedillo C, Field J, Algar R, Price A, Steel J, Throop A, Fiacco M, LaBaer J, DNASU plasmid and PSI:Biology-Materials repositories: resources to accelerate biological research, Nucleic Acids Res. 42 (2014) D1253–D1260. 10.1093/nar/gkt1060. [DOI] [PMC free article] [PubMed] [Google Scholar]
- [16].Cotney J, Wang Z, Shadel GS, Relative abundance of the human mitochondrial transcription system and distinct roles for h-mtTFB1 and h-mtTFB2 in mitochondrial biogenesis and gene expression, Nucleic Acids Res. 35 (2007) 4042–4054. 10.1093/nar/gkm424. [DOI] [PMC free article] [PubMed] [Google Scholar]
- [17].Lu G, Bluemling GR, Mao S, Hager M, Gurale BP, Collop P, Kuiper D, Sana K, Painter GR, De La Rosa A, Kolykhalov AA, Simple In Vitro Assay To Evaluate the Incorporation Efficiency of Ribonucleotide Analog 5′-Triphosphates into RNA by Human Mitochondrial DNA-Dependent RNA Polymerase, Antimicrob Agents Chemother. 62 (2018). 10.1128/AAC.01830-17. [DOI] [PMC free article] [PubMed] [Google Scholar]
- [18].Basu U, Mishra N, Farooqui M, Shen J, Johnson LC, Patel SS, Auto-inhibitory regulation of DNA binding by the C-terminal tails of the mitochondrial transcription factors Mtf1 and TFB2M, BioRxiv. (2020) 2020.03.06.980961. 10.1101/2020.03.06.980961. [DOI] [PMC free article] [PubMed] [Google Scholar]
- [19.Niemi NM, Wilson GM, Overmyer KA, Vögtle F-N, Myketin L, Lohman DC, Schueler KL, Attie AD, Meisinger C, Coon JJ, Pagliarini DJ, Pptc7 is an essential phosphatase for promoting mammalian mitochondrial metabolism and biogenesis, Nat Commun. 10 (2019) 3197. 10.1038/s41467-019-11047-6. [DOI] [PMC free article] [PubMed] [Google Scholar]
- [20].Falkenberg M, Gaspari M, Rantanen A, Trifunovic A, Larsson N-G, Gustafsson CM, Mitochondrial transcription factors B1 and B2 activate transcription of human mtDNA, Nat. Genet. 31 (2002) 289–294. 10.1038/ng909. [DOI] [PubMed] [Google Scholar]
- [21].Kühl I, Miranda M, Posse V, Milenkovic D, Mourier A, Siira SJ, Bonekamp NA, Neumann U, Filipovska A, Polosa PL, Gustafsson CM, Larsson N-G, POLRMT regulates the switch between replication primer formation and gene expression of mammalian mtDNA, Science Advances. 2 (2016) e1600963. 10.1126/sciadv.1600963. [DOI] [PMC free article] [PubMed] [Google Scholar]
- [22].Schwinghammer K, Cheung ACM, Morozov YI, Agaronyan K, Temiakov D, Cramer P, Structure of human mitochondrial RNA polymerase elongation complex, Nature Structural & Molecular Biology. 20 (2013) 1298–1303. 10.1038/nsmb.2683. [DOI] [PMC free article] [PubMed] [Google Scholar]
- [23].Morozov YI, Parshin AV, Agaronyan K, Cheung ACM, Anikin M, Cramer P, Temiakov D, A model for transcription initiation in human mitochondria, Nucleic Acids Res. 43 (2015) 3726–3735. 10.1093/nar/gkv235. [DOI] [PMC free article] [PubMed] [Google Scholar]
- [24].Källberg M, Wang H, Wang S, Peng J, Wang Z, Lu H, Xu J, Template-based protein structure modeling using the RaptorX web server, Nat Protoc. 7 (2012) 1511–1522. 10.1038/nprot.2012.085. [DOI] [PMC free article] [PubMed] [Google Scholar]