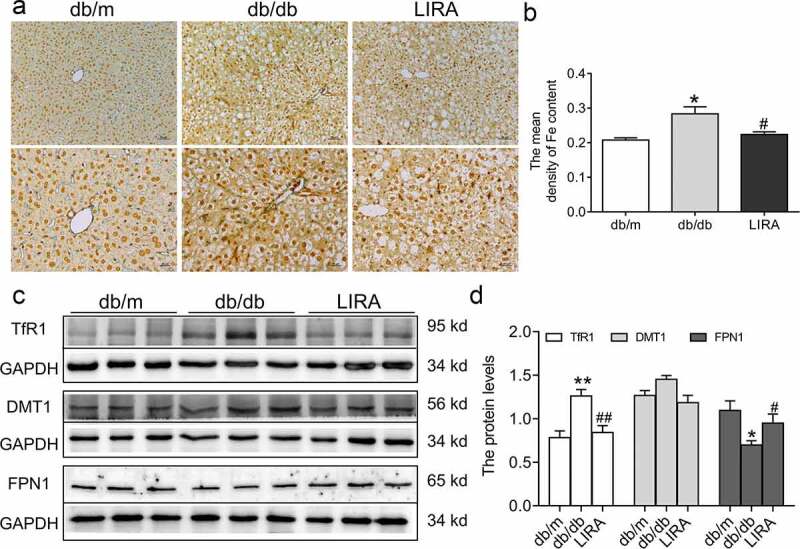
Figure 4.

The iron levels and iron-related transportproteins in the liver tissue of db/db mice. (a) The Perls’ staining of liver tissue (n = 3). (b) The mean density of Fe content as shown in panel A. (c-d) The expression and statistics of TfR1, DMT1 and FPN1 proteins (n = 6). The results are presented as the mean ± SEM. *p < 0 05, **p < 0 01 vs. db/m group. #p < 0 05, ##p < 0 01 vs. db/db group.
