
Figure 3.
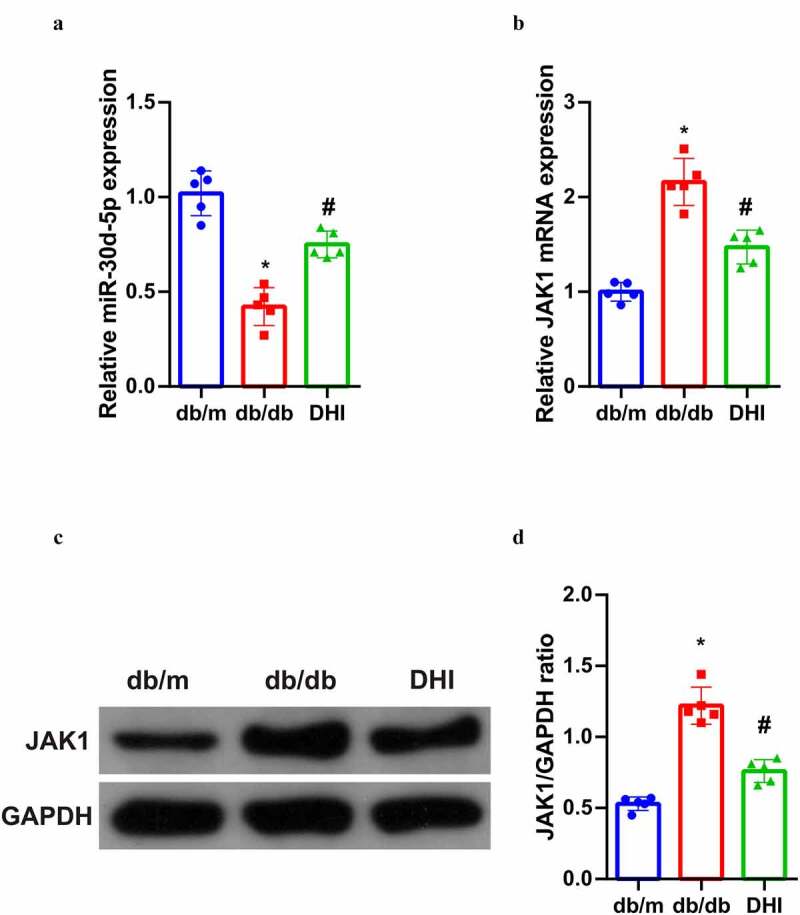
DHI regulates the miR-30d-5p-JAK1 axis in vivo.
(a/b) The expression of miR-30d-5p and JAK1 in renal tissues detected by qPCR; (c/d) the protein expression of JAK1 in renal tissues detected via Western Blot. The data were expressed as mean ± SEM, n = 5; * P < 0.05, versus db/m; # P < 0.05, versus db/db control.