Abstract
Background and Objectives
To identify clinicopathologic factors contributing to mild cognitive impairment (MCI) reversion to normal cognition.
Methods
We analyzed 3 longitudinal cohorts in this study: the Mayo Clinic Study of Aging (MCSA), the Religious Orders Study and Memory and Aging Project (ROSMAP), and the National Alzheimer's Coordinating Center (NACC). Demographic characteristics and clinical outcomes were compared between patients with MCI with or without an experience of reversion to normal cognition (referred to as reverters and nonreverters, respectively). We also compared longitudinal changes in cortical thickness, glucose metabolism, and amyloid and tau load in a subcohort of reverters and nonreverters in MCSA with MRI or PET imaging information from multiple visits.
Results
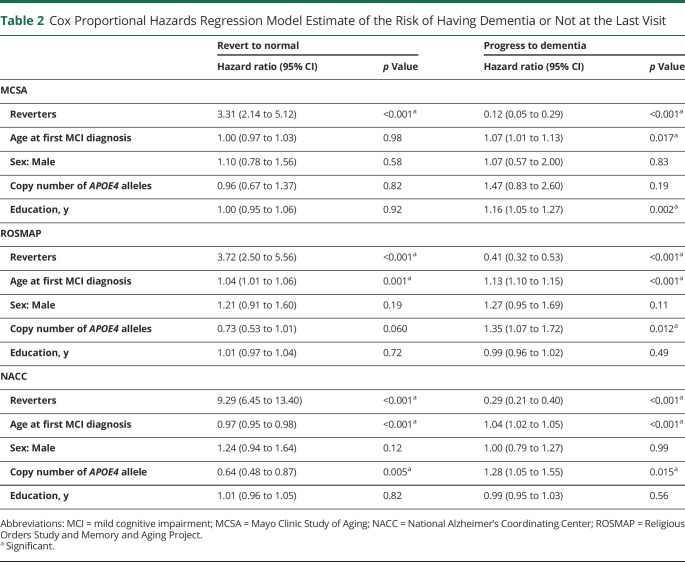
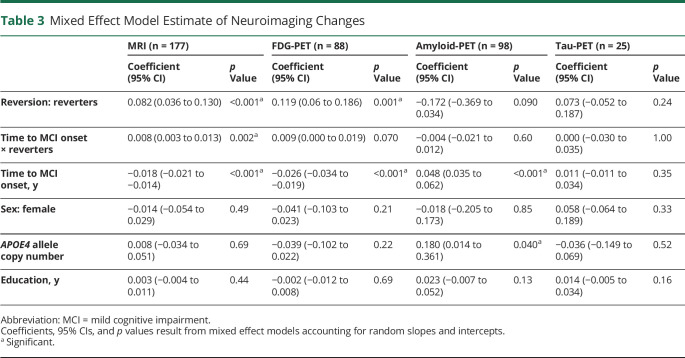
We identified 164 (56.4%) individuals in MCSA, 508 (66.8%) individuals in ROSMAP, and 280 (34.1%) individuals in NACC who experienced MCI reversion to normal cognition. Cox proportional hazards regression models showed that MCI reverters had an increased chance of being cognitively normal at the last visit in MCSA (HR 3.31, 95% CI 2.14–5.12), ROSMAP (HR 3.72, 95% CI 2.50–5.56), and NACC (HR 9.29, 95% CI 6.45–13.40) and a reduced risk of progression to dementia (HR 0.12, 95% CI 0.05–0.29 in MCSA; HR 0.41, 95% CI 0.32–0.53 in ROSMAP; and HR 0.29, 95% CI 0.21–0.40 in NACC). Compared with MCI nonreverters, reverters had better-preserved cortical thickness (β = 0.082, p <0.001) and glucose metabolism (β = 0.119, p = 0.001) and lower levels of amyloid, albeit statistically nonsignificant (β = −0.172, p = 0.090). However, no difference in tau load was found between reverters and nonreverters (β = 0.073, p = 0.24).
Discussion
MCI reversion to normal cognition is likely attributed to better-preserved cortical structure and glucose metabolism.
Mild cognitive impairment (MCI) is considered the symptomatic predementia stage of Alzheimer disease (AD).1-3 Individuals with MCI have impairments in one or more cognitive domains; however, their independent functional abilities are preserved.4-6 Studies have shown that patients with MCI have an increased risk of progression to dementia, with an annual conversion rate of 3%–10% in community settings and 10%–15% in specialty clinics.7,8 Interestingly, it was also reported that reversion to normal cognition is common among individuals with MCI (around 20% in clinical settings and 40% in community settings).9-11 However, reverters still have increased dementia risk vs cognitively normal individuals, raising the possibility that reversion can also be a result of cognitive fluctuation.11 Although multiple demographic and genetic factors have been associated with reversion,12,13 the pathophysiologic underpinnings of cognitive reversion remain understudied.
The goal of this study is to identify the clinicopathologic characteristics of MCI reverters that contribute to their reversion to normal cognition by leveraging clinical and in vivo brain imaging data from 3 well-established longitudinal cohorts: the Mayo Clinic Study of Aging (MCSA),14 Religious Orders Study and Memory and Aging Project (ROSMAP),15 and National Alzheimer's Coordinating Center (NACC) database.16
Methods
Standard Protocol Approvals, Registrations, and Patient Consents
The MCSA was approved by Mayo Clinic and Olmsted Medical Center institutional review boards. Written informed content was obtained from all participants at enrollment. ROSMAP was approved by the institutional review board of Rush University Medical Center. All participants signed written informed consent and an Anatomic Gift Act when recruited. For NACC, informed consent from the participants or their proxies was obtained through an institutional review board–approved protocol at each site.
Participant Selection
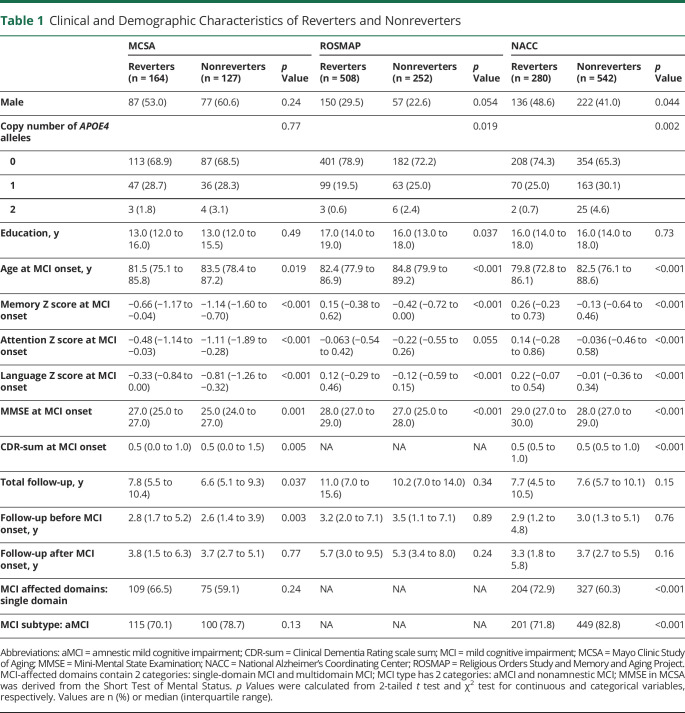
MCSA is a population-based, longitudinal study of the residents in Olmsted County, Minnesota.14 Participants in MCSA underwent neurologic and neuropsychological evaluations approximately every 15 months. ROSMAP constitutes 2 subcohorts: ROS and MAP. ROS recruited nuns, priests, and brothers across the United States and MAP enrolled participants from Chicago, Illinois.15 All participants in ROSMAP underwent annual neurologic and neuropsychological evaluations and agreed to brain donation at death. NACC data (2020 February freeze) were collected from 37 past and present Alzheimer Disease Research Centers (ADRCs) in the United States, funded by the National Institute on Aging (NIA). Participants of NACC came from clinician referral, self-referral, or public recruitment and were followed approximately annually. This study included participants from the 3 cohorts meeting the following inclusion criteria: (1) Because the vast majority of study subjects are White (97.5% in MCSA, 92.9% in ROSMAP, and 83.1% in NACC), leaving only small numbers of participants identified as another race or ethnicity (5 reverters and 1 nonreverter in MCSA; 32 reverters and 23 nonreverters in ROSMAP; 0 reverters and 70 nonreverters in NACC), we only included White participants for the analysis; (2) participants were cognitively normal at baseline (recruitment visit); (3) participants were cognitively normal, or diagnosed with MCI or dementia at all visits; (4) participants were diagnosed with MCI at least once during follow-up; (5) participants were followed for a minimum of 2 years after their initial diagnosis of MCI. Among the included MCI cases (359 in MCSA, 825 in ROSMAP, and 1,004 in NACC), individuals who had been diagnosed as cognitively normal at any visit within 2 years after MCI onset were classified as reverters; all other participants were classified as nonreverters. The demographic and clinical characteristics of the participants are summarized in Table 1. A subset of participants in MCSA with MRI or PET data from at least 2 visits were included for neuroimaging analysis.
Table 1.
Clinical and Demographic Characteristics of Reverters and Nonreverters
Cognitive Assessment and Neurologic Diagnosis
Cognitive composite scores in all cohorts were constructed with a battery of cognitive tests, and the domain-specific scores were scaled against the mean and SD of the scores of cognitively normal individuals in each cohort (eMethods 1, links.lww.com/WNL/B898). The diagnostic criteria for cognitively normal, MCI, and dementia varied slightly between cohorts. Briefly, the diagnosis of cognitively normal and MCI in MCSA was based on the consensus diagnosis of 3 independent evaluators, incorporating neuropsychological test results, clinical examinations, and additional assessments (e.g., the Short Test of Mental Status and the Clinical Dementia Rating scale (CDR).17,18 The diagnosis in NACC incorporated the CDR and neuropsychological tests. The diagnosis in ROSMAP was primarily dependent upon cognitive test results. A detailed description of the criteria is included in eMethods 2.
MRI and PET Imaging
A subset of participants in MCSA had MRI (n = 177) and PET (n = 88 for FDG-PET, n = 98 for amyloid-PET, and n = 25 for tau-PET) imaging data acquired at the normal or MCI diagnosis. The imaging acquisition has been described previously.19 Briefly, MRI was performed using a 3T scanner. The cortical thickness measure was a FreeSurfer (version 5.3) derived meta-region of interest (ROI), which was calculated as the surface area–weighted average of mean thickness in the entorhinal cortex, fusiform, inferior temporal, and middle temporal gyri. The amyloid-, tau-, and FDG-PET imaging were acquired with Pittsburgh compound B, 18F-flortaucipir, and 18F-fluorodeoxyglucose, respectively, and processed with in-house processing pipelines. The PET meta-ROIs were calculated as voxel number weighted averages of the median uptake in a set of target regions divided by the median uptake in a reference region. The amyloid-PET meta-ROI included the prefrontal, orbitofrontal, parietal, temporal, anterior, and posterior cingulate and precuneus regions and the tau-PET meta-ROI included the amygdala, entorhinal cortex, fusiform, parahippocampal, and inferior temporal and middle temporal gyri. Both the amyloid and tau-PET measures were normalized by the cerebellar crus gray matter. The FDG-PET meta-ROI included angular gyrus, posterior cingulate, and inferior temporal regions and was normalized to the uptake in pons and vermis. In addition, the regional analysis of FDG-PET, amyloid-PET, and tau-PET imaging was done using the cingulum, insula, medial temporal cortex, occipital lobe, orbitofrontal cortex, paracentral lobule, orbitofrontal cortex, paracentral lobule, parietal cortex, postcentral gyrus, prefrontal cortex, precentral gyrus, precuneus, primary visual cortex, rolandic operculum, supplementary motor area, and temporal cortex regions.
Statistical Analysis
Demographic and clinical characteristics were compared between reverters and nonreverters using an unpaired t test (continuous variables) and χ2 test (categorical variables). The risk of progression to dementia or reversion to normal in MCI reverters and nonreverters was assessed with Cox proportional hazards regression models; age at first MCI diagnosis was used as the baseline time point. For the risk of progression to dementia, censoring occurred at the date of the last clinical visit in individuals whose last diagnosis was MCI or cognitively normal. All models were adjusted for the age at first MCI diagnosis (MCI onset), sex, the copy number of APOE4 alleles, and years of education. In additional models, MCI subtypes (amnestic/nonamnestic and single domain/multiple domains) were included as covariates when the information was available. The cumulative incidence of dementia in MCI reverters and nonreverters was shown with Kaplan-Meier curves.
Changes in cortical thickness and PET imaging of Aβ, tau, and FDG in relation to the age at MCI onset was analyzed with mixed-effects linear regression models adjusting for sex, the APOE4 allele copy number, and years of education, allowing for random intercepts and slopes. All statistical tests were 2-sided and performed with R 4.0.1.20
Results
Demographics
A total of 359 participants in MCSA, 825 participants in ROSMAP, and 1,004 participants in NACC met the inclusion criteria for this study (Figure 1). The demographics and clinical characteristics of participants are shown in Table 1. A total of 164 (56.4%) participants in MCSA, 508 (66.8%) participants in ROSMAP, and 280 (34.1%) participants in NACC were MCI reverters. Compared to nonreverters, reverters were younger and had better cognitive performance in memory, attention, and language domains at MCI diagnosis (MCI onset). Although no notable difference in the APOE4 allele frequency between reverters and nonreverters was observed in MCSA (p = 0.77), we found a lower allele frequency of APOE4 in reverters in ROSMAP (p = 0.019) and NACC (p = 0.002). In addition, there was a higher percentage of single-domain MCI (p < 0.001) and a lower percentage of amnestic MCI (p < 0.001) among reverters relative to nonreverters in NACC. Interestingly, medications commonly prescribed in patients with dementia were more commonly reported in nonreverters, including memantine (p < 0.001), olanzapine (p < 0.001), and rivastigmine (p < 0.001) in NACC and donepezil in both NACC (p < 0.001) and MCSA (p = 0.005; eTable 1, links.lww.com/WNL/B898).
Figure 1. Flowchart of Participant Selection.
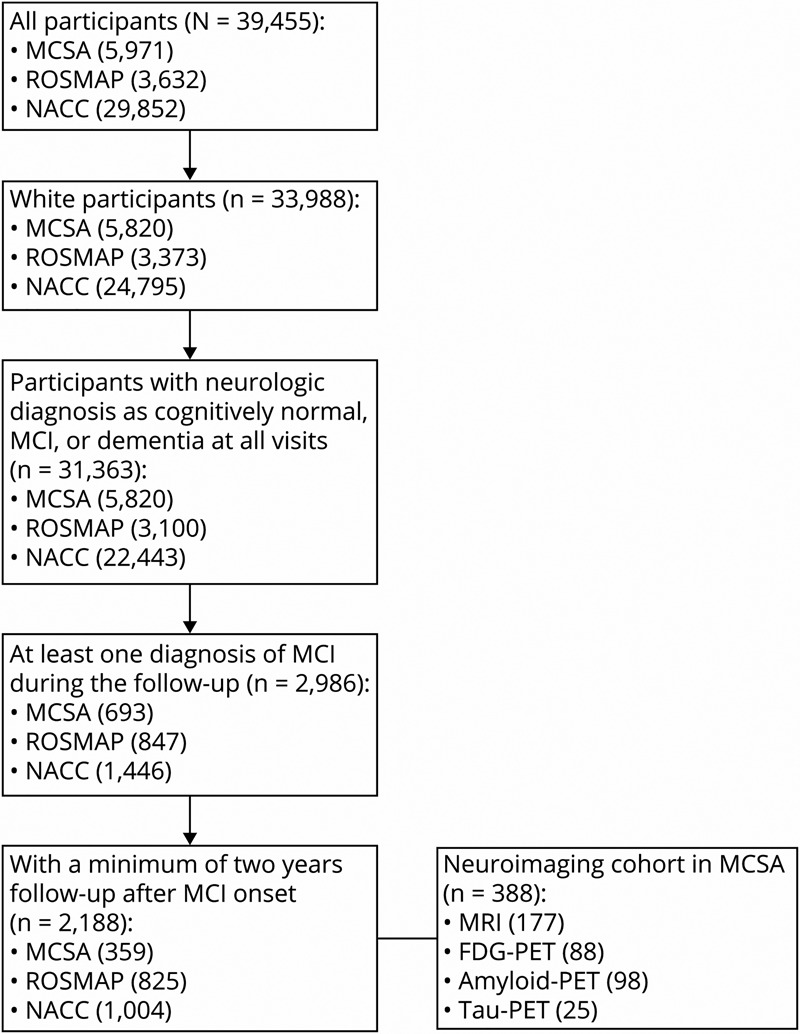
Inclusion criteria for participant selection. MCI = mild cognitive impairment; MCSA = Mayo Clinic Study of Aging; NACC = National Alzheimer's Coordinating Center; ROSMAP = Religious Orders Study and Memory and Aging Project.
Reverters Have a Lower Dementia Risk Than Nonreverters
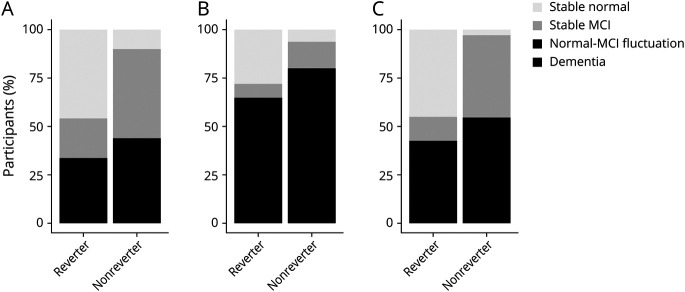
Clinically, individuals with MCI may have 4 potential cognitive outcomes21,22: (1) progression to dementia; (2) reversion to normal cognition without further change (stable normal); (3) remain stable at MCI (diagnosed as MCI at all subsequent visits); (4) fluctuation between normal cognition and MCI (fluctuation). As shown in Figure 2, most nonreverters had stable MCI (46.4% in MCSA and 42.5% in NACC) or progressed to dementia (33% in MCSA and 52.7% in NACC), whereas ∼45% became stable normal after reversion in MCSA (with a median [interquartile range (IQR)] follow-up of 3.4 [1.3, 5.1] years) and NACC (with a median [IQR] follow-up of 2.2 [1.0, 4.2] years) (Figure 2, A and C). In ROSMAP, a lower percentage (27.8%) of reverters became stable normal (with a median [IQR] follow-up of 3.0 [1.0, 6.9] years) and a higher percentage of reverters progressed to dementia (36.1%, compared with reverters in MCSA and NACC; Figure 2B). The Kaplan-Meier curve showed a higher cumulative chance of being cognitively normal (hazard ratio [HR] [95% CI] 3.31 [2.14 to 5.12] in MCSA, 3.72 [2.50 to 5.56] in ROSMAP, and 9.29 [6.45 to 13.40] in NACC) and a lower risk of developing dementia (HR [95% CI] 0.12 [0.05 to 0.29] in MCSA, 0.41 [0.32 to 0.53] in ROSMAP, and 0.29 [0.21 to 0.4] in NACC) in reverters than nonreverters during the follow-up (Figure 3, A–C and Table 2).
Figure 2. Cognitive Outcomes of Reverters and Nonreverters.
Cognitive outcomes at the last visit of reverters and nonreverters in (A) Mayo Clinic Study of Aging, (B) Religious Orders Study and Memory and Aging Project, and (C) National Alzheimer's Coordinating Center. MCI = mild cognitive impairment.
Figure 3. Kaplan-Meier Curve Depicting the Cumulative Frequency of Dementia Among Reverters and Nonreverters.
Kaplan-Meier curve showing the cumulative frequency of dementia among reverters and nonreverters in (A) Mayo Clinic Study of Aging, (B) Religious Orders Study and Memory and Aging Project, and (C) National Alzheimer's Coordinating Center. MCI = mild cognitive impairment.
Table 2.
Cox Proportional Hazards Regression Model Estimate of the Risk of Having Dementia or Not at the Last Visit
Reverters Have Greater Cortical Thickness and Brain Glucose Metabolism
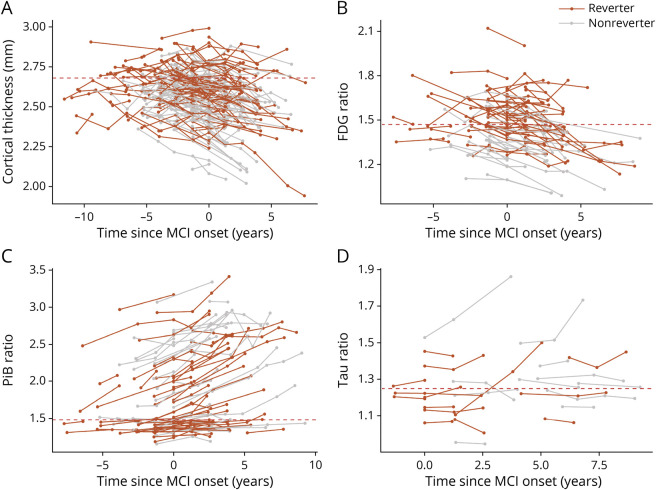
To evaluate whether the reduced dementia risk in reverters is associated with a lower burden of AD neuropathologic change (Aβ and tau burden), we examined subsets of participants in MCSA with MRI (n = 177), FDG-PET (n = 88), amyloid-PET (n = 98), or tau-PET (n = 25) imaging data from at least 2 visits using mixed-effects linear regression models (eTable 2, links.lww.com/WNL/B898). We found that reverters had greater cortical thickness on average (p < 0.001) and a slower cortical thinning rate (p = 0.002) than nonreverters (Figure 4A and Table 3). The decline rate of glucose metabolism detected by FDG-PET (measured by meta-ROI of AD-vulnerable brain regions) showed a difference between reverters and nonreverters, although not significant (Table 3; p = 0.070). Reverters also showed higher average glucose metabolism compared to nonreverters (p < 0.001, Figure 4B) and a lower amyloid load that approached statistical significance (p = 0.090). Amyloid accumulation rates were not different between groups (p = 0.60; Figure 4C and Table 3). In an exploratory analysis of 25 participants with tau-PET data, no differences in average tau burden were observed between reverters and nonreverters (p = 0.24) and tau accumulation rate (p = 1.00; Figure 4D and Table 3). Interestingly, the PET imaging results did not appear region-specific (eTable 3).
Figure 4. MRI and PET Imaging Outcomes of Reverters and Nonreverters in the Mayo Clinic Study of Aging.
(A) Cortical thinning rate detected by MRI in reverters and nonreverters. The cutoff point for neurodegeneration is indicated by the dashed red line (2.68 mm). (B) Changes in brain glucose metabolism detected by FDG-PET in reverters and nonreverters. The cutoff point for abnormal glucose metabolism is indicated by the dashed red line (1.47). (C) Brain amyloid accumulation measured by Pittsburgh compound B (PiB)–PET in reverters and nonreverters. The cutoff point for amyloid positivity is indicated by the dashed red line (1.48). (D) Brain tau pathology detected by 18F-flortaucipir-PET in reverters and nonreverters. The cutoff point for tau positivity is indicated by the dashed red line (1.25). MCI = mild cognitive impairment.
Table 3.
Mixed Effect Model Estimate of Neuroimaging Changes
Discussion
This study analyzed 3 well-characterized longitudinal cohorts, aiming to address the clinicopathologic characteristics associated with reversion to normal cognition in participants with MCI. We show that reverters have a lower dementia risk than nonreverters. Amyloid-, tau-, and FDG-PET imaging data suggest that this lower risk may be attributed to the better-preserved cortical structure and brain glucose metabolism in reverters vs nonreverters, which may support preservation or reversion of cognitive functions.
Reversion to normal cognition is common in MCI. Evidence suggests that reverters still have a higher risk of progression to MCI and dementia during follow-up than cognitively normal individuals.9,11,12 This observation raises the possibility that reversion is partially a random event due to cognitive fluctuation in the MCI to dementia trajectory. Contrary to this, our findings suggest that reverters and nonreverters have different cognitive trajectories and longer-term dementia risks. Reverters in this series had a lower dementia risk relative to nonreverters, a finding that aligns with that reported by other groups.9,11 Structural (MRI), functional (FDG-PET), and molecular (amyloid-PET and tau-PET) imaging also suggest that reverters have greater cortical thickness, slower cortical thinning, higher glucose metabolism, and potentially lower cerebral amyloid deposition. Together, these observations suggest that MCI reverters and nonreverters represent pathophysiologically heterogeneous groups.
Cortical thinning has been associated with cognitive decline and conversion to AD in MCI.23-25 Individuals with cognitive impairments display greater cortical thinning than normal controls,23 and the thinning rate in specific cortical regions may predict conversion from MCI to AD dementia with high accuracy.26,27 Glucose hypometabolism has also been associated with cognitive decline in patients with MCI and patients with AD dementia.28 Patients with MCI who convert to dementia due to AD have lower FDG-PET signals than nonconverters or cognitively normal controls.29 Furthermore, longitudinal studies showed a positive correlation between the decline rate in brain glucose metabolism and cognitive deterioration in MCI and AD.30 Thus, better preservation of cognitive functions in MCI reverters than nonreverters may be attributed to their lower cortical thinning and higher glucose metabolism in the brain.
Faster Aβ and tau accumulation in MCI have also been associated with accelerated cognitive decline28,29 and higher dementia risk,30-33 potentially through mechanisms independent of cortical thinning and glucose hypometabolism.28,31 However, we did not find significant differences in the accumulation rates of Aβ and tau between reverters and nonreverters, although cerebral amyloid levels were lower in reverters (approaching statistical significance). This observation suggests a thresholding effect of amyloid; that is, the amyloid load only affects its longitudinal accumulation after reaching a threshold, and lower levels of amyloid may indicate a lower likelihood of underlying AD neuropathology in nonreverters, which potentially contributes to cognitive resilience. Other participant-specific factors may also have contributions, including the use of medications approved for the treatment of symptomatic AD (e.g., cholinesterase inhibitors) or associated behavioral and psychiatric symptoms of dementia (e.g., antidepressants). However, several drugs commonly prescribed in patients with dementia were more commonly reported in nonreverters in NACC and MCSA (eTable 1, links.lww.com/WNL/B898), suggesting that these medications were likely prescribed in response to increasing clinical symptoms in nonreverters, and were less likely associated with resilience. Cerebrovascular disease is associated with increased risks of cognitive impairment and dementia.32,33 Data pertaining to cerebrovascular conditions were not available for participants included in our study. Further studies are needed to address the effect of cerebrovascular diseases on MCI reversion. In addition, multiple genetic and demographic factors have been associated with MCI reversion, such as absence of the APOE4 allele and higher education.12,34 Accordingly, we also observed a lower APOE4 allele frequency in reverters in ROSMAP and NACC and higher education levels in reverters in ROSMAP. Recent studies also suggest a role of bile acid and branched-chain amino acid metabolism–related genes in the acquisition of the resilient phenotype.35 In addition, 8 cortical proteins associated with cognitive resilience have been identified, including NRN1 and ACTN4.36 However, it is unclear whether and how these genes/proteins can contribute to the preservation of cortical structure and glucose metabolism of the brain.
Data in this study come from 3 well-characterized longitudinal cohorts with a high rate of follow-up and comprehensive neuropsychological assessments. The participants included in this study are from different cohorts with diverse demographic and clinical characteristics, which makes our conclusions robust. However, this study also has limitations. (1) The inclusion of 3 cohorts with different MCI diagnosis criteria may induce confounding factors such as different MCI reversion rates, which should be considered when interpreting results. (2) We do not have etiologic diagnoses of MCI, which prohibited us from studying the etiologic contribution to MCI reversion. (3) PET imaging data were only available for a subset of participants from MCSA but not for those from ROSMAP or NACC. (4) The number of participants with imaging data, especially tau-PET imaging (n = 25) in MCSA, was relatively small. Therefore, this analysis should be viewed as exploratory. Due to the limited sample size, the possibility of a type II error (i.e., a false-negative finding) needs to be considered. (5) The factors associated with cortical thickness/metabolism preservation in the cohorts remain unknown, leaving questions unanswered concerning the contributions of cerebrovascular health to resilience to structural, functional, and molecular brain changes. (6) Only White participants were included in this study due to the small number of individuals from other racial backgrounds. Further study is needed to test our findings in diverse populations.
Individuals with MCI who reverted to normal cognition had better preservation of cognitive function, cortical structure, and metabolism than nonreverters. Our study provides important information for MCI prognosis that may help to identify cognitive-preserving factors and develop cognitive-preserving therapeutics for patients with MCI.
Glossary
- AD
Alzheimer disease
- ADRC
Alzheimer Disease Research Center
- CDR
Clinical Dementia Rating
- HR
hazard ratio
- IQR
interquartile range
- MCI
mild cognitive impairment
- MCSA
Mayo Clinic Study of Aging
- NACC
National Alzheimer's Coordinating Center
- NIA
National Institute on Aging
- ROI
region of interest
- ROSMAP
Religious Orders Study and Memory and Aging Project
Appendix. Authors
Footnotes
CME Course: NPub.org/cmelist
Study Funding
The MCSA cohort was supported by the NIH (U01 AG006786, P50 AG016574, P30 AG062677, R01 AG011378, R01 AG041851, R01 NS097495), the Alexander Family Alzheimer's Disease Research Professorship of the Mayo Clinic, the Liston Award, the Schuler Foundation, the GHR Foundation, and the Mayo Foundation for Medical Education and Research and was made possible by the Rochester Epidemiology Project (R01 AG034676). The ROSMAP cohort was supported by NIA grants P30AG10161, R01AG15819, and R01AG17917. The NACC cohort was supported by NIA/NIH grant U01 AG016976. NACC data are contributed by the NIA-funded ADRCs: P30 AG019610 (PI Eric Reiman, MD), P30 AG013846 (PI Neil Kowall, MD), P50 AG008702 (PI Scott Small, MD), P50 AG025688 (PI Allan Levey, MD, PhD), P50 AG047266 (PI Todd Golde, MD, PhD), P30 AG010133 (PI Andrew Saykin, PsyD), P50 AG005146 (PI Marilyn Albert, PhD), P50 AG005134 (PI Bradley Hyman, MD, PhD), P50 AG016574 (PI Ronald Petersen, MD, PhD), P50 AG005138 (PI Mary Sano, PhD), P30 AG008051 (PI Thomas Wisniewski, MD), P30 AG013854 (PI Robert Vassar, PhD), P30 AG008017 (PI Jeffrey Kaye, MD), P30 AG010161 (PI David Bennett, MD), P50 AG047366 (PI Victor Henderson, MD, MS), P30 AG010129 (PI Charles DeCarli, MD), P50 AG016573 (PI Frank LaFerla, PhD), P50 AG005131 (PI James Brewer, MD, PhD), P50 AG023501 (PI Bruce Miller, MD), P30 AG035982 (PI Russell Swerdlow, MD), P30 AG028383 (PI Linda Van Eldik, PhD), P30 AG053760 (PI Henry Paulson, MD, PhD), P30 AG010124 (PI John Trojanowski, MD, PhD), P50 AG005133 (PI Oscar Lopez, MD), P50 AG005142 (PI Helena Chui, MD), P30 AG012300 (PI Roger Rosenberg, MD), P30 AG049638 (PI Suzanne Craft, PhD), P50 AG005136 (PI Thomas Grabowski, MD), P50 AG033514 (PI Sanjay Asthana, MD, FRCP), P50 AG005681 (PI John Morris, MD), and P50 AG047270 (PI Stephen Strittmatter, MD, PhD). This work is partially supported by the NIH grants RF1AG057181, R37AG027924, and RF1AG046205, and a Cure Alzheimer's Fund grant to G.B. and the Coins for Alzheimer's Research Trust (CART) Foundation to N.Z. The funders had no role in the design or conduct of the study; collection, management, analysis, or interpretation of the data; preparation, review, or approval of the manuscript; or the decision to submit the manuscript for publication.
Disclosure
G. Bu consults for SciNeuro and Lexeo; has consulted for AbbVie, E-Scape, Eisai, and Vida Ventures; is on the scientific advisory board for Kisbee Therapeutics; and receives funding from NIH and Cure Alzheimer's Fund. G.S. Day's research is supported by NIH, the Alzheimer's Association, and Chan Zuckerberg Initiative; he consults for Parabon Nanolabs Inc., as a Topic Editor (Dementia) for DynaMed (EBSCO) and as the Clinical Director of the Anti-NMDA Receptor Encephalitis Foundation (Canada; uncompensated); is the co-Project PI for a clinical trial in anti-NMDAR encephalitis, which receives support from Horizon Pharmaceuticals; has developed educational materials for PeerView Media, Inc., and Continuing Education Inc.; and owns stock in ANI Pharmaceuticals. M. Vassilaki has received research funding from F. Hoffmann-La Roche and Biogen. She currently consults for F. Hoffmann-La Roche, receives research funding from NIH and has equity ownership in Abbott Laboratories, Johnson & Johnson, Medtronic, and Amgen. R. Petersen consults for Nestle, Merck, Roche, Biogen, and Eisai; and is on the Data Safety Monitoring Board of Genentech. The remaining authors report no disclosures relevant to the manuscript. Go to Neurology.org/N for full disclosures.
References
- 1.Bos I, Vos S, Verhey F, et al. Cerebrospinal fluid biomarkers of neurodegeneration, synaptic integrity, and astroglial activation across the clinical Alzheimer's disease spectrum. Alzheimers Dement. 2019;15(5):644-654. [DOI] [PubMed] [Google Scholar]
- 2.Lleó A, Alcolea D, Martínez-Lage P, et al. Longitudinal cerebrospinal fluid biomarker trajectories along the Alzheimer's disease continuum in the BIOMARKAPD study. Alzheimers Dement. 2019;15(6):742-753. [DOI] [PubMed] [Google Scholar]
- 3.Guo T, Korman D, Baker SL, et al. Longitudinal cognitive and biomarker measurements support a unidirectional pathway in Alzheimer's disease pathophysiology. Biol Psychiatry. 2021;89(8):786-794. [DOI] [PMC free article] [PubMed] [Google Scholar]
- 4.Morris JC, Storandt M, Miller JP, et al. Mild cognitive impairment represents early-stage Alzheimer disease. Arch Neurol. 2001;58(3):397-405. [DOI] [PubMed] [Google Scholar]
- 5.Petersen RC, Roberts RO, Knopman DS, et al. Mild cognitive impairment: ten years later. Arch Neurol. 2009;66(12):1447-1455. [DOI] [PMC free article] [PubMed] [Google Scholar]
- 6.Langa KM, Levine DA. The diagnosis and management of mild cognitive impairment: a clinical review. JAMA. 2014;312(23):2551-2561. [DOI] [PMC free article] [PubMed] [Google Scholar]
- 7.Petersen RC, Smith GE, Waring SC, Ivnik RJ, Tangalos EG, Kokmen E. Mild cognitive impairment: clinical characterization and outcome. Arch Neurol. 1999;56(3):303-308. [DOI] [PubMed] [Google Scholar]
- 8.Petersen RC, Doody R, Kurz A, et al. Current concepts in mild cognitive impairment. Arch Neurol. 2001;58(12):1985-1992. [DOI] [PubMed] [Google Scholar]
- 9.Aerts L, Heffernan M, Kochan NA, et al. Effects of MCI subtype and reversion on progression to dementia in a community sample. Neurology. 2017;88(23):2225-2232. [DOI] [PubMed] [Google Scholar]
- 10.Canevelli M, Grande G, Lacorte E, et al. Spontaneous reversion of mild cognitive impairment to normal cognition: a systematic review of literature and meta-analysis. J Am Med Dir Assoc. 2016;17(10):943-948. [DOI] [PubMed] [Google Scholar]
- 11.Roberts RO, Knopman DS, Mielke MM, et al. Higher risk of progression to dementia in mild cognitive impairment cases who revert to normal. Neurology. 2014;82(4):317-325. [DOI] [PMC free article] [PubMed] [Google Scholar]
- 12.Koepsell TD, Monsell SE. Reversion from mild cognitive impairment to normal or near-normal cognition: risk factors and prognosis. Neurology. 2012;79(15):1591-1598. [DOI] [PMC free article] [PubMed] [Google Scholar]
- 13.Sachdev PS, Lipnicki DM, Crawford J, et al. Factors predicting reversion from mild cognitive impairment to normal cognitive functioning: a population-based study. PLoS One. 2013;8(3):e59649. [DOI] [PMC free article] [PubMed] [Google Scholar]
- 14.Roberts RO, Geda YE, Knopman DS, et al. The Mayo Clinic Study of Aging: design and sampling, participation, baseline measures and sample characteristics. Neuroepidemiology. 2008;30(1):58-69. [DOI] [PMC free article] [PubMed] [Google Scholar]
- 15.Bennett DA, Buchman AS, Boyle PA, Barnes LL, Wilson RS, Schneider JA. Religious Orders study and Rush memory and aging Project. J Alzheimers Dis. 2018;64(s1):S161–s189. [DOI] [PMC free article] [PubMed] [Google Scholar]
- 16.Beekly DL, Ramos EM, Lee WW, et al. The National Alzheimer's Coordinating Center (NACC) database: the uniform data set. Alzheimer Dis Assoc Disord. 2007;21(3):249-258. [DOI] [PubMed] [Google Scholar]
- 17.Kokmen E, Smith GE, Petersen RC, Tangalos E, Ivnik RC. The short test of mental status: correlations with standardized psychometric testing. Arch Neurol. 1991;48(7):725-728. [DOI] [PubMed] [Google Scholar]
- 18.Morris JC. The Clinical Dementia Rating (CDR): current version and scoring rules. Neurology. 1993;43(11):2412-2414. [DOI] [PubMed] [Google Scholar]
- 19.Jack CR, Jr., et al. Defining imaging biomarker cut points for brain aging and Alzheimer's disease. Alzheimers Dement. 2017;13(3):205-216. [DOI] [PMC free article] [PubMed] [Google Scholar]
- 20.Team RC. R: A Language and Environment for Statistical Computing. R Foundation for Statistical Computing; 2020. [Google Scholar]
- 21.Ganguli M, Snitz BE, Saxton JA, et al. Outcomes of mild cognitive impairment by definition: a population study. Arch Neurol. 2011;68(6):761-767. [DOI] [PMC free article] [PubMed] [Google Scholar]
- 22.Thomas KR, Edmonds EC, Eppig JS, et al. MCI-to-normal reversion using neuropsychological criteria in the Alzheimer's Disease Neuroimaging Initiative. Alzheimers Dement. 2019;15(10):1322-1332. [DOI] [PMC free article] [PubMed] [Google Scholar]
- 23.Pacheco J, Goh JO, Kraut MA, Ferrucci L, Resnick SM. Greater cortical thinning in normal older adults predicts later cognitive impairment. Neurobiol Aging. 2015;36(2):903-908. [DOI] [PMC free article] [PubMed] [Google Scholar]
- 24.Singh V, Chertkow H, Lerch JP, Evans AC, Dorr AE, Kabani NJ. Spatial patterns of cortical thinning in mild cognitive impairment and Alzheimer's disease. Brain. 2006;129(Pt 11):2885-2893. [DOI] [PubMed] [Google Scholar]
- 25.Márquez F, Yassa MA. Neuroimaging biomarkers for Alzheimer's disease. Mol Neurodegener. 2019;14(1):21. [DOI] [PMC free article] [PubMed] [Google Scholar]
- 26.Bakkour A, Morris JC, Dickerson BC. The cortical signature of prodromal AD: regional thinning predicts mild AD dementia. Neurology. 2009;72(12):1048-1055. [DOI] [PMC free article] [PubMed] [Google Scholar]
- 27.Eskildsen SF, Coupé P, García-Lorenzo D, Fonov V, Pruessner JC, Collins DL. Prediction of Alzheimer's disease in subjects with mild cognitive impairment from the ADNI cohort using patterns of cortical thinning. Neuroimage. 2013;65:511-521. [DOI] [PMC free article] [PubMed] [Google Scholar]
- 28.Hammond TC, Xing X, Wang C, et al. β-amyloid and tau drive early Alzheimer's disease decline while glucose hypometabolism drives late decline. Commun Biol. 2020;3(1):352. [DOI] [PMC free article] [PubMed] [Google Scholar]
- 29.Pagani M, Nobili F, Morbelli S, et al. Early identification of MCI converting to AD: a FDG PET study. Eur J Nucl Med Mol Imaging. 2017;44(12):2042-2052. [DOI] [PubMed] [Google Scholar]
- 30.Landau SM, Harvey D, Madison CM, et al. Associations between cognitive, functional, and FDG-PET measures of decline in AD and MCI. Neurobiol Aging. 2011;32(7):1207-1218. [DOI] [PMC free article] [PubMed] [Google Scholar]
- 31.Perani D. FDG-PET and amyloid-PET imaging: the diverging paths. Curr Opin Neurol. 2014;27(4):405-413. [DOI] [PubMed] [Google Scholar]
- 32.Dufouil C, Godin O, Chalmers J, et al. Severe cerebral white matter hyperintensities predict severe cognitive decline in patients with cerebrovascular disease history. Stroke. 2009;40(6):2219-2221. [DOI] [PubMed] [Google Scholar]
- 33.Ivan CS, Seshadri S, Beiser A, et al. Dementia after stroke: the Framingham study. Stroke. 2004;35(6):1264-1268. [DOI] [PubMed] [Google Scholar]
- 34.Li Z, Shue F, Zhao N, Shinohara M, Bu G. APOE2: protective mechanism and therapeutic implications for Alzheimer's disease. Mol Neurodegener. 2020;15(1):63. [DOI] [PMC free article] [PubMed] [Google Scholar]
- 35.Dumitrescu L, Mahoney ER, Mukherjee S, et al. Genetic variants and functional pathways associated with resilience to Alzheimer's disease. Brain. 2020;143(8):2561-2575. [DOI] [PMC free article] [PubMed] [Google Scholar]
- 36.Yu L, Tasaki S, Schneider JA, et al. Cortical proteins associated with cognitive resilience in community-dwelling older persons. JAMA Psychiatry. 2020;77(11):1172-1180. [DOI] [PMC free article] [PubMed] [Google Scholar]


