Abstract
Tobacco products cause about 1 in 5 deaths premature deaths each year. With increased retailing of both tobacco and electronic nicotine delivery systems (ENDS) products, cancer centers such as City of Hope are prioritizing tobacco and ENDS control. Therefore, we conducted formative geospatial analyses of dedicated smoke and vape shops linked to neighborhood demographic characteristics. The objective of the study was to analyze local data on smoke and vaping shop locations by age, socio-economic status, and racial/ethnic group. Our geospatial analysis used aggregate data from the U.S. Census, Google Maps, and Yelp. Geospatial maps were created using ArcGIS Pro with American Community Survey and U.S. Census 2010. The distributions of exclusive tobacco and vaping shop locations data were overlaid with data from the U.S. Census 2010 to generate maps of the relative geographic distributions of shops across varying area demographic characteristics. Results showed that a higher concentration of exclusive smoke and vaping shops were in areas with a higher concentration of ethnic minorities and lower income and lower status neighborhoods. These findings suggest that laws and licensing should be evaluated to regulate the placement of these shops to reduce and even prevent targeting of minorities and other vulnerable populations.
Keywords: tobacco, vaping, geospatial analysis, health disparities, San Gabriel Valley
1. INTRODUCTION
Evidence shows that all tobacco products deliver carcinogens—cancer causing chemicals. Lung cancer, primarily caused by tobacco use, is among the deadliest cancers. Globally, each year there are 2.09 million incident cases and 1.76 million deaths (International Agency for Research on Cancer, 2018). Health risks from tobacco exposure are related not only to lung and head and neck cancers, but cardiovascular diseases, chronic obstructive pulmonary disease (COPD), other multiple serious diseases, disability, and premature death (Bonnie, Stratton, & Kwan, 2015). Moreover, tobacco can adversely alter the effects of many types of medications, treatment response and outcomes, diminishes overall health status, impairs immune function, and reduces quality of life (Satcher, 2020). Moreover, in the United States (U.S.) smoking can be linked to ~1 in 5 deaths or 480,000 per year.
California has 2.8 million adult smokers (Vuong, Zhang, & Roeseler, 2019), with over 1 million tobacco users residing in the City of Hope (COH) cancer center catchment area. In California, it is estimated that each year 40,000 Californians will die from diseases caused by smoking and secondhand smoke exposure. According to the current state of tobacco control report, 16 out of 35 cities in San Gabriel Valley (SGV) located in the cancer center catchment area scored the lowest tobacco control grade (F), most of these cities have high concentration of Hispanic and Chinese American residents (American Lung Association. 2020).
Recent epidemiologic trends show notable improvements in lung cancer outcomes among all U.S. populations, but disparities for Blacks still persist. Despite the fact that African Americans usually smoke fewer cigarettes and start smoking cigarettes at a later age, they tend to have higher mortality from smoking-related diseases than their White counterparts (Jamal et al., 2016). They have the highest percentage of menthol cigarette use, which is more addictive and harmful, and more than half of the youth smokers use menthol product (Centers for Disease Control and Prevention, 2020a). In California, there are roughly 19% of African American smokers compared to 8% aggregated Asian groups and 13.5% Whites. African American children and adults are also more likely to be exposed to secondhand smoke than any other racial or ethnic groups (Centers for Disease Control and Prevention, 2020b).
Cigarette use in the U.S. has steadily declined since 1965 from 42% to an estimated 14 % of adults in 2017 (National Cancer Institute, 2020). The reduction in cigarette use is driven in part by public health information and social stigma placed on tobacco smoke and other tobacco products. The Family Smoking Prevention and Tobacco Control Act (P.L. 111-31) that took effect in 2009 established the authority of the Food and Drug Administration to regulate tobacco marketing, required smokeless tobacco warning labels, verification of claims of “modified risk” have scientific validity, and required disclosure of ingredients in tobacco products. The federal government efforts to decrease tobacco smoke product use from the 1960s is a positive aspect in the combat against tobacco-related diseases.
Despite the success to reduce tobacco cigarette use, other options have arisen for cigarette smokers. The most rapidly growing area of the tobacco industry has been electronic cigarettes (e-cigs) (U.S. Department of Health and Human Services, 2016), but other tobacco products include smokeless tobacco and “heat not burn” (HNB) cigarettes (Hagiwara, 2018) other choices available. Complicating the studies on these compounds are reports financed by the tobacco industry (World Health Organization, 2004), some of which have suspect data due to commercial interests.
Electronic Nicotine Delivery Systems (ENDS) have flooded the marketplace in recent years and with cleaver marketing have swayed and cultivated new tobacco product users. There are numerous delivery systems that have varied from a form that is generally associated with regular cigarettes, to those with larger reservoirs of e-liquid, to individual packaged e-liquid containers with the appearance of computer flash drives. Aside from the delivery methods, some ENDS (e.g., JUUL6) have nicotine content up to 7%, which is greater than the nicotine content in 20 cigarettes. The ease of hiding some e-cig devices and the flavorings that often resemble fruits or other sweet consumables has attracted many adolescents to vaping. The approximately 7,000 unique e-cig flavors noted in 2014 (Zhu et al., 2014) are even greater now, with only limited U.S. government regulation. Evidence linked to health effects detailed in a National Academies report suggest that e-cigs present unique risks that are currently being investigated (Qasim et al., 2017).
Given the disastrous consequences and recent trends of tobacco and ENDS product use, it is necessary to understand the context in which tobacco use occurs in order to adequately address this critical public health problem. Exploring the geographic distribution of smoke and vaping shops ethnic and socioeconomic population characteristics provides rigorous data to understand tobacco use and inform tobacco control. Therefore, the objective of this California Cancer Center study was to describe the geographic distribution of smoke and vape shop locations by age, gender, and racial/ethnic group in our local Catchment area using geospatial analysis.
2. METHODS
The current study utilized an ecological study design to examine whether the spatial distribution of smoke and vape shops was related to population-level demographics. Aggregate spatial and demographic data came from Google Maps, Yelp, U.S. Census, and Environmental Systems Research Institute (Esri). Data were collected for all 31 cities in San Gabriel Valley, CA.
2.1. Geographical unit
The geographic area of investigation for the study was Public Health Service Planning 3 of San Gabriel Valley in Los Angeles (LA) County, CA, which is where City of Hope National Medical Center is located. SPA 3 is approximately 400 square miles with approximately 1.8 million residents (Los Angeles County Economic Development Corporation, 2020). About 6% of the SPA 3 population are African American, 45% are Latinos and 30% are Asian, indicating that the region has one of the largest majority Latino and Asian American populations in the U.S. (Greater San Gabriel Valley Hospital Collaborative, 2020).
2.2. Smoke and vape shop data
Geographic data of smoke and vaping shops were collected by searching Google Maps and Yelp using the name of the city and “smoke shop” as keywords. The study only focused on smoke and vape shops that were dedicated tobacco product outlets. Thus, we did not include other retailers that sold tobacco products such as convenience stores, supermarkets, and gas stations. In addition, we identified smoke and vape shops together instead of separately because smoke stores usually sell both traditional cigarettes and electronic delivery systems (e.g., ENDS, e-cigarettes).
The data collected included information on the shop name, address, and zip code for all active smoke shops in the San Gabriel Valley area as of February 2020. All geographic data collected were stored in a comma separated values (CSV) that can be read directly by ArcGIS Pro, which is a spreadsheet data file with data records and separated by commas (Carnes, 2019).
2.3. Census data
Sociodemographic data at the census tract level for each city came from the 2010 U.S. Census data, American Community Survey 5-Year Estimates Data (2014–2018), and 2017 American Community Survey (ACS) Demographic and Housing Estimates.
The layer of 2019 U.S. median household income came from the Esri 2019 Updated Demographic estimates using Census 2010 geographies, which included the median household income in the U.S. in 2019 in a multiscale map by state, county, ZIP Code, tract, and block group (Environmental Systems Research Institute, 2019a). The unit of median income estimation was in current dollars with adjustment for inflation and/or cost-of-living increases (Environmental Systems Research Institute, 2019a). When the median was in the interval other than the first or last, the layer added used Pareto Interpolation, which estimated the median and other properties of a population that follows a Pareto distribution (Stults, n.d.). In addition, linear interpolation was used for the lowest interval (<$10,000) (Environmental Systems Research Institute, 2019a). The median was represented by the value of $500,001 when it fell in the upper income interval of $500,000+ (Environmental Systems Research Institute, 2019a).
The layer of socioeconomic status (NSES Index) by census tract depicted the socioeconomic status of each census tract based on the U.S. Census Bureau’s 2011–2015 American Community Survey, because according to Miles et al. (2015), “neighborhood socioeconomic status, over and above individual household socioeconomic status, is a predictor of many health outcomes. The layer used a scale from 0 to 100 with 50 being the national average to incorporate indicators including median household income, percent of households with income below the federal poverty line, educational attainment of adults (age 25+), unemployment rate, and percent of households with children under the age of 18 that are “female-headed” (no male present) (Environmental Systems Research Institute, 2020b). The formula used was NSES = log(median household income) + (−1.129 * (log(percent of female-headed households))) + (−1.104 * (log(unemployment rate))) + (−1.974 * (log(percent below poverty))) + .451*((high school grads)+(2*(bachelor’s degree holders))) (Environmental Systems Research Institute, 2020b).
The layer for the race and Hispanic origin variables showed the population based on race and Hispanic origin by tract, county, and state boundaries (Environmental Systems Research Institute, 2020c). Data from this layer is updated annually to include the most currently released ACS 5-year data with estimates along with margins of error (Environmental Systems Research Institute, 2020c). The layer included percentages, derived counts, and associated margins of errors, which were calculated values that followed the specifications defined by the American Community Survey (Environmental Systems Research Institute, 2020c).
The layer for school district boundaries for Los Angeles County was obtained from the Administrator for the Los Angeles GeoHub. The layer displayed the school district boundaries and contained two types of school districts: split districts and unified school districts (Environmental Systems Research Institute, 2020d). For the current study, we used unified school districts for the analysis, which combined the elementary school districts and middle/high school districts.
The layer for Los Angeles County EA30 L included elementary school distribution, community, region, zip code, and other data for Los Angeles County (Environmental Systems Research Institute, 2020e). This layer was created by Claremont Colleges based on the U.S. Census 2010 data. The layer was used to show the boundaries of Los Angeles County and elementary school locations.
2.4. Spatial analyses
The current study applied an ecological approach to descriptively assess and analyze the potential association between demographic features and smoke and smoke shop distribution in San Gabriel Valley, CA. All analyses were conducted using ArcGIS Pro and ArcGIS Online. Geospatial mapping visualized the spatial patterns of vape and smoke shop locations by census tract or block group levels and compared them with other socio-ecologic variables (e.g., incomes, ethnic groups).
First, the comma separate values (CSV) file that included all spatial data for the vape and smoke shops were read and geocoded into ArcGIS Pro and ArcGIS Online. A basic map was created to show the distribution of all smoke shops. By using the median household income layer and the race and Hispanic origin layer as the base map, an explicit distribution of smoke shops was provided based on the demographic data.
Second, in order to analyze potential spatial patterns, density analysis was conducted based on quantities of vape and smoke shops; these quantities were spread across the map. The calculation of smoke shop density was based on the number of shops per area and showed the minimum value per square mile from high to low. In addition, by organizing the base maps by different layers and boundaries, the density of smoke shops was shown based on relevant demographic characteristics. The goal of the density analysis was to show the concentrations of smoke shops combined with demographic factors as well as the unified school district boundaries.
Finally, a proximity analysis was conducted. For the elementary school distribution layer, buffers were created to show areas of equal distance from elementary schools. There is no specific regulation of distance between smoke shops and schools in LA County. However, in Santa Clara County, “no permit may be issued to authorize retailing at any location within 1,000 feet of a school” (Santa Clara County, 2020). Thus, our study also used the distance of 1,000 feet from schools. Combined with the smoke and vape shop location analysis based on unified school districts, this analysis aimed to determine if a high proportion of smoke shops were concentrated around elementary schools.
3. RESULTS
Our analyses identified a total of 194 devote smoke shops surrounding our Cancer Center Region. Table 1 shows the total population, youth percentage of the total population, median household income, and the number of smoke shops in 35 cities in San Gabriel Valley. Data are summarized based on the 2014–2018 American Community Survey 5-Year Estimates.
Table 1.
Demographic information of San Gabriel Valley city and smoke/vape shops.
| San Gabriel Valley City | Total Population | Youth (10–19 yr) (% of city population) | Median Household Income ($) | Percent below Poverty Level (% of city population) | Percent High School Graduate or Higher | Number of Smoke Shop | Number of Smoke Shops per Square Mile |
|---|---|---|---|---|---|---|---|
| Alhambra | 84,974 | 9.40% | 57,117 | 14.00% | 81.90% | 3 | 0.395 |
| Altadena | 45,146 | 11.00% | 94,507 | 8.60% | 88.70% | 2 | 0.230 |
| Arcadia | 58,207 | 13.80% | 92,102 | 9.50% | 92.10% | 6 | 0.550 |
| Azusa | 49,544 | 15.60% | 60,227 | 15.00% | 78.90% | 10 | 1.031 |
| Baldwin Park | 76,222 | 14.40% | 62,227 | 14.00% | 66.70% | 4 | 0.606 |
| Claremont | 36,025 | 17.84% | 97,363 | 8.30% | 94.20% | 3 | 0.226 |
| Citrus | 10,771 | 14.00% | 74,479 | 9.00% | 71.30% | 0 | 0 |
| City of industry | 344 | 11.00% | 85,417 | 5.80% | 84.50% | 3 | 0.254 |
| Covina | 48,403 | 14.40% | 69,449 | 8.70% | 85.90% | 8 | 1.143 |
| Diamond Bar | 56,434 | 11.90% | 96,628 | 6.30% | 93.80% | 3 | 0.201 |
| Duarte | 21,713 | 12.00% | 73,429 | 11.20% | 83.90% | 4 | 0.597 |
| El Monte | 115,669 | 13.90% | 47,121 | 20.80% | 57.80% | 12 | 1.250 |
| Glendora | 51,773 | 13.10% | 92,674 | 8.90% | 90.10% | 11 | 0.567 |
| Hacienda Heights | 54,970 | 12.00% | 84,219 | 8.30% | 86.70% | 4 | 0.357 |
| Irwindale | 1,405 | 14.30% | 59,375 | 8.80% | 73.40% | 0 | 0 |
| La Cañada Flintridge | 20,374 | 15.60% | 7161,51 | 3.30% | 97.80% | 0 | 0 |
| La Puente | 40,268 | 14.90% | 61,054 | 17.50% | 61.70% | 7 | 2.000 |
| La Verne | 32,358 | 12.60% | 85,769 | 7.70% | 92.10% | 4 | 0.476 |
| Montebello | 63,099 | 12.50% | 53,677 | 13.40% | 72.70% | 2 | 0.241 |
| Monrovia | 37,006 | 12.20% | 73,170 | 7.90% | 89.30% | 5 | 0.368 |
| Monterey Park | 60,792 | 9.70% | 57,265 | 14.00% | 78.40% | 2 | 0.260 |
| Pasadena | 141,246 | 9.40% | 78,941 | 15.70% | 88.10% | 12 | 0.522 |
| Pico Rivera | 63,432 | 14.20% | 65,666 | 10.00% | 71.30% | 4 | 0.482 |
| Pomona | 152,494 | 15.70% | 55,115 | 20.10% | 68.70% | 13 | 0.568 |
| Rowland Heights | 50,602 | 9.80% | 72,147 | 11.00% | 86.10% | 6 | 0.458 |
| Rosemead | 54,417 | 11.70% | 52,057 | 15.70% | 65.50% | 7 | 1.346 |
| San Dimas | 34,239 | 12.40% | 84,749 | 8.60% | 93.00% | 8 | 0.533 |
| San Gabriel | 40,242 | 10.20% | 57,863 | 12.30% | 79.00% | 6 | 1.463 |
| San Marino | 13,285 | 13.60% | 9159,50 | 9.10% | 97.80% | 0 | 0 |
| Sierra Madre | 11,006 | 9.30% | 96,630 | 5.70% | 98.70% | 0 | 0 |
| Temple City | 36,137 | 11.40% | 70,984 | 11.50% | 84.70% | 3 | 0.750 |
| Walnut | 30,008 | 10.80% | 6104,09 | 7.10% | 92.20% | 6 | 0.667 |
| West Covina | 107,242 | 12.40% | 79,140 | 9.60% | 85.10% | 13 | 0.813 |
| West Puente Valley | 23,629 | 12.70% | 71,586 | 9.90% | 67.30% | 0 | 0 |
| Whittier | 86,523 | 13.80% | 73,517 | 10.80% | 86.40% | 23 | 1.575 |
Figure 1a shows the smoke shop density based on income distribution by overlaying density result. In addition, Figure 1b shows the smoke shop density based on socioeconomic status by overlaying density result. These maps indicated that areas with lower median household income have a greater smoke shop density since higher density fell into lower income/SES areas.
Figure 1 (a).
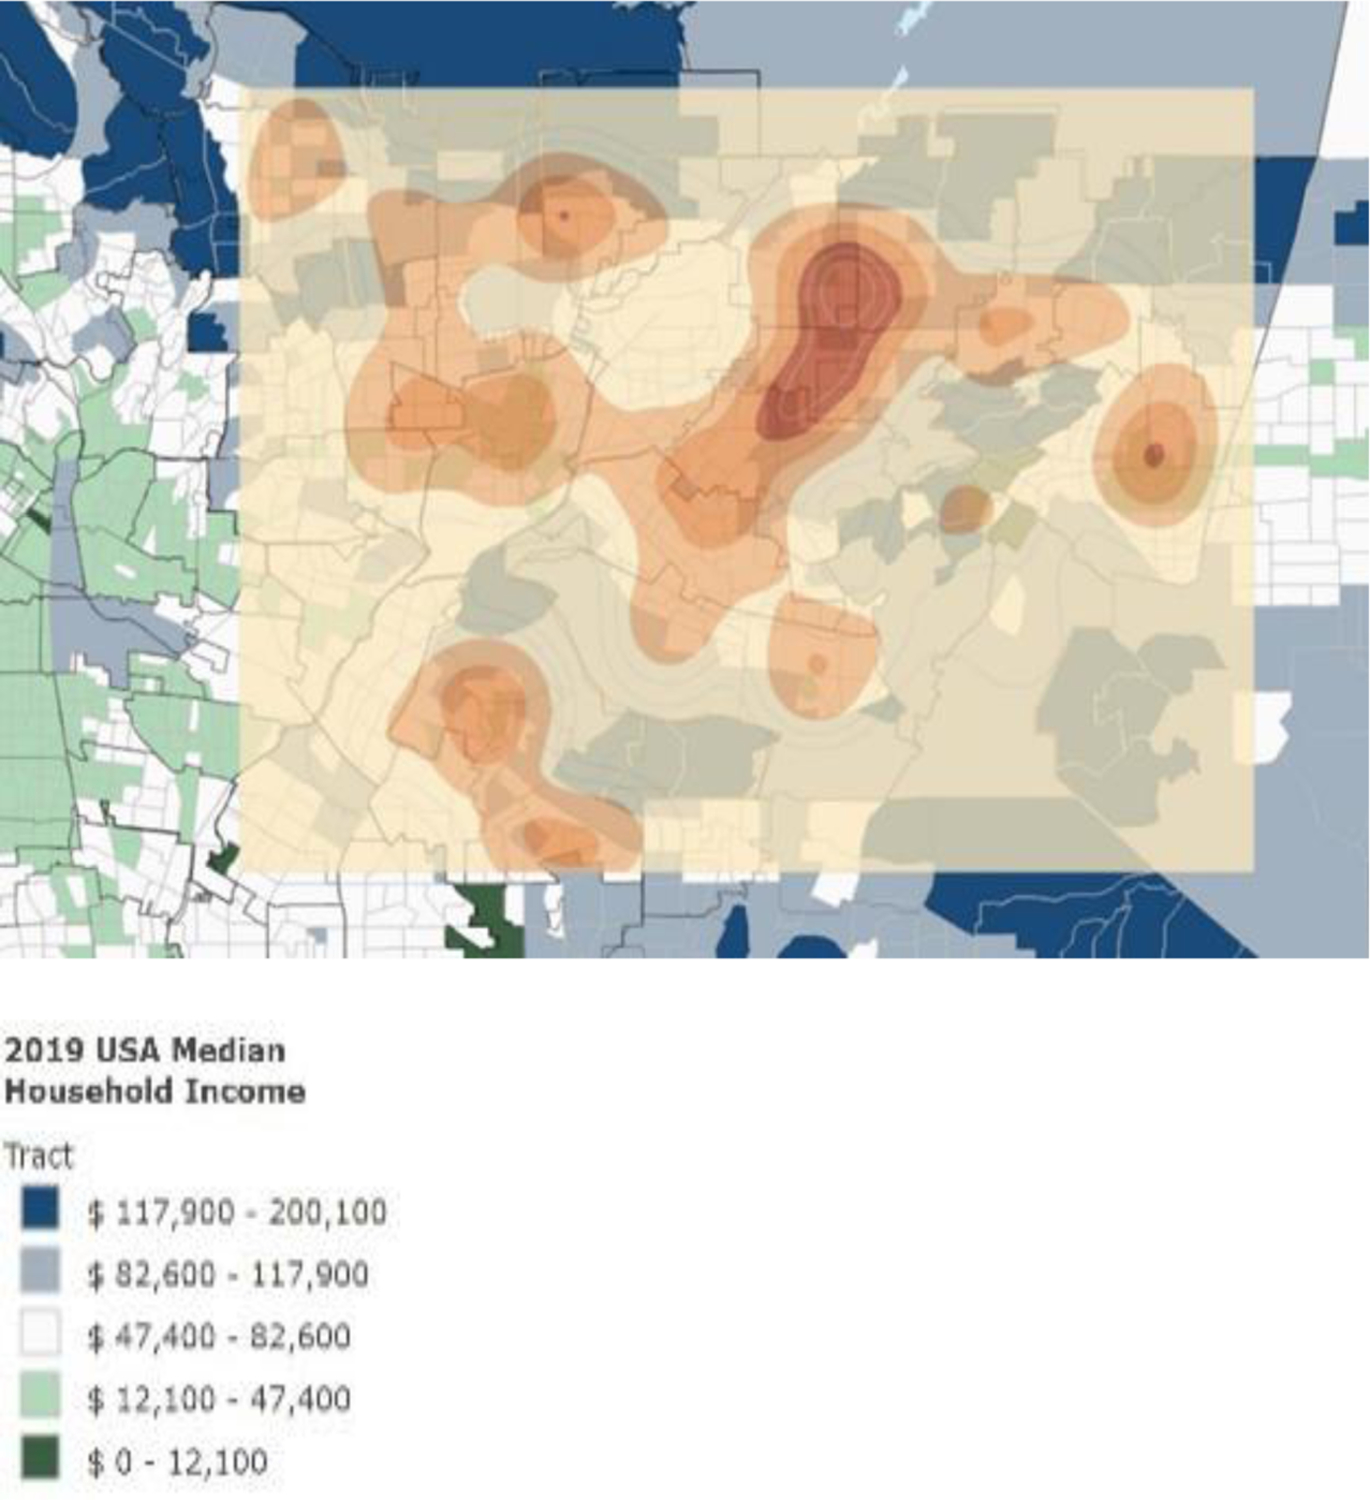
Maps showing smoke shop density by income distribution
Figure 1 (b).
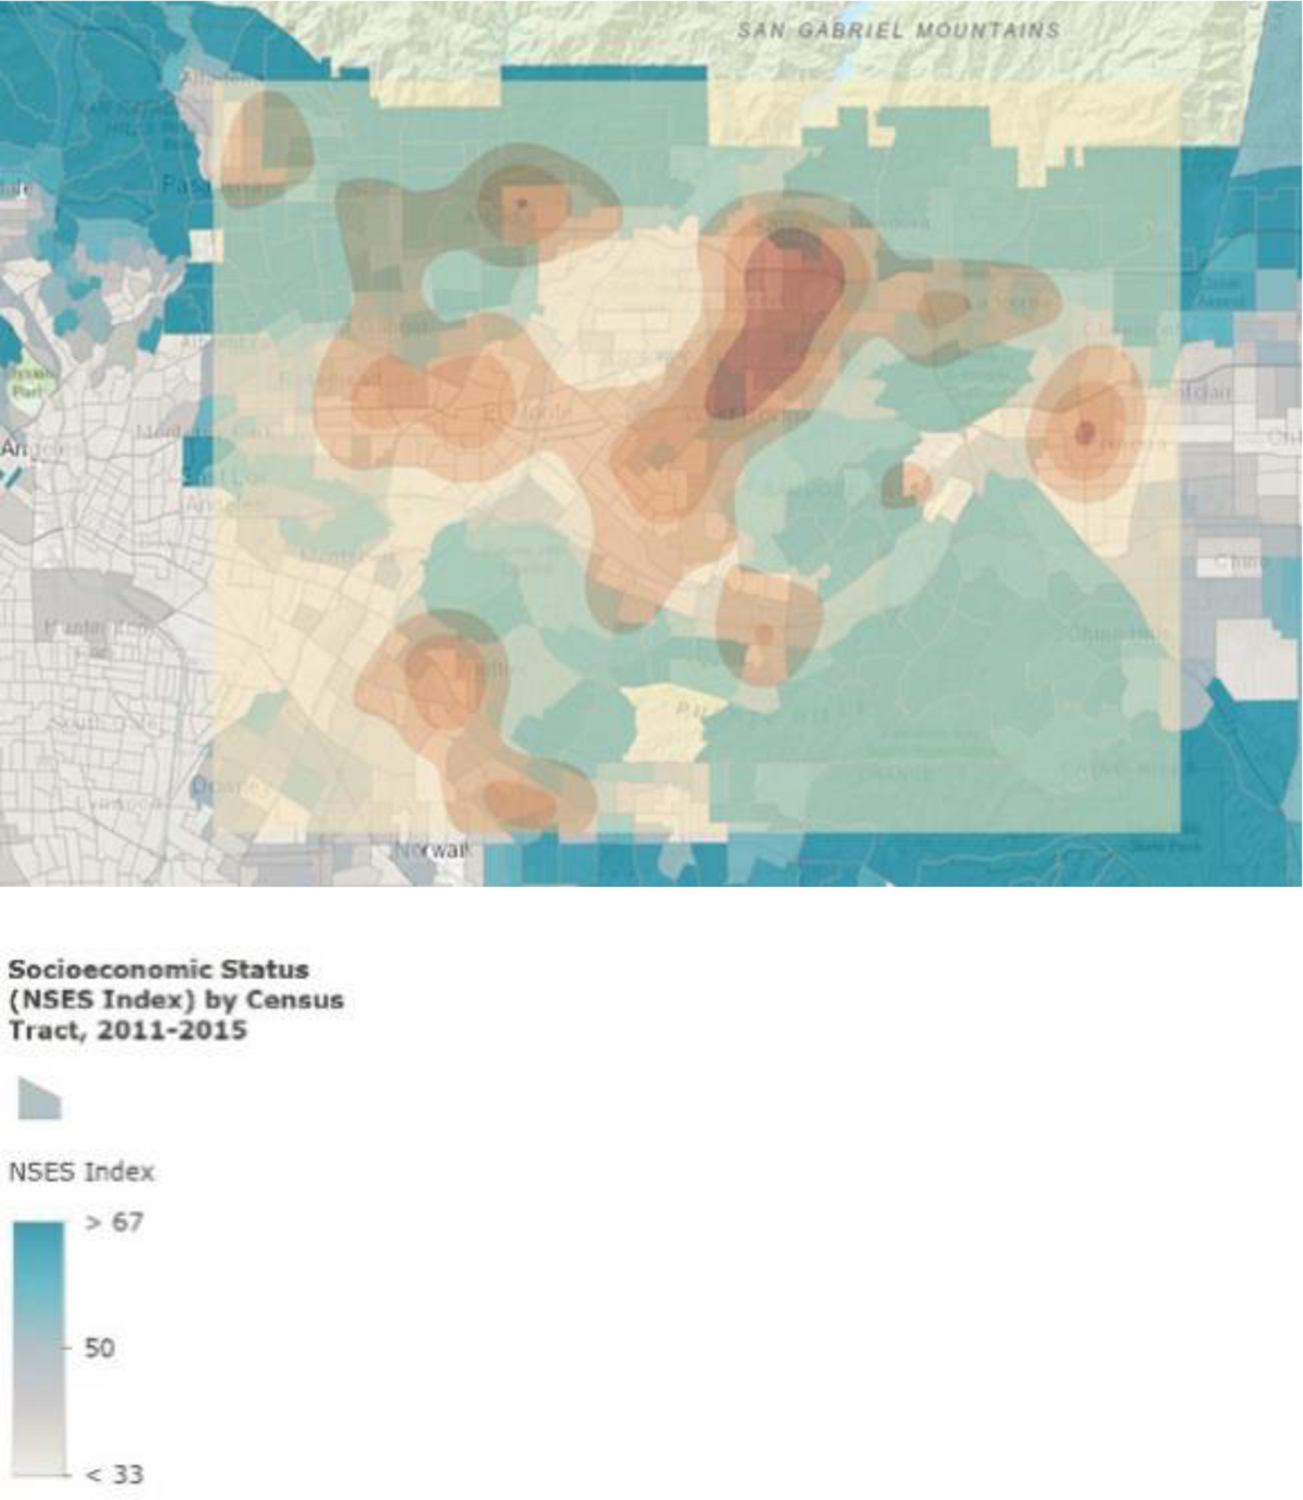
Maps showing smoke shop density based on socioeconomic status
Figure 2a shows the smoke shop locations based on race and Hispanic origin distribution. Figure 2b shows the smoke shop density based on race and Hispanic origin distribution by overlaying density result. Figure 2b indicated that areas with greater proportions of minority residents have a greater smoke shop density.
Figure 2.
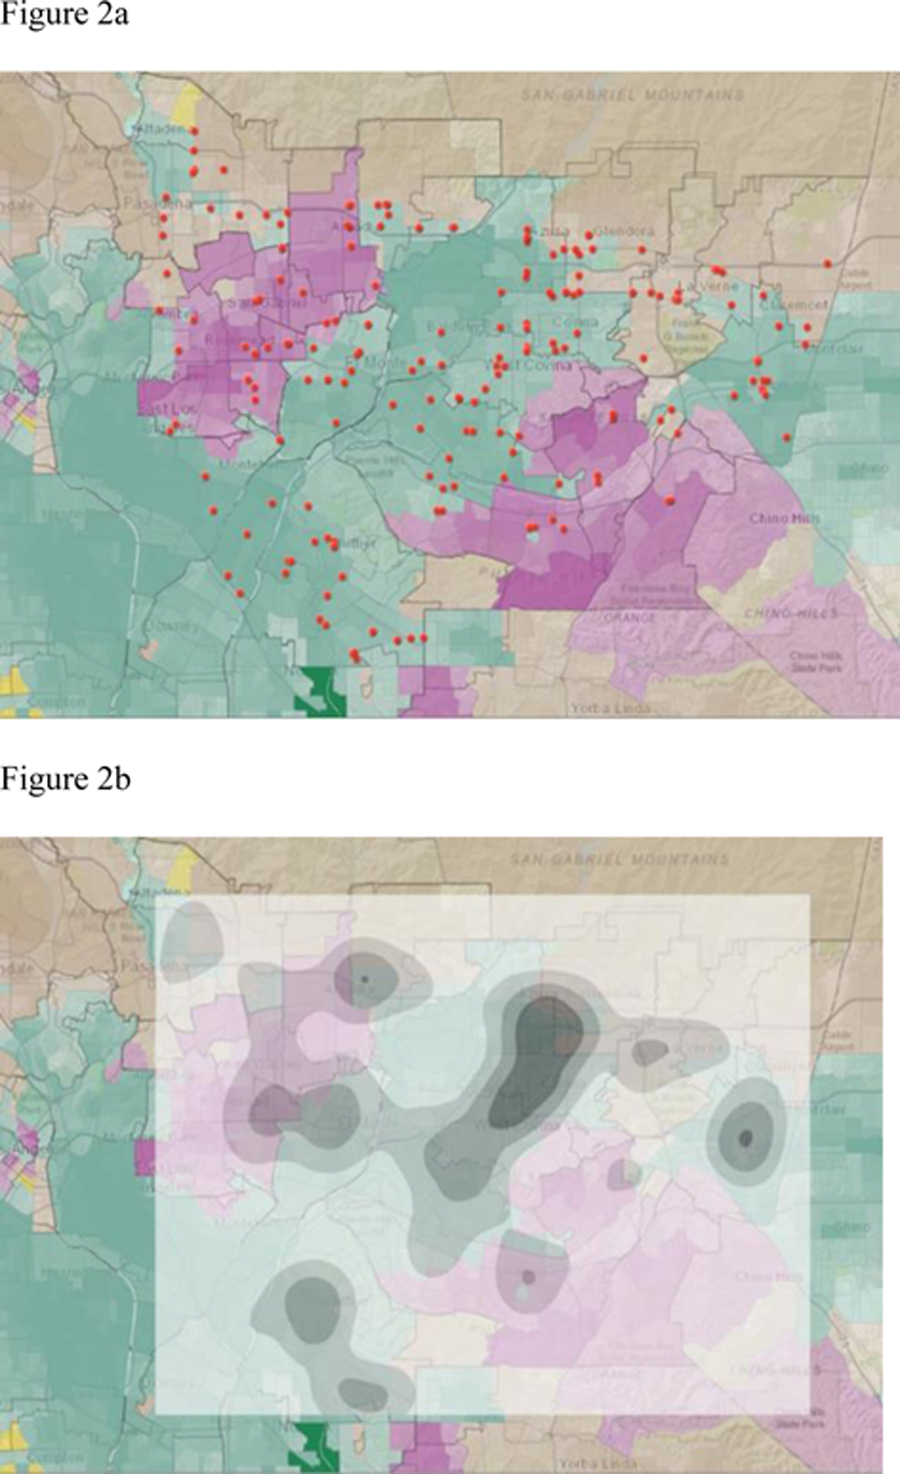
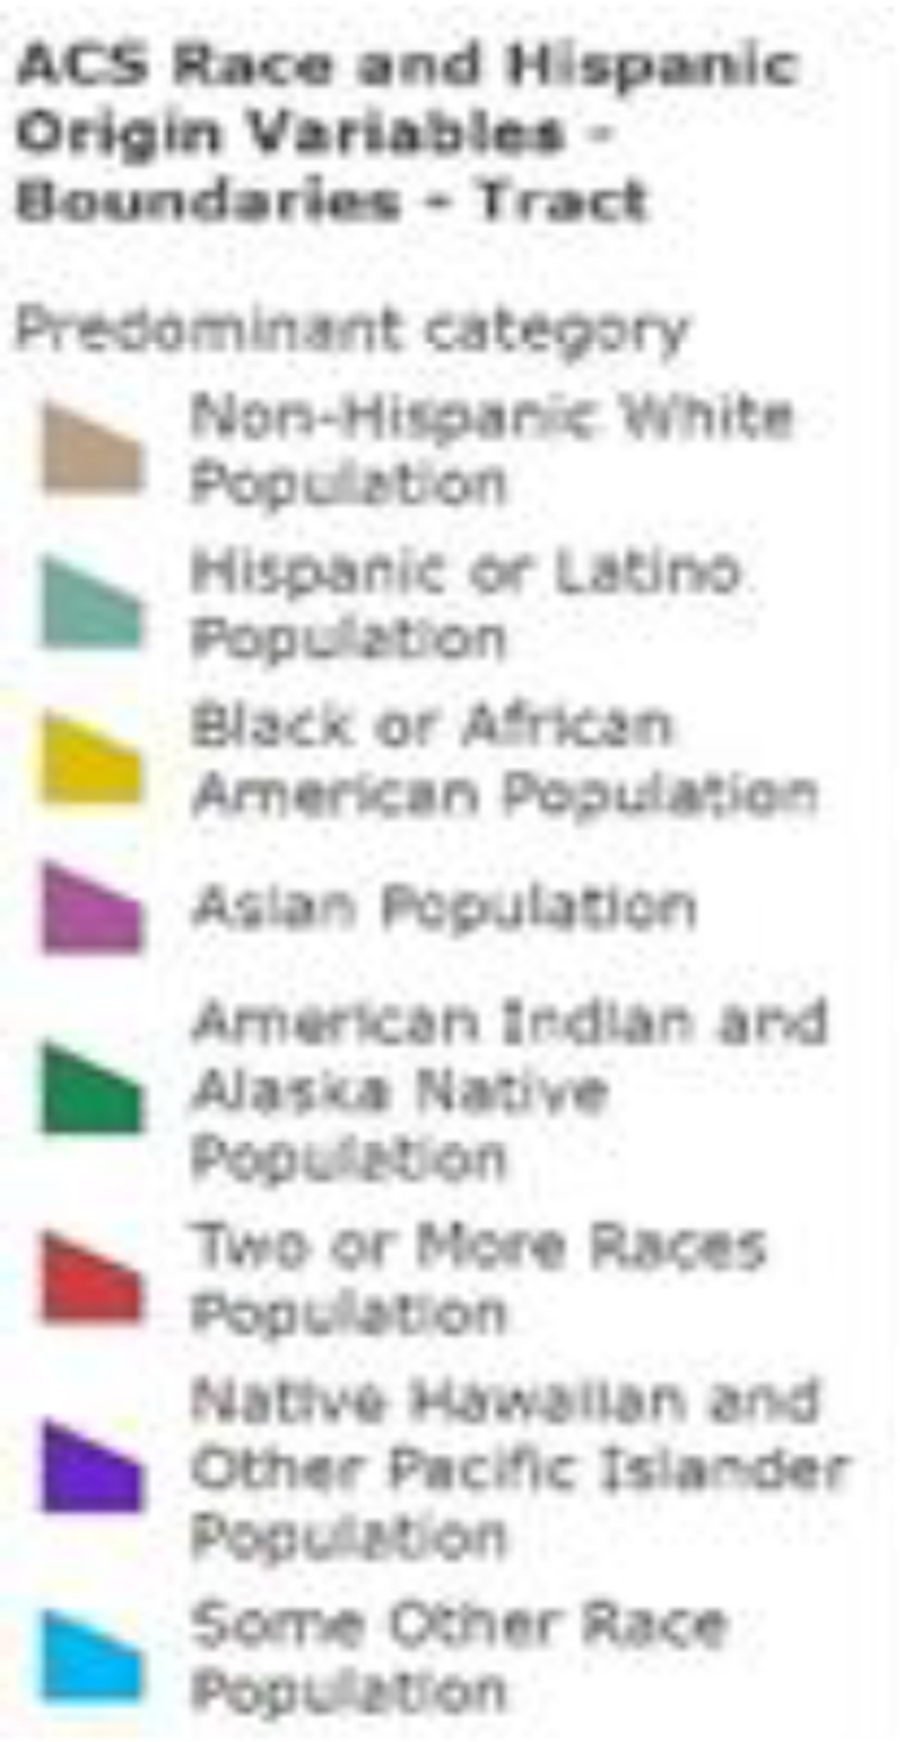
Maps showing the smoke shop locations based on race and Hispanic origin distribution (a), and the smoke shop density based on race and Hispanic origin distribution (b)
Figure 3 shows smoke shop locations combined with buffers of elementary schools (buffered by 1000 feet, represented by blue spots; smoke shops were represented by red spots)
Figure 3.
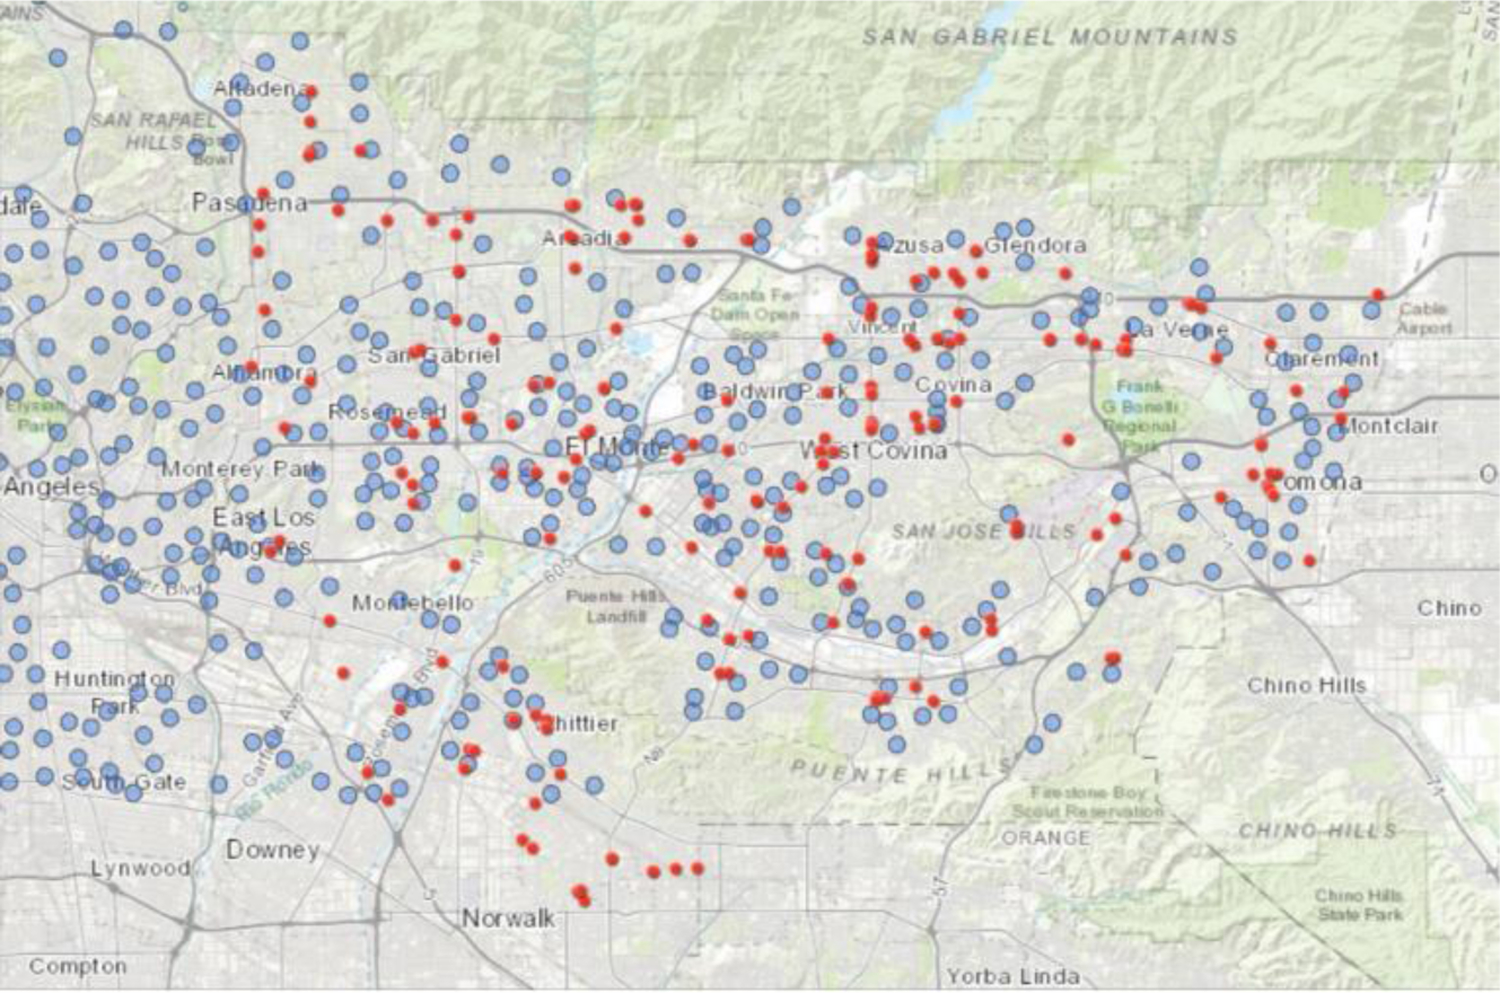
shows smoke shop locations combined with buffers of elementary schools (buffered by 1000 feet, represented by blue spots; smoke shops were represented by red spots).
4. DISCUSSION
This study was done as part of building a sustainable tobacco control program at our Cancer Center at COH. In this informative phase, we sought to better define and understand smoke/vape shop location in reference to population characteristics including ethnicity/race, socioeconomic status. Our analyses identified a total of 194 dedicated smoke/vape shops surrounding the 35 largest cities within our Cancer Center Region. That is an average of over 5.5 shops per city. The range was 0–23 shops per city. Geographic and population-specific analyses revealed that neighborhoods with lower income and higher minority populations had a greater number of smoke/vape shops. Some of our hardest hit communities have three (3) smoke and vape shops per square mile.
This spatial analysis study offers timely evidence to inform and improve the state and local public health practice and policy strategies. For instance, strengthening local ordinances by restricting tobacco retailers from being within a certain distance of schools and parks based on proximity to other retailers or populations, introducing smoke-free policy to eliminate secondhand smoke in multi-unit housing, and extending the selling and secondhand smoke laws to new and emerging tobacco products, including flavored tobacco products to reduce the appeal to the youth.
To achieve our Cancer Center’s goal of comprehensive tobacco and cancer control, it is imperative to inform best practices and population health tobacco control priorities with state and county public health departments, local tobacco control coalitions, school districts, community healthcare providers, and communities, as well as the broader public health advocacy and organizations. Multi-sectoral approaches and interventions are recommended such as public health education and awareness campaign to deliver strategic, culturally, linguistically, and age appropriate, high-impact messages; community activation and mobilization, youth and parental engagement; and broadening of tobacco use screening and brief intervention to the underage population. Sustainable youth tobacco control requires continuous efforts and commitments from all sectors. It is important to support parents, teachers, and healthcare providers to communicate, identify, and intervene on the issue in a timely manner, and to empower youth to stand against tobacco use and tobacco industry tactics, speak out and reach out for cessation support. With the increasing trend of vaping and marijuana use among teens in California and nationwide, local surveillance and research will also be required.
Limitations
This preliminary investigation sets the foundation for a cancer center to build a robust program of both clinical care and research addressing tobacco control and cessation, related diseases and disparities. Still, there are some limitations. One limitation of this study is that the data used were not from the exact same years given that the most currently available Census data is 2010. Thus, there may be inconsistencies with the timeframes. Future studies may use and analyze data at the same time to improve consistency. This study used basic spatial analysis method to state the potential relations between smoke shops and demographic variables. Future study will focus on more complex spatial and statistical methods to figure out associations between smoke/vape shop distributions and social demographic factors. In addition, this study focused on elementary schools due to limited data resources targeting schools. However, middle schools and high schools should also be considered since they may have heavier users compared to elementary schools. Future studies would figure out spatial data of middle schools/high schools and explore the geospatial relationship among smoke shops and middle schools/high schools. Future studies could also analyze changes and potential impacts of new policies on both electronic retailing and the placement of smoke and vape shops using updated demographic and income data. This paper made a geospatial analysis of dedicated tobacco and vape shop locations by using multiple GIS spatial analysis method, and considered the factors like age, socio-economic status, and racial/ethnic group. The findings could help to regulate the placement of these shops to reduce and even prevent targeting of minorities and other vulnerable populations.
In summary, our results may aid targeted legislative and public health efforts to address tobacco related health disparities and how tobacco/nicotine companies flood the marketplace with electronic nicotine delivery systems resulting in the detrimental high rates of nicotine use among teenagers. Moreover, economically stressed neighborhoods are often characterized by proximity to freeways, heavier traffic flow, population density, less green space and more retail outlets selling both alcohol and tobacco products. Unfortunately, these neighborhoods have less access to low-cost healthy foods. From studies by others, we know that tobacco and alcohol retail density have an inverse relationship with the availability of healthy food (Macdonald, Olsen, Shortt, & Ellaway, 2018); Schneider & Gruber, 2013; Shortt et al., 2015). In other words, taking a social determinants of health approach in comprehensive tobacco prevention and control will be necessary to achieve equity and eliminate tobacco-related disparities. Society needs to change this reality. Studies like this can empower residents, national, state and local politicians, and community advocates with the data they need to bring forth tobacco/ENDS regulation changes that will result in healthier communities and improve the chances that children and adolescents will grow up tobacco-free.
Funding:
This study was supported by a grant from the California Tobacco-Related Disease Research Program (Grant number: 28IR-0050).
Footnotes
Conflicts of interest: The authors declare that there is no conflict of interest.
References
- American Lung Association. (2020). State of Tobacco Control 2020: California Local Grades. Accessed May 20, 2020. https://www.lung.org/getmedia/929a93c8-2c09-4dea-b9da-4edfe1fb84df/2020-sotc-california-full.pdf.
- Bonnie RJ, Stratton K, & Kwan LY (Eds.). (2015). Public health implications of raising the minimum age of legal access to tobacco products. Washington, DC: National Academies Press. [PubMed] [Google Scholar]
- California Department of Public Health: Sacramento, CA. Accessed May 20, 2020. https://www.cdph.ca.gov/Programs/CCDPHP/DCDIC/CTCB/CDPH%20Document%20Library/ResearchandEvaluation/FactsandFigures/CATobaccoFactsandFigures2019.pdf.
- Carnes B (2019). What is a CSV File and How to Open the CSV File Format? Accessed April 3, 2020. https://www.freecodecamp.org/news/what-is-a-csv-file-and-how-to-open-the-csv-file-format/.
- Centers for Disease Control and Prevention. (2020a). Menthol and Cigarettes. Accessed April 3, 2020. https://www.cdc.gov/tobacco/basic_information/tobacco_industry/menthol-cigarettes/index.html.
- Centers for Disease Control and Prevention. (2020b). African Americans and Tobacco Use. Accessed April 3, 2020. https://www.cdc.gov/tobacco/disparities/african-americans/index.htm.
- Environmental Systems Research Institute. (2019a). USA Median Household Income. Accessed April 1, 2020. https://agis.maps.arcgis.com/home/item.html?id=a95db032417f40579fb68ff98ca14847.
- Environmental Systems Research Institute. (2020b). Socioeconomic Status (NSES Index) by Census Tract, 2011–2015. Accessed April 1, 2020. https://agis.maps.arcgis.com/home/item.html?id=2a98d90305364e71866443af2c9b5d06.
- Environmental Systems Research Institute. (2020c). ACS Race and Hispanic Origin Variables - Boundaries. Accessed April 1, 2020. https://agis.maps.arcgis.com/home/item.html?id=23ab8028f1784de4b0810104cd5d1c8f.
- Environmental Systems Research Institute. (2020d). School District Boundaries for Los Angeles County. Accessed April 1, 2020. https://agis.maps.arcgis.com/home/item.html?id=07a10be1eb674ca99fd147474e1e0ca0.
- Environmental Systems Research Institute. (2020e). School District Boundaries for Los Angeles County. Accessed April 1, 2020. https://agis.maps.arcgis.com/home/item.html?id=03721a3c8fc44151ae0db279602ec614.
- Greater San Gabriel Valley Hospital Collaborative. (2020). Greater San Gabriel Valley Community Health Snapshot. Accessed May 15, 2020. http://publichealth.lacounty.gov/chs/Docs/SGV_Snapshot.pdf.
- Hagiwara SI (2018). Effects of heat-not-burn tobacco on health are different from conventional cigarrette. European Respiratory Journal, 52(Suppl 62), PA1727. [Google Scholar]
- International Agency for Research on Cancer. (2018). Lung Fact Sheet. Accessed May 20, 2020. https://gco.iarc.fr/today/data/factsheets/cancers/15-Lung-fact-sheet.pdf.
- Jamal A, King BA, Neff LJ, Whitmill J, Babb SD, & Graffunder CM (2016). Current cigarette smoking among adults—United States, 2005–2015. Morbidity and Mortality Weekly Report, 65(44), 1205–1211. [DOI] [PubMed] [Google Scholar]
- Los Angeles County Economic Development Corporation. (2020). San Gabriel Valley. Accessed May 15, 2020. https://laedc.org/wtc/chooselacounty/regions-of-la-county/san-gabriel-valley-2/.
- Macdonald L, Olsen JR, Shortt NK, & Ellaway A (2018). Do ‘environmental bads’ such as alcohol, fast food, tobacco, and gambling outlets cluster and co-locate in more deprived areas in Glasgow City, Scotland? Health & Place, 51, 224–231. [DOI] [PMC free article] [PubMed] [Google Scholar]
- Miles JN, Weden MM, Lavery D, Escarce JJ, Cagney KA, & Shih RA (2016). Constructing a time-invariant measure of the socio-economic status of US census tracts. Journal of Urban Health, 93(1), 213–232. [DOI] [PMC free article] [PubMed] [Google Scholar]
- National Cancer Institute. (2020). Adult Tobacco Use. Accessed April 3, 2020. https://progressreport.cancer.gov/prevention/adult_smoking.
- Qasim H, Karim ZA, Rivera JO, Khasawneh FT, & Alshbool FZ (2017). Impact of electronic cigarettes on the cardiovascular system. Journal of the American Heart Association, 6(9), e006353. [DOI] [PMC free article] [PubMed] [Google Scholar]
- Santa Clara County. (2020). CHAPTER XXII. - PERMITS FOR RETAILERS OF TOBACCO PRODUCTS: Sec. B11–579. - Eligibility requirements for a permit. Accessed April 1, 2020. https://library.municode.com/ca/santa_clara_county/codes/code_of_ordinances?nodeId=TITBRE_DIVB11ENHE_CHXXIIPERETOPR_SB11-579ELREPE.
- Satcher D (2020). Reducing tobacco use: A report of the surgeon general—2000. ONCOLOGY, 34(3),1764–1765. [PubMed] [Google Scholar]
- Schneider S, & Gruber J (2013). Neighbourhood deprivation and outlet density for tobacco, alcohol and fast food: first hints of obesogenic and addictive environments in Germany. Public Health Nutrition, 16(7), 1168–1177. [DOI] [PMC free article] [PubMed] [Google Scholar]
- Shortt NK, Tisch C, Pearce J, Mitchell R, Richardson EA, Hill S, & Collin J (2015). A cross-sectional analysis of the relationship between tobacco and alcohol outlet density and neighbourhood deprivation. BMC Public Health, 15(1), 1–9. [DOI] [PMC free article] [PubMed] [Google Scholar]
- Stults BJ (n.d.). Deriving median household income. Accessed April 1, 2020. http://mumford.albany.edu/census/CityProfiles/Profiles/MHHINote.htm.
- Vuong TD, Zhang X, & Roeseler A (2019). California Tobacco Facts and Figures 2019. Accessed April 1, 2020. https://www.cdph.ca.gov/Programs/CCDPHP/DCDIC/CTCB/CDPH%20Document%20Library/ResearchandEvaluation/FactsandFigures/CATobaccoFactsandFigures2019.pdf.
- U.S. Department of Health and Human Services. (2016). E-cigarette use among youth and young adults: A report of the Surgeon General. Accessed May 14, 2020. https://www.ncbi.nlm.nih.gov/books/NBK538679/.
- World Health Organization. (2004). The Tobacco Industry Documents: What They Are, What They Tell Us, and How to Search Them. Accessed May 15, 2020. https://www.who.int/tobacco/communications/TI_Manual_3March05.pdf.
- Zhu SH, Sun JY, Bonnevie E, Cummins SE, Gamst A, Yin L, & Lee M (2014). Four hundred and sixty brands of e-cigarettes and counting: implications for product regulation. Tobacco Control, 23(suppl 3), iii3–iii9. [DOI] [PMC free article] [PubMed] [Google Scholar]


