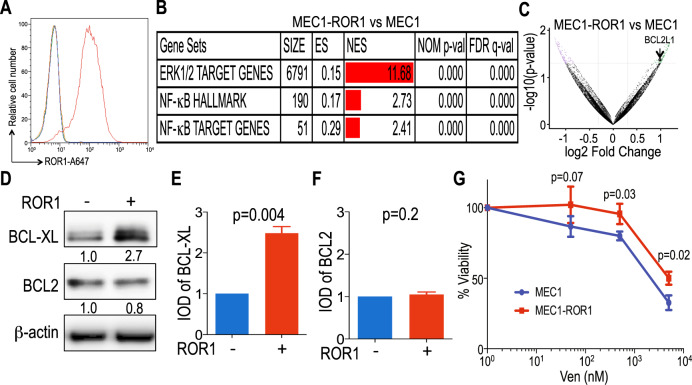
Fig. 2. Relative expression of ROR1-regulated target genes and venetoclax sensitivity of MEC1 versus MEC1-ROR1.
A ROR1 protein expression levels (AbMFI) measured by flow cytometry on MEC1 and MEC1-ROR1 cells labeled with A647-conjugated anti-ROR1 mAb (blue and red histograms, respectively) or A647-conjugated nonspecific IgG of the same isotype (green and orange histograms). B GSEA on the transcriptomes of MEC1 versus MEC1-ROR1, evaluating for differences in the expression of genes associated with ROR1 regulated pathways [19, 21, 39]. Gene-set size (SIZE), enrichment score (ES), normalized ES (NES), nominal p value (NOM p-val), and FDR q value (FDR q) are indicated. C Volcano plot showing differences in gene expression between MEC1-ROR1 versus MEC1. The log2 of the fold change (Log2 Fold Change) is on the X axis, and the negative log of p-value (-Log10 p-Value) is on the Y axis. Vertical dashed lines indicate fold change of 1.2 and −1.2, respectively. Horizontal dashed line indicates a p-Value of 0.05. Each dot represents a gene within the comparison performed. The coloring on the dots reflects whether each gene is significantly overexpressed (green) or under-expressed (purple) in MEC1-ROR1 versus MEC1, and those in black are genes that were not significantly overexpressed or under-expressed in MEC1-ROR1 versus MEC1. The significant overexpression of BCL2L1 gene in MEC1-ROR1 is indicated. D BCL-XL and BCL2 protein expression levels assessed by immunoblot analysis on MEC1 and MEC1-ROR1 cells. The membranes were probed with a monoclonal antibody specific for BCL-XL, BCL2, or β-actin, as indicated on the left margin. The density of the β-actin band was used to normalize band density for BCL-XL or BCL2. The IOD ratios of the band densities of BCL-XL/β-actin normalized with respect to that of MEC1 cells are indicated at the bottom of BCL-XL immunoblots and presented in the bar graph in panel (E). The IOD ratios of the band densities of BCL2/β-actin normalized with respect to that of MEC1 cells are indicated at the bottom of BCL2 immunoblots and presented in the bar graph in panel (F). E, F The IOD ratios of BCL-XL (E) or BCL2 (F) are shown as the mean ± SD of three independent immunoblots. Statistical significance was determined by Student’s t test. G MEC1 (blue) and MEC1-ROR1 (red) cells were treated with different concentrations of venetoclax (0.05 μM to 5 μM) and cell viability was assessed by CellTiter-Glo viability assay at 24 h. The fraction surviving venetoclax therapy is expressed relative to that of the untreated (DMSO) control. Data are summarized as the mean ± SEM of three independent experiments.

