Abstract
Purpose
This study was designed to measure the concentrations of heavy (Pb, Cu, Fe, Ni, and Zn) metals in water, soil, and frequently edible leafy vegetables in the Iranian population and assessed the carcinogenic and non-carcinogenic health risk in consumers.
Methods
The samples of soil, water, and vegetables were collected from forms near the Tehran-Mashhad highway in Neyshabur, Iran. The content of heavy metals in the samples was analyzed using Atomic Absorption Spectrophotometry.
Results
The average concentrations of Pb, Cu, Fe, Ni, and Zn were 5.56, 3.35, 4.74, 2.95, and 5.27 mg/kg, respectively. Lead concentration in all of the vegetable samples was higher than the permissible value endorsed by the World Health Organization (WHO) / Food and Agriculture Organization (FAO). In contrast, the concentrations of all the other heavy metals in the samples were less than the maximum permissible levels recommended by WHO/FAO. Similarly, the water and soil samples were highly contaminated by Lead. The hazard quotient (HQ) of all the heavy metals was distinctively less than one, and it did not exceed 0.3 in any of the age groups. Furthermore, the carcinogenic risk for nickel was only higher than the recommended value, especially in women.
Conclusion
While it seems that consuming vegetables has no acute health risk related to heavy metals, long-term and regular ingestion of the vegetables are likely to make cancer risk. Besides, due to the high concentration of Pb in soil and vegetables, regular and integrated assessment of heavy metals in soil, water, and food is necessary.
Keywords: Hazard quotient, Heavy metals, Risk assessment, Slope factor, Vegetables
Introduction
Human exposure to heavy metals has been dramatically increasing due to the growth of cities and industries [1]. Heavy metals mainly include cadmium (Cd), lead (Pb), chromium (Cr), copper (Cu), zinc (Zn), arsenic (As), etc., and maybe originated from natural resources such as soil erosion, weathering of rocks as well as surface runoff and anthropogenic ones like industrial and municipal waste disposal, mining, application of fertilizers and pesticides and deposition of contaminated particle matters [2–5]. Although low levels of some heavy metals such as Cu and Zn are necessary for health, some other heavy metals such as Pb and Cd, even at low levels, may cause adverse effects, including cancer, cardiovascular diseases, high blood pressure, and severe intellectual disability [6].
The heavy metals’ significant concerns are related to their specific properties, including toxicity, persistence, and bioaccumulation in the environment. The agricultural soil and irrigation water for food production may contain heavy metals and directly or indirectly affect public health [7–9]. Different types of food products such as bread, rice, meat, fruits, and vegetables may contain a remarkable amount of heavy metals [10–13]. Vegetables are one of the essential groups of foods with a great potential for heavy metal accumulation. The concentration of heavy metals in vegetables depends on several factors, including the ability of metal absorption by the plant, degree of soil stabilization, and transfer factor of metals (from soil to root) [14–16]. The contamination of vegetables with heavy metals is also related to soil pollution. Moreover, the location of farms (proximity to the main roads) and the quality of water and wastewater effluents used for irrigation of the farms significantly affect the contamination of plants with heavy metals [17–19].
As heavy metal contamination in agricultural products is a serious problem, especially in developing countries, several studies attended to the measurement and monitoring heavy metals in farmlands [20, 21]. For instance, Ahmed et al. (2018) measured the levels of Cr, Cu, Zn, As, Cd, and Pb in water, vegetables, and soil samples collected from an industrial region. Consequently, high contamination of Cu and Cr was observed in root vegetables, and it has been predicted that consumption of them might be unsafe [22]. According to Osaili et al. (2016), concentrations of Cu in parsley and spinach and Pb in onion were more than the Codex limits for foodstuffs [23].
Heavy metals such as Ni, Pb, Cr, Cd are likely to enter the environment through waste and wastewater disposal, industrial activities, and wastewater, which can pose health effects to humans [24]; Besides, long term exposure to heavy metals can increase the risk of cancers, psychological, and also neurological disorders [25, 26]. Thus, the Environmental Protection Agency (EPA) issued certain methods to predict the more precise risk of heavy metals absorbed through a wide variety of food materials. By using these methods, risk assessments can be performed, and both carcinogenic and non-carcinogenic probability of the different foods’ consumption can be predicted. Despite the importance of tracing the heavy metal contamination in the food chain, there was no comprehensive study in Neyshabur, a region with a great number of vegetables and garden produce in the Northeast of Iran. In addition, a great proportion of vegetables from this region are being exported to different neighboring counties and provinces. Therefore, the main objectives of this study were (a): measuring the content of heavy metals in water, vegetables, and corresponding soil, (b): estimating the hazard quotient related to exposure to contaminated water, soil, and vegetables from different routes.
Materials and methods
This is a descriptive-analytical study carried out in Neyshabur County. Several leafy vegetables namely Mentha (mint), Ocimum basilicum (basil), Petroselinum crispum (parsley), Allium schoenoprasum (chives), and Coriandrum sativum (coriander), which are routinely used as edible vegetables throughout the year by Iranian people, were selected for this study.
Research area
Neyshabur is one of the counties in the central part of Razavi Khorasan Province, in the eastern margins of the Central Desert of Iran (36°12′48″N 58°47′45″E). Binaloud altitudes surround this area, foothills of Bandsiahkook and Kouhnamak (Rokh Plain water basin), Sabzevar Plain water basin, and Leyla joogh and Yalplanag altitudes from the north, south, west, and east directions, respectively. Vegetables are one of the main agricultural products of this county and are exported to other parts of northeastern Iran such as Sabzevar, Mashhad, Torbath Heydaryeh, Birjand, etc. [27, 28].
Collection of vegetable samples
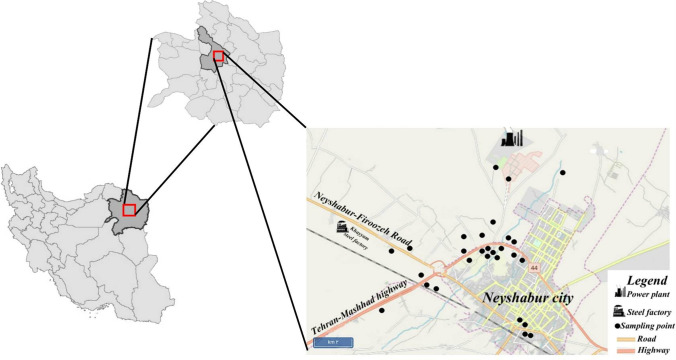
In the present study, five types of edible vegetables were selected, including mint, basil, parsley, chives, and coriander. Vegetable samples were collected from three central parts of the county from May to August 2018, the peak of vegetable growth and harvest in Iran. Additional samples were collected from the farms around the city. Sampling areas are indicated in Fig. 1. In total, 125 samples were collected for five types of vegetables. The edible parts of vegetables were separated, and samples were placed inside polyethylene bags and transported to the laboratory. Also, the researchers described the research goals to farm owners before sampling, and the samples were collected after getting permission.
Fig. 1.
Study area
Collection of soil and water samples
In addition, water samples used for irrigating vegetables were gathered from water pipes in farms. In all the farms, water was supplied by water walls and transferred by pipes. Water samples were collected in polyethylene bottles. The bottles were pre-washed with detergent and rinsed with de-ionized water; the samples were treated with 1.5 ml of nitric acid and stored at 4 °C until analysis.
Soil samples were also collected from each field. The depth of sampling was 0–20 cm, which is the usual depth of root propagation. In total, water and soil samples were collected from 28 fields. The soil samples were placed inside polyethylene bags to prevent any possible contamination. All water, soil, and vegetable samples were carefully taken during collection, transportation, and storage in the laboratory to prevent any possible contamination.
Sample preparation
The samples were transferred to the laboratory after collection. The collected soil samples were air-dried, crushed using a mortar, and sieved through a sieve with the mesh size of 2 mm to remove large debris, stones, sand, and pebbles, and then for further analysis, they were kept in plastic bags.
The vegetable samples were washed and dried at room temperature. Afterward, the samples were sieved through standard-sized sieves, and sections containing 2-mm particles were chosen for heavy metal analysis.
Measurement of heavy metals
Measurement of heavy metals in water
Atomic Absorption Spectrophotometer (AAS, Shimadzu-7000) was utilized to determine the concentrations of heavy metals in water. The AAS was calibrated with relevant Shimadzu AAS spectroscopic grade standards. The concentration of heavy metals was measured as ppm. If the concentration was higher than the calibration limits, the sample was diluted, or another calibration curve with a higher concentration range was considered [29].
Measurement of heavy metals in soil
First, some of the properties of the soil were measured. Soil pH and electrical conductivity (EC) were measured using distilled water (1:5 w/v), the mechanical composition (sand, silt, clay) was evaluated by the hydrometer method, and organic carbon (OC) contents were determined by the Walkley-Black wet oxidation method. The total heavy metal concentrations in the prepared soils were determined with the extraction of hydrogen chloride- Nitric acid- Hydrogen fluoride- Perchloric acid (HCl-HNO3-HF-HClO4). Approximately 100 mg of the sample was digested with 3 mL of 37% HCl, 1 mL of 65% HNO3, 6 mL of 65% HF, and 0.5 mL of 65% HclO4. The two-stage digestion program was as follows: Stage 1 (10 min to reach 200 °C) and stage 2 (15 min at 200 °C) (Hu et al., 2011). After cooling, the digestion solutions were evaporated to near dryness and then dissolved in 1 mL of 65% HNO3 and 20 mL of deionized water. Then, the sample was placed on a heater until the emergence of HclO4steam. After cooling down, HF in 5 mL was added to the crucible, and the contents were dried at 200–225 °C in a sand bath. When the crucible was cooled down, 2 mL of water and several drops of HclO4 were added. The crucible was again exposed to the sand bath for drying. After another cooling down, 5 mL of normal HCL and 5 mL of deionized water were added to the crucible. Then it was placed on the heater to boil. Eventually, when the residual soil was completely digested in HCL, the samples were diluted by deionized water in a 50-mL container. An atomic absorption system (Shimadzu AA-7000) was used to determine the amount of heavy metals. The standard solutions carried out the calibration process. The limits of detection (LOD) for Pb, Cu, Fe, Zn, and Ni were 0.1, 0.07, 0.05, 0.07, and 0.07 μg/L, respectively; however, the limits of quantity (LOQ) for Pb, Cu, Fe, Zn, and Ni were 0.3, 0.2, 0.015, 0.2, and 0.2 μg/L, respectively.
Measurement of heavy metals in vegetables
One g of each sample was powdered and incinerated in an electric furnace at the temperature of 550 °C to measure the concentration of heavy metals in vegetables. After solving the incinerated samples in HCL, the concentrations of the specified metals in the filtered solution were identified using an atomic absorption device. Bioaccumulation factor (BAF) is a critical factor affecting the exposure to heavy metals through the food chain and is defined as the ability of heavy metals to be transferred from soil to the edible parts of vegetables. The BAF can be calculated for Pb, Cu, Fe, Ni, and Zn using the following equation:
where Cveg and Csoil are the concentrations of the heavy metal of interest in the edible parts of the vegetable and soil, respectively [30].
Health risk assessment
The health risk is the probability of adverse health effects due to environmental pollution and is assessed using the following steps: Risk identification, dose-response assessment, exposure assessment, and risk characterization. The intake of heavy metals is via three sources of water, soil, and air. Heavy metals can be transferred from one source to another and increase the risk from that source. Exposure to heavy metals can occur through six routes, including 1) direct ingestion of soil particles, 2) dermal exposure to polluted soil, 3) the food chain, 4) inhalation, 5) drinking the polluted water, and finally 6) dermal exposure to polluted water [31]. In this study, the carcinogenic and non-carcinogenic risks for each route were estimated using the methodology recommended by US EPA [8].
Calculation of heavy metal intake
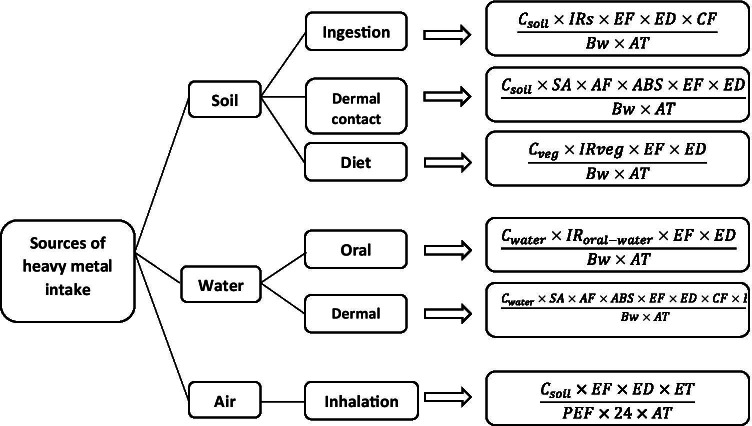
Chronic daily intake (CDI) was calculated by the daily pollutant intake via each of the exposure routes. The parameters used to calculate CDI are presented in Fig. 2 and Table 1.
Fig. 2.
Equations for the calculation of daily heavy metal intake via various exposure pathways
Table 1.
Defining the parameters of the equations for calculating the daily intake of heavy metals via various exposure pathways
| Parameter | Definition | Value of parameter | Unit | Ref | |
|---|---|---|---|---|---|
| C | Heavy metal concentration | Observed value | mg/kg or mg/L | – | |
| EF | Exposure frequency | 350 | Day/a | [32] | |
| ED | Exposure duration | Girls | 5.5 | Day | [3] |
| Boys | 5.5 | ||||
| Women | 30 | ||||
| Men | 30 | ||||
| Irs | Soil ingestion rate | 100 | mg/day | [32] | |
| Bw | Body weight | Girls | 26.25 | kg | [2] |
| Boys | 23.85 | ||||
| Women | 62.5 | ||||
| Men | 75 | ||||
| AT | Average time |
Carcinogenic 54 × 365 |
Day | [2] | |
| Non-carcinogenic 70 × 365 | [32] | ||||
| CDI | Chronic daily intake | a | mg/day | [3] | |
| SA | Exposed surface area of skin | 5700 | cm2 | [32] | |
| AF | Skin adherence factor | 0.07 | mg.cm2 | [32] | |
| ABS | Dermal absorption factor | 0.001 | – | [3] | |
| IR veg | Average consumption of edible vegetables | Girls | 32.5 | kg/day | Based on the food frequency questionnaire filled out in health centers |
| Boys | 32.5 | ||||
| Women | 45 | ||||
| Men | 45 | ||||
| IRoral-water | Daily water consumption | Girls | 1.5 | L/day | [32] |
| Boys | 1.5 | ||||
| Women | 2.5 | ||||
| Men | 2.5 | ||||
| PEF | Particle emission factor | 1.36 × 10⁹ | m3/kg | [33] | |
| EVshower | Bathing frequency | 1 | a/day | [34] | |
| CF | Unit conversion factor | 10−6 | kg.mg−1 | [33] | |
| ET | Exposure frequency | 24 | h/day | [3] | |
aDifferent equations are used for each exposure route (Fig. 2)
Carcinogenic risk
The carcinogenic risk was estimated by evaluating lifetime exposure to the carcinogen agent through each of the exposure routes:
Where CDI is Chronic daily intake (mg/day) and CSF is the cancer slope factor (mg/kg day−1) which links the mean exposure concentration to the increase in the probability of developing cancer (Table 2). The total carcinogenic risk was estimated using the following equation:
where cancer risk is a unitless parameter showing the probability of individual developing cancer, CDIk is chronic daily intake dose of a pollutant (mg/kg/day), and SFk is the carcinogenicity slope factor (mg/kg/day). Using the estimates of slope factor (SF), lifetime exposure to a carcinogenic substance can be converted to the incremental risk of individual developing cancer.
Table 2.
The toxicity responses (dose responses) to heavy metals as the oral reference doses (RfD) and oral slope factors (SF)
| Heavy metal | Oral reference dose (mg/kg/day) | Dermal reference dose (mg/kg/day) | Inhalation reference dose (mg/kg/day) | Slope factor (mg/kg-day)−1 |
|---|---|---|---|---|
| Ni | 2 × 10⁻² | 5.4 × 10⁻³ | 2.06 × 10⁻² | 0.84 |
| Pb | 3.5 × 10⁻³ | 5.25 × 10⁻⁴ | 3.52 × 10⁻³ | 0.00085 |
| Zn | 0.3 | 6 × 10⁻² | 0.3 | n.d |
| Cu | 4 × 10⁻² | 1.2 × 10⁻² | 4.02 × 10⁻² | n.d |
| Fe | 1.6 | n.d | n.d | n.d |
n.d: not determined
According to US EPA, the acceptable carcinogenic risk ranges from 10−4 to 10−6.
Non-carcinogenic risk
The non-carcinogenic risk was assessed using the hazard quotient (HQ) which qualitatively compares CDI with the reference dose of the pollutant (RfD):
The total exposure hazard index (THI) aggregates all non-carcinogenic risks from all the exposure routes [8]:
For both HQ and HI, if the value is higher than one, the non-carcinogenic health risk is unacceptable, while the values below one indicate an acceptable risk [3].
Data analysis
After performing the tests in the laboratory, the obtained data were entered into Excel software. Descriptive analysis of the vegetable, soil, and water samples was performed using Excel software (version 2016). Mean, standard deviation, minimum, maximum, and plotting of graphs were performed using Excel software. Besides, estimations of health risk assessment were carried out using Excel, as well. Arc GIS illustrated the geographic dispersion of sampling points.
Results
Descriptive analysis showed high concentrations of lead in the vegetables; all the samples had unsafe concentrations based on the limits (0.3 mg/kg) of WHO/FAO for food. In contrast, the concentration levels of other heavy metals in the vegetables were in the safe range, and none of the vegetable samples had high contents of heavy metals, including Cu, Fe, Ni, and Zn.
The concentration of heavy metals in vegetables
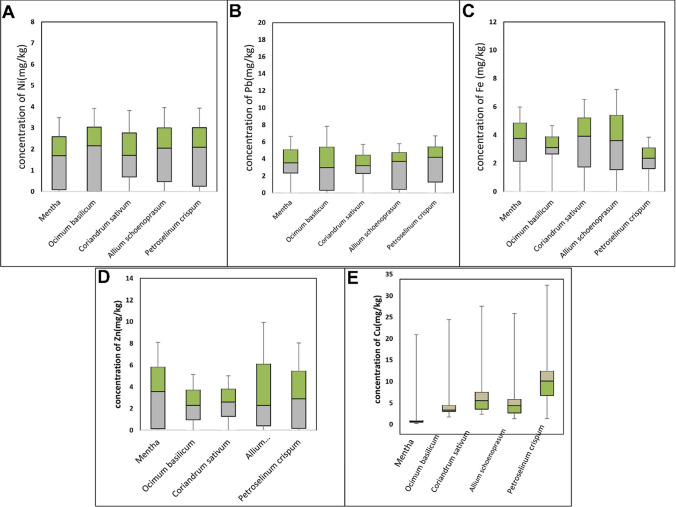
The average concentrations of heavy metals in different vegetables are illustrated in Fig. 3. The average Pb, Cu, Fe, Ni, and Zn concentrations in all the vegetables were 5.56, 5.27, 4.74, 2.94, and 3.33 mg/kg, respectively. The highest and lowest lead concentrations were observed in Mentha (17.47 mg/kg) and O. basilicum (0.30 mg/kg), respectively (Fig. 3). Ni had roughly similar average concentrations in different types of vegetables ranging from 2 to 3 mg/kg. Interestingly, Mentha was Fe-free, while the highest concentration of Fe was observed in P. crispum (Fig. 3).
Fig. 3.
The concentration of each heavy metal in different types of vegetables. A: the content of Ni, B: the content of Pb, C: the content of Fe, D: the content of Zn, E: the content of Cu
Concentrations of heavy metals in water and soil
The characteristics of soil can affect the concentration and absorption of heavy metals in the soil. The average values of some of these properties, including pH, organic component, clay silt, sand, EC, and cation exchange capacity (CEC), are 7.5, 0.7%, 0.25%, 0.45%, 0.3%, and 5, respectively. The descriptive statistics of heavy metal concentrations in water and soil are presented in Table 3. The average Pb, Cu, Fe, Ni, and Zn concentrations in soil samples were 5.47, 6.32, 14.50, 2.71, and 4.56 mg/kg, respectively. In addition, lead and zinc had the highest (18.48 mg/kg) and lowest (0.79 mg/kg) concentrations in water samples, respectively. The concentrations of Ni, Cu, and Zn exceeded the WHO standards in about 93%, 75%, and 40% of the water samples. The order of heavy metals’ concentration in water was Zn˃Cu˃Ni˃Fe˃Pb. Interestingly, almost all the water samples were free of Pb.
Table 3.
Descriptive analysis of heavy metals in the vegetable, soil, and water samples
| Vegetables* | Corresponding soil* | Corresponding water** | |||||||||||||
|---|---|---|---|---|---|---|---|---|---|---|---|---|---|---|---|
| Pb | Cu | Fe | Ni | Zn | Pb | Cu | Fe | Ni | Zn | Pb | Cu | Fe | Ni | Zn | |
| Mean | 5.5664 | 3.3585 | 4.7486 | 2.9548 | 5.2755 | 5.471 | 6.3282 | 14.500 | 2.7120 | 4.5624 | 0.0002 | 2.5116 | 0.0066 | 1.3828 | 2.6072 |
| SD | 3.2414 | 2.2216 | 2.0185 | 1.6351 | 2.9970 | 2.0796 | 2.0193 | 3.2555 | 0.8126 | 2.5571 | 0.0007 | 1.2538 | 0.0128 | 0.7567 | 1.4348 |
| 5 | 1.9272 | 0.2882 | 1.9522 | 0.3777 | 1.1693 | – | – | – | – | – | – | – | – | – | – |
| 10 | 2.4372 | 0.5259 | 2.3724 | 0.6896 | 1.8887 | 2.564 | 2.2217 | 9.522 | 1.6046 | 1.8035 | 0 | 0.5257 | 0.001 | 0.2509 | 0.8688 |
| 25 | 3.5393 | 1.4546 | 3.0569 | 2.0119 | 2.8274 | 4.1485 | 5.6120 | 12.03 | 1.7782 | 2.8296 | 0 | 1.2358 | 0.001 | 1.0045 | 1.45 |
| Median | 4.999 | 3.3548 | 4.33 | 2.8269 | 4.8693 | 5.15 | 7.208 | 14.46 | 2.8902 | 3.9138 | 0 | 2.8803 | 0.003 | 1.1667 | 2.5676 |
| 75 | 6.5617 | 4.8814 | 6.17 | 3.8013 | 7.1527 | 6.25 | 7.5368 | 17.1844 | 3.4172 | 6.3088 | 0 | 3.5382 | 0.008 | 1.9302 | 3.5817 |
| 90 | 9.6448 | 6.3296 | 8.0379 | 5.4317 | 9.9799 | 9.206 | 8.0096 | 18.876 | 3.9637 | 9.4359 | 0.0013 | 3.8078 | 0.0262 | 2.5155 | 4.9731 |
| 95 | 13.5038 | 6.8214 | 8.6262 | 6.4094 | 10.6616 | – | – | – | – | – | – | – | – | – | – |
| Geometric mean | 4.79 | 2.42 | 4.34 | 2.31 | 4.28 | 5.11 | 5.7 | 14.13 | 2.59 | 3.97 | 0 | 1.97 | 0 | 0.98 | 2.23 |
*the content of heavy metals in vegetable and soil samples are calibrated based on mg/kg **the unit of heavy metals in water samples is mg/L
Calculation of BAF
This factor was calculated by dividing the heavy metals’ concentrations into the edible parts of the vegetables by their amount in the corresponding soil (Fig. 4). The order of the BAF values calculated for the vegetable samples was as follows: Fe > Ni > Pb > Cu > Zn. The BAF values ranged from 0.233 to 1.272; the highest values of Pb, Zn, and Ni were observed in Petroselinum crispum, and the highest values of Cu and Fe were in Mentha.
Fig. 4.
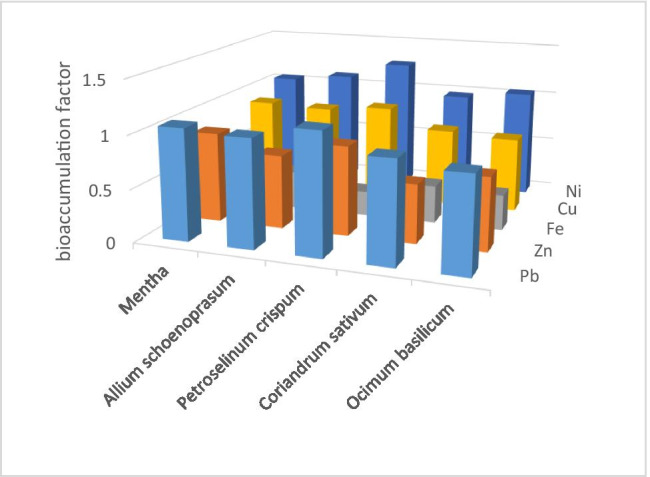
Bioaccumulation factor (BAF), the ratio of the heavy metal concentration in the edible part of leafy vegetables to that in the corresponding soil
Non-carcinogenic risks
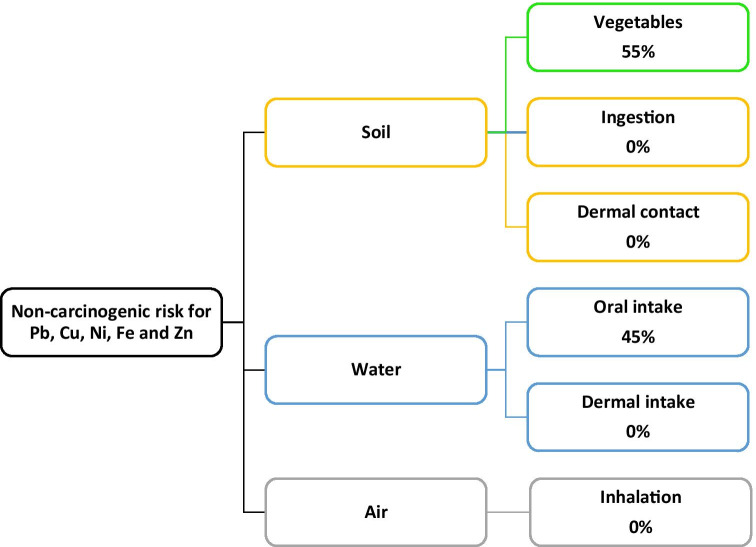
The non-carcinogenic risks from each exposure route are illustrated in Fig. 5. The present results demonstrated that diet, i.e., vegetable consumption, made the largest contribution to non-carcinogenic risks of heavy metals. The average risks for each element and exposure route are presented in Table 4. All of the values were below the permitted level (<1).
Fig. 5.
Multi-pathway analysis of HQ
Table 4.
Non-carcinogenic risk of heavy metals via various exposure pathways
| Exposure pathways | Proportion | Pb | Zn | Fe | Cu | Ni |
|---|---|---|---|---|---|---|
| Diet | Measure | 0.146665 | 0.001027 | 0.000274 | 0.012164 | 0.013605 |
| Percentage | 99.81% | 99.75% | 99.48% | 99.79% | 99.83% | |
| Ingestion of soil | Measure | 0.000243 | 2.36E-06 | 1.41E-06 | 2.46E-05 | 2.11E-05 |
| Percentage | 0.16% | 0.22% | 0.51% | 0.20% | 0.15% | |
| Inhalation of soil | Measure | 1.77E-09 | 1.73E-11 | * | 1.79E-10 | 1.5E-10 |
| Percentage | * | * | * | * | * | |
| Dermal absorption of soil | Measure | 1.87E-05 | 1.37E-07 | * | 9.51E-07 | 9.05E-07 |
| Percentage | 0.01% | 0.01% | * | * | * |
*: could not be calculated because it was too low
Between the different pathways of non-carcinogenic risk of heavy metals, diet (including water and vegetables) was the most important way (more than 99% for all the metals) and the proportion of other pathways was insignificant (Table 4).
The non-carcinogenic risks for different age and gender subgroups are also shown in Fig. 6. The HQ and total HQ values for all the gender- and age-specific groups were in the following order: Pb > Ni > Cu > Fe. The highest and lowest risks were estimated to be from lead and iron, respectively; however, all the HQs were below one. Adult females were more at risk among the population groups than other groups (adult females were the most at-risk subgroup (THQ = 0.27)).
Fig. 6.
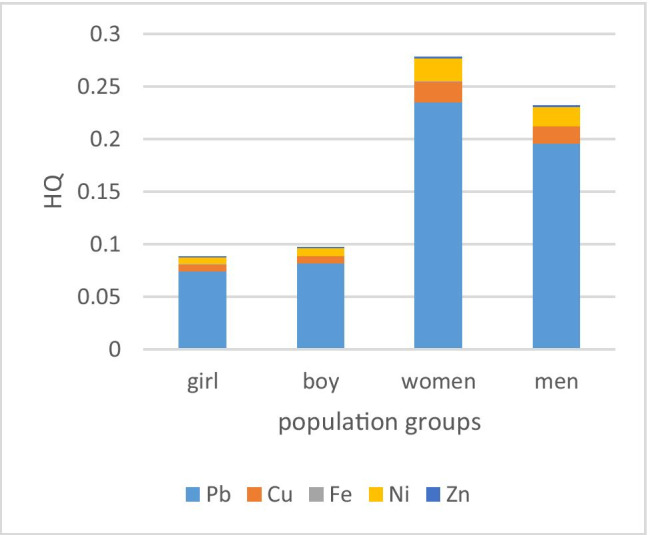
Non-carcinogenic risks of heavy metals in each population group
Carcinogenic risks
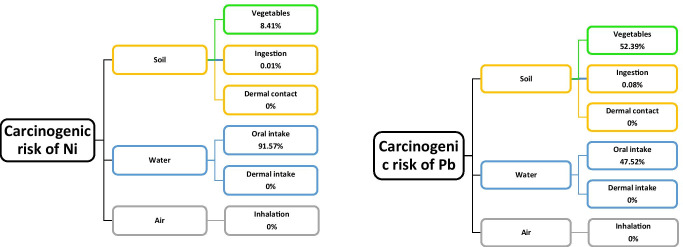
Out of the five studied metals, only lead and nickel have been proved to have carcinogenic effects. Therefore, only the cancer risk was assessed due to exposure to Pb and Ni among the six defined routes (Fig. 7). The results indicated that eating vegetables and drinking water made the biggest contribution to carcinogenic risk. The most significant contributors to the estimated cancer risks of Pb and Ni were vegetables (52.38%) and drinking water (92%), respectively.
Fig. 7.
Multi-pathway analysis of cancer risk
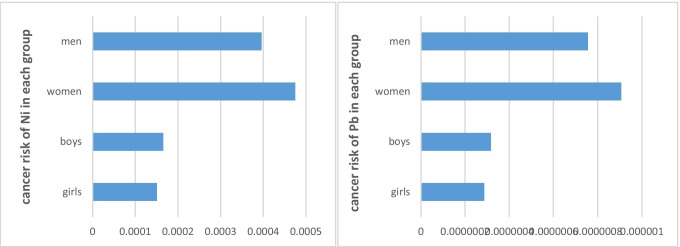
The carcinogenic risks of Pb and Ni for four age and gender groups are depicted in Fig. 8. As observed, women and girls were the most and least at-risk subgroups, respectively. However, the carcinogenic risks of Pb did not exceed the US EPA limits. The carcinogenic risks estimated for adults and younger people due to the exposure to Ni were 1.58 × 10⁻⁴ and 4.35 × 10⁻⁴, respectively, which exceeded the acceptable range recommended by EPA. The carcinogenic risks of Pb for the same groups were 3.02 × 10⁻⁷ and 4.35 × 10⁻⁴, respectively, which were negligible.
Fig. 8.
Carcinogenic risks of heavy metals in each population group
Discussion
In this study, we investigated the amount of heavy metals in soil, water, and vegetables cultivated in an agricultural area in Iran. Our findings manifested that collected soil samples of Neyshabur’ from farmlands were contaminated by heavy metals, especially Pb, Cu, and Fe. Such high content of heavy metals in soil can be related to the frequent application of pesticides, chemical fertilizers, and animal manure in vegetable farms. Similarly, previous studies by Zhang et al. and Quitong et al. revealed that animal fertilizers increase the Pb, Cu, and Zn content in the soil, raising the heavy metal concentration in cultivated vegetables [35–37]. The content of Pb, Ni, and Zn were significantly less than those measured by Mohammadi et.al (2019) in industrial areas of Neyshabur [38], while, in the present study, the concentration of heavy metals in soil samples can be partially related to deposition of dust emitted from industrial activities and a highway near the given farms (fig. 1).
The water samples were contaminated by Cu, Ni, and Zn and the content of these heavy metals in water was higher than permissible limits issued by WHO for drinking water [39], however, the samples were almost Pb and Fe free. A low concentration of Pb and Fe could be associated with the type of water resource, water walls located near the vegetable farms. Low contamination by Lead has been usually reported in groundwater [28, 40], but the concentration of Fe remarkably depends on geographic formations and weathering rocks [41]. On the other hand, as the concentration of Cu and Ni was more than WHO limits in a great majority of samples, it can make a health risk for farmers and villagers using water as a drinking water resource [42].
The overall average concentrations of Pb, Cu, Fe, Ni, and Zn in vegetable samples were 5.56 mg/kg, 5.27 mg/kg, 4.74 mg/kg, 2.94 mg/kg, and 3.33 mg/kg, respectively. Almost all the vegetable samples were contaminated with high concentrations of Pb, however, the content of other heavy metals was below permissible levels of WHO for food ingredients (Table 3). It seems that the high concentrations of lead in vegetables can be attributed to its high levels in the soil. As in the farmlands of Neyshabur, farmers frequently use both chemicals and animal manure as fertilizers, which could contaminate soil and consequently increase the concentration of heavy metals in vegetables [43, 44].
Other heavy metals were in a safe range based on the maximum allowable limits (MAL) of heavy metals in food set by FAO/WHO-CODEX. In various types of vegetables, the concentration of heavy metals was different. For instance, Mentha was the most lead-contaminated type of edible vegetable; on the other hand, Ocimum basilicum contained the lowest concentration of lead (0.3 mg/kg). About Fe, Petroselinum crispum had a moderately higher concentration; and by contrast, Mentha was approximately Fe-free. The concentration differences of Ni, Cu, and Zn were trivial in various given vegetables (Fig. 3). These results could mirror the morphological and physiological differences in the uptake, separation, accumulation, and storage of heavy metals in different types of vegetables [7, 45].
Bioaccumulation factor (BAF) can also play an important role in the heavy metals stored in different parts of various vegetables. Generally, BAF is usually affected by the chemical formation of heavy metals in soil and the physicochemical characteristics of soil such as salinity and pH. Here, it was found that the BAF of metals was in the following order: Ni > Pb > Cu > Zn > Fe. Leafy vegetables have a higher growth rate and slower root to shoot transfer, leading to a lower accumulation of heavy metals in the upper parts [46].
The non-carcinogenic risks of heavy metals were also assessed, through four routes of exposure, including direct ingestion of soil particles, dermal contact with soil, food chain, and inhalation of soil particles. Among the exposure routes, ingestion was the most common way of exposure (more than 99%) to heavy metals. It was in line with previous studies such as the studies by Liu et al., Liang et al., and Xiao et al. [33, 47, 48] in which the studied population groups mainly were exposed to the heavy metal through ingestion of water or foodstuffs. We used hazard quotient (HQ)to evaluate the acute health risk attributed to heavy metals for consumers. The estimated HQ for lead was higher than those of other metals; however, the HQs were below one under all circumstances, indicating the insignificant non-carcinogenic risks of heavy metals through vegetable consumption. Due to the higher concentrations of lead, it was excepted that the HQ exceeded the limit, as reported in other studies, but the values of HQ were distinctly lower than one, indicating that the consumption of vegetables does not cause any significant non-carcinogenic risk to health. This difference can be due to the higher vegetable consumption in other studies compared with the present investigation. This study’s amount of vegetable consumption was selected based on a questionnaire-based survey for different age groups. In this study, consumption of vegetables was lower (32.5 and 45 g) [48, 49] than that of the studies by Ghasemi Dehkordi et al. (2018) (IRveg = 684 g), Salehipour et al. (2015) (IRveg = 67.2 g), and Sharma et al. (2009) (IRveg = 76.65 g) [2, 50, 51].In assessing HQs for population subgroups, higher values of HQ were observed for women. Agreement with our findings, Selehipour et al. (2015). reported that female adults (who have lower body weights) were exposed to higher non-carcinogenic risk than male adults [2].
Comparing the cancer risk of Pb and Ni through various exposure routes revealed that the risks via consuming foods are about 52 to 55 thousand times higher than the sum of the risks via inhalation and dermal intake routes. Similarly, the results of the studies by Xiao et al. (2017) and Liang et al. (2017) indicated that the risks via ingestion of soil particles were 87 times more than those via inhalation and dermal intake [47, 48]. The carcinogenic risks due to drinking contaminated water and food ingestion mainly were attributed to nickel and lead. Compared with the limits set by US EPA [52], Ni′s cancer risk (CR) for all the groups was higher than the acceptable values, 10−6–10−4, while the estimates of CR for Pb showed that Pb posed a negligible cancer risk for consumption of vegetables. Most importantly, there was a likelihood of carcinogenic risk for adult women, as similarly reported by Aghili et al. (2009) and Salehipour et al. (2015) [2, 53]. As the cancer risk estimates for vegetable consumers are higher than the allowed range, regular monitoring and assessment of heavy metals and their possible health outcomes are required.
We acknowledge that sensitivity analysis and other simulation methods such as Monte Carlo could be beneficial to assess the health risk of exposure to heavy metals and other contaminants. It is also of great importance that the carcinogenic and non-carcinogenic risks are assessed comprehensively, and all of the exposure routes should be considered. Besides, the separation of natural and anthropogenic fractions of heavy metals could be good for health officials or policymakers, but we did not focus on source identification in the present study. However, this study attempted to evaluate four major exposure routes of heavy metals in the vast geographical area of Neyshabur, and estimate the related carcinogenic and non-carcinogenic risks. Future studies could also be conducted in other areas with different risk assessment approaches.
Conclusion
It seems that the high concentration of Pb in vegetables is alarming; however, the concentration of other heavy metals was at the permissible level. Likewise, Pb highly contaminated soil samples, which indicates the effect of frequent application of chemical fertilizers and other polluting human activities near the farmlands. Despite the high concentration of Cu, Ni, and Zn in water, the groundwater samples contained a remarkably low level of Pb and Fe. Regarding the findings of health risk assessment, Pb was the most significant part of HQ in non-carcinogenic risk; however, the non-carcinogenic risk for all the routes and heavy metals was distinctly less than one. Regarding the carcinogenic risk of the given heavy metals, Ni had the highest carcinogenic risk, which was even more than Pb. In addition, adult women were more likely to be affected by high cancer risk due to long-term consumption of vegetables contaminated by Ni. Accordingly, regular measurement and monitoring of heavy metals in different foodstuffs, soil samples, and water are essential to control short-and long term health effects in the food chain.
Acknowledgments
The authors would like to thank Neyshabur University of Medical Sciences for their financial support of this research (grant no: 202). The study was approved by the research ethics committee of Neyshabur University of Medical Sciences with the code of (IR.NUMS.REC.1397.025).
Declaration
Conflict of interest
We wish to draw the attention of Editor the the following fact that there is no conflict of interest in this work.
Footnotes
Publisher’s note
Springer Nature remains neutral with regard to jurisdictional claims in published maps and institutional affiliations.
References
- 1.Wang Y, Duan X, Wang LJSOTTE, Spatial distribution and source analysis of heavy metals in soils influenced by industrial enterprise distribution: Case study in Jiangsu Province, 710 (2020) 134953. [DOI] [PubMed]
- 2.Salehipour M, Ghorbani H, Kheirabadi H, Afyuni M. Health risks from heavy metals via consumption of cereals and vegetables in Isfahan Province. Iran, Human and ecological risk assessment: an international journal. 2015;21:1920–1935. doi: 10.1080/10807039.2014.1002292. [DOI] [Google Scholar]
- 3.USEPA, Exposure factors handbook: 2011 edition, in, USEPA Office of Research and Development Washington., 2011.
- 4.Jin Y, O'Connor D, Ok YS, Tsang DC, Liu A, Hou DJEI, Assessment of sources of heavy metals in soil and dust at children's playgrounds in Beijing using GIS and multivariate statistical analysis, 124 (2019) 320–328. [DOI] [PubMed]
- 5.Shams M, Tavakkoli Nezhad N, Dehghan A, Alidadi H, Paydar M, Mohammadi AA, Zarei A. Heavy metals exposure, carcinogenic and non-carcinogenic human health risks assessment of groundwater around mines in Joghatai, Iran. Int J Environ Anal Chem. 2020:1–16.
- 6.Li B, Wang Y, Jiang Y, Li G, Cui J, Wang Y, Zhang H, Wang S, Xu S, Wang R. The accumulation and health risk of heavy metals in vegetables around a zinc smelter in northeastern China. Environ Sci Pollut Res. 2016;23:25114–25126. doi: 10.1007/s11356-016-7342-5. [DOI] [PubMed] [Google Scholar]
- 7.Tom M, Fletcher TD, McCarthy DT. Heavy metal contamination of vegetables irrigated by urban stormwater: a matter of time? PLoS One. 2014;9:e112441. doi: 10.1371/journal.pone.0112441. [DOI] [PMC free article] [PubMed] [Google Scholar]
- 8.Assessment PR. Risk Assessment guidance for superfund: volume III-part a. 2001. [Google Scholar]
- 9.Mohammadi AA, Zarei A, Majidi S, Ghaderpoury A, Hashempour Y, Saghi MH, Alinejad A, Yousefi M, Hosseingholizadeh N, Ghaderpoori M. Carcinogenic and non-carcinogenic health risk assessment of heavy metals in drinking water of Khorramabad. Iran, MethodsX. 2019;6:1642–1651. doi: 10.1016/j.mex.2019.07.017. [DOI] [PMC free article] [PubMed] [Google Scholar]
- 10.Alturiqi AS, Albedair LA. Evaluation of some heavy metals in certain fish, meat and meat products in Saudi Arabian markets. The Egyptian Journal of Aquatic Research. 2012;38:45–49. doi: 10.1016/j.ejar.2012.08.003. [DOI] [Google Scholar]
- 11.Gall JE, Boyd RS, Rajakaruna N. Transfer of heavy metals through terrestrial food webs: a review. Environ Monit Assess. 2015;187:201. doi: 10.1007/s10661-015-4436-3. [DOI] [PubMed] [Google Scholar]
- 12.Zhou H, Yang W-T, Zhou X, Liu L, Gu J-F, Wang W-L, Zou J-L, Tian T, Peng P-Q, Liao B-H. Accumulation of heavy metals in vegetable species planted in contaminated soils and the health risk Assessment. Int J Environ Res Public Health. 2016;13:289. doi: 10.3390/ijerph13030289. [DOI] [PMC free article] [PubMed] [Google Scholar]
- 13.Jafarzadeh N, Heidari K, Meshkinian A, Kamani H, Mohammadi AA, Conti GO. Non-carcinogenic risk assessment of exposure to heavy metals in underground water resources in Saraven, Iran: spatial distribution, Monte-Carlo simulation, sensitive analysis. Environ Res. 2022;204:112002. doi: 10.1016/j.envres.2021.112002. [DOI] [PubMed] [Google Scholar]
- 14.Sharma RK, Agrawal M, Marshall F. Heavy metal contamination of soil and vegetables in suburban areas of Varanasi. India, Ecotoxicology and environmental safety. 2007;66:258–266. doi: 10.1016/j.ecoenv.2005.11.007. [DOI] [PubMed] [Google Scholar]
- 15.Islam EU, Yang X, He Z, Mahmood Q. Assessing potential dietary toxicity of heavy metals in selected vegetables and food crops. Journal of Zhejiang University Science B. 2007;8:1–13. doi: 10.1631/jzus.2007.B0001. [DOI] [PMC free article] [PubMed] [Google Scholar]
- 16.Sultana MS, Rana S, Yamazaki S, Aono T, Yoshida S. Health risk assessment for carcinogenic and non-carcinogenic heavy metal exposures from vegetables and fruits of Bangladesh. Cogent Environmental Science. 2017;3:1291107. doi: 10.1080/23311843.2017.1291107. [DOI] [Google Scholar]
- 17.Antisari LV, Orsini F, Marchetti L, Vianello G, Gianquinto G. Heavy metal accumulation in vegetables grown in urban gardens. Agron Sustain Dev. 2015;35:1139–1147. doi: 10.1007/s13593-015-0308-z. [DOI] [Google Scholar]
- 18.Saleh HN, Panahande M, Yousefi M, Asghari FB, Oliveri Conti G, Talaee E, Mohammadi AA. Carcinogenic and non-carcinogenic risk Assessment of heavy metals in groundwater Wells in Neyshabur plain. Iran, Biological Trace Element Research. 2019;190:251–261. doi: 10.1007/s12011-018-1516-6. [DOI] [PubMed] [Google Scholar]
- 19.Mohammadi AA, Yousefi M, Soltani J, Ahangar AG, Javan S. Using the combined model of gamma test and neuro-fuzzy system for modeling and estimating lead bonds in reservoir sediments. Environ Sci Pollut Res. 2018;25:30315–30324. doi: 10.1007/s11356-018-3026-7. [DOI] [PubMed] [Google Scholar]
- 20.Mohammadi AA, Zarei A, Esmaeilzadeh M, Taghavi M, Yousefi M, Yousefi Z, Sedighi F, Javan S. Assessment of heavy metal pollution and human health risks Assessment in soils around an industrial zone in Neyshabur. Iran, Biological Trace Element Research. 2020;195:343–352. doi: 10.1007/s12011-019-01816-1. [DOI] [PubMed] [Google Scholar]
- 21.Esmaeilzadeh M, Jaafari J, Mohammadi AA, Panahandeh M, Javid A, Javan S. Investigation of the extent of contamination of heavy metals in agricultural soil using statistical analyses and contamination indices. Human and Ecological Risk Assessment: An International Journal. 2019;25:1125–1136. doi: 10.1080/10807039.2018.1460798. [DOI] [Google Scholar]
- 22.Ahmed M, Matsumoto M, Kurosawa KJIJOER, Heavy metal contamination of irrigation water, soil, and vegetables in a multi-industry district of Bangladesh, 12 (2018) 531–542.
- 23.Osaili TM, Al Jamali AF, Makhadmeh IM, Taha M, Jarrar SK. Heavy metals in vegetables sold in the local market in Jordan. Food Additives & Contaminants: Part B. 2016;9:223–229. doi: 10.1080/19393210.2016.1181675. [DOI] [PubMed] [Google Scholar]
- 24.Barakat MJAJOC, New trends in removing heavy metals from industrial wastewater, 4 (2011) 361–377.
- 25.Jaishankar M, Tseten T, Anbalagan N, Mathew BB, Beeregowda KNJIT, Toxicity, mechanism and health effects of some heavy metals, 7 (2014) 60. [DOI] [PMC free article] [PubMed]
- 26.Rehman Q, Rehman K, Akash MSH, Heavy Metals and Neurological Disorders: From Exposure to Preventive Interventions, in: Environmental Contaminants and Neurological Disorders, Springer, 2021, pp. 69–87.
- 27.Ghale Askari S, Oskoei V, Abedi F, Motahhari Far P, Naimabadi A, Javan SJIJOEAC, Evaluation of heavy metal concentrations in black tea and infusions in Neyshabur city and estimating health risk to consumers, (2020) 1–10.
- 28.Saleh HN, Panahande M, Yousefi M, Asghari FB, Conti GO, Talaee E, Mohammadi AAJBTER, Carcinogenic and non-carcinogenic risk assessment of heavy metals in groundwater wells in Neyshabur Plain, Iran, 190 (2019) 251–261. [DOI] [PubMed]
- 29.Federation WE, A.P.H. Association . Standard methods for the examination of water and wastewater. Washington, DC, USA: American Public Health Association (APHA); 2005. [Google Scholar]
- 30.Zhuang P, Lu H, Li Z, Zou B, McBride MB. Multiple exposure and effects assessment of heavy metals in the population near mining area in South China. PLoS One. 2014;9:e94484. doi: 10.1371/journal.pone.0094484. [DOI] [PMC free article] [PubMed] [Google Scholar]
- 31.USEPA, Risk assessment guidance for superfund (RAGS), in, US Environmental Protection Agency, Office of Emergency and Remedial …, 1998.
- 32.USEPA . Human health evaluation manual. Update ofStandard Default Exposure Factors: Supplemental Guidance; 2014. [Google Scholar]
- 33.Liu X, Song Q, Tang Y, Li W, Xu J, Wu J, Wang F, Brookes PC. Human health risk assessment of heavy metals in soil–vegetable system: a multi-medium analysis. Sci Total Environ. 2013;463-464:530–540. doi: 10.1016/j.scitotenv.2013.06.064. [DOI] [PubMed] [Google Scholar]
- 34.Yang M, Fei Y, Ju Y, Ma Z, Li H. Health risk assessment of groundwater pollution—a case study of typical city in North China plain. J Earth Sci. 2012;23:335–348. doi: 10.1007/s12583-012-0260-7. [DOI] [Google Scholar]
- 35.Qiutong X, Mingkui Z. Source identification and exchangeability of heavy metals accumulated in vegetable soils in the coastal plain of eastern Zhejiang province. China, Ecotoxicology and environmental safety. 2017;142:410–416. doi: 10.1016/j.ecoenv.2017.03.035. [DOI] [PubMed] [Google Scholar]
- 36.Zhang M, Fang L. Tea plantation–induced activation of soil heavy metals. Commun Soil Sci Plant Anal. 2007;38:1467–1478. doi: 10.1080/00103620701378417. [DOI] [Google Scholar]
- 37.Sharma RK, Agrawal M, Marshall FM. Heavy metal (cu, Zn, cd and Pb) contamination of vegetables in urban India: a case study in Varanasi. Environ Pollut. 2008;154:254–263. doi: 10.1016/j.envpol.2007.10.010. [DOI] [PubMed] [Google Scholar]
- 38.Mohammadi AA, Zarei A, Esmaeilzadeh M, Taghavi M, Yousefi M, Yousefi Z, Sedighi F, Javan SJBTER, Assessment of heavy metal pollution and human health risks assessment in soils around an industrial zone in Neyshabur, Iran, (2019) 1–10. [DOI] [PubMed]
- 39.Ali MM, Ali ML, Islam MS, Rahman MZJEN, Monitoring, Management, Preliminary assessment of heavy metals in water and sediment of Karnaphuli River, Bangladesh, 5 (2016) 27–35.
- 40.Taghipour H, Mosaferi M, Pourakbar M, Armanfar FJHPP, Heavy metals concentrations in groundwater used for irrigation, 2 (2012) 205. [DOI] [PMC free article] [PubMed]
- 41.Jia Y, Xi B, Jiang Y, Guo H, Yang Y, Lian X, Han SJSOTTE, Distribution, formation and human-induced evolution of geogenic contaminated groundwater in China: A review, 643 (2018) 967–993. [DOI] [PubMed]
- 42.Chen L, Zhou S, Shi Y, Wang C, Li B, Li Y, S.J.S.o.t.t.e. Wu, Heavy metals in food crops, soil, and water in the Lihe River Watershed of the Taihu Region and their potential health risks when ingested, 615 (2018) 141–149. [DOI] [PubMed]
- 43.Givianrad M, Sadeghi T, Larijani K, Hosseini SE, Determination of cadmium and lead in lettuce ‚mint and leek ultivated in different sites of southern Tehran, (2011).
- 44.Ravindran B, Mupambwa HA, Silwana S, Mnkeni PNJH, Assessment of nutrient quality, heavy metals and phytotoxic properties of chicken manure on selected commercial vegetable crops, 3 (2017) e00493. [DOI] [PMC free article] [PubMed]
- 45.Singh A, Sharma RK, Agrawal M, Marshall FM. Health risk assessment of heavy metals via dietary intake of foodstuffs from the wastewater irrigated site of a dry tropical area of India. Food Chem Toxicol. 2010;48:611–619. doi: 10.1016/j.fct.2009.11.041. [DOI] [PubMed] [Google Scholar]
- 46.Muchuweti M, Birkett J, Chinyanga E, Zvauya R, Scrimshaw MD, Lester J. Heavy metal content of vegetables irrigated with mixtures of wastewater and sewage sludge in Zimbabwe: implications for human health. Agric Ecosyst Environ. 2006;112:41–48. doi: 10.1016/j.agee.2005.04.028. [DOI] [Google Scholar]
- 47.Xiao R, Wang S, Li R, Wang JJ, Zhang Z. Soil heavy metal contamination and health risks associated with artisanal gold mining in Tongguan. Shaanxi, China, Ecotoxicology and environmental safety. 2017;141:17–24. doi: 10.1016/j.ecoenv.2017.03.002. [DOI] [PubMed] [Google Scholar]
- 48.Liang Y, Yi X, Dang Z, Wang Q, Luo H, Tang J. Heavy metal contamination and health risk assessment in the vicinity of a tailing pond in Guangdong, China. Int J Environ Res Public Health. 2017;14:1557. doi: 10.3390/ijerph14121557. [DOI] [PMC free article] [PubMed] [Google Scholar]
- 49.Rahmdel S, Rezaei M, Ekhlasi J, Zarei SH, Akhlaghi M, Abdollahzadeh SM, Sefidkar R, Mazloomi SM. Heavy metals (Pb, cd, cu, Zn, Ni, co) in leafy vegetables collected from production sites: their potential health risk to the general population in shiraz, Iran. Environ Monit Assess. 2018;190:650. doi: 10.1007/s10661-018-7042-3. [DOI] [PubMed] [Google Scholar]
- 50.Sharma RK, Agrawal M, Marshall FM. Heavy metals in vegetables collected from production and market sites of a tropical urban area of India. Food Chem Toxicol. 2009;47:583–591. doi: 10.1016/j.fct.2008.12.016. [DOI] [PubMed] [Google Scholar]
- 51.Ghasemidehkordi B, Malekirad AA, Nazem H, Fazilati M, Salavati H, Shariatifar N, Rezaei M, Fakhri Y, Khaneghah AM. Concentration of lead and mercury in collected vegetables and herbs from Markazi province. Iran: a non-carcinogenic risk assessment, Food and chemical toxicology. 2018;113:204–210. doi: 10.1016/j.fct.2018.01.048. [DOI] [PubMed] [Google Scholar]
- 52.Blackburn K. Recommendations for and documentation of biological values for use in risk assessment, in, EPA/600/6–87/008. Washington, DC: US Environmental Protection Agency; 1988. [Google Scholar]
- 53.Aghili F, Khoshgoftarmanesh AH, Afyuni M, Schulin R. Health risks of heavy metals through consumption of greenhouse vegetables grown in Central Iran. Hum Ecol Risk Assess. 2009;15:999–1015. doi: 10.1080/10807030903153337. [DOI] [Google Scholar]


