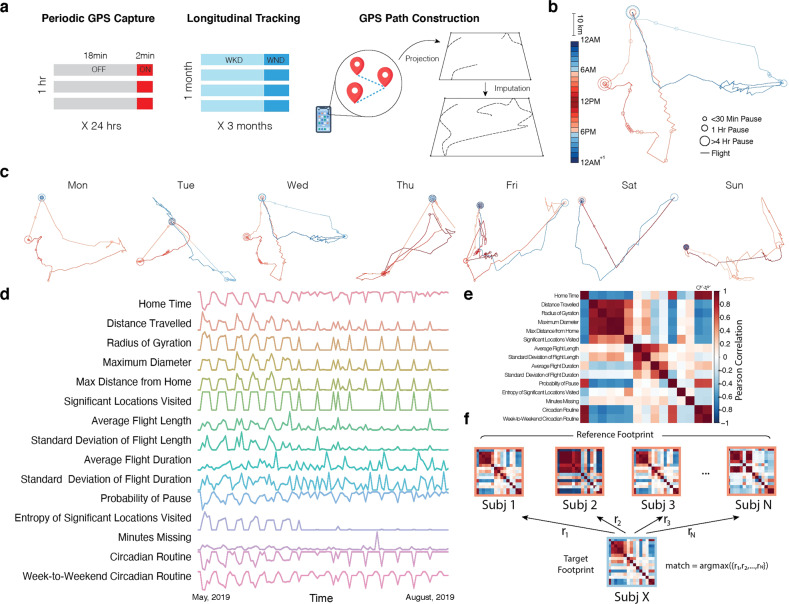
Fig. 1. Constructing personal mobility “footprints”.
a We collected 3317 days of mobility sensing data via personal smartphones from 41 adolescents and young adults. Geolocation data were recorded in cycles of 2 min on and 18 min off. Raw geolocation coordinates were de-identified via sphere-to-2D standard space projection and were further imputed for missing data. b For each individual, we constructed daily personal mobility trajectories, which consist of flights (movement) and pauses (stationary segments). Length of linear lines represents the duration of flights and size of circles represents the duration of pauses. Warm and cold colors indicate daytime and nighttime, respectively. c A representative week of trajectories is shown, which demonstrates rich characteristics of personal mobility patterns formed over time. d We extracted timeseries of mobility statistics (e.g., daily time spent at home) from geolocation and accelerometer data that parameterize movement characteristics over weeks to months. The example represented all 110 days of participants’ geolocation metrics recorded. e For each individual, we constructed a covariance matrix from the mobility metric timeseries. Each cell of the matrix was populated by the Pearson correlation between a given pair of mobility metrics. Warm and cold colors indicate positive and negative correlations, respectively. f We randomly divided data into two equally sized parts, called the reference and target set. Subj X from the target set was matched to the subject in the reference that had the highest correlations between their footprints (argmax(r1, r2, ..rN)). The identification was considered correct when underlying data came from the same subject; otherwise, the identification was considered incorrect. We quantified individual identification accuracy as the proportion of correct identifications across the entire sample; this procedure was repeated 1000 times across different random partitions of the data.

