

Abstract
Background
Mobile health (mHealth) apps have become part of the infrastructure for access to health care in hospitals, especially during the COVID-19 pandemic. However, little is known about the effects of sociodemographic characteristics on the digital divide regarding the use of hospital-based mHealth apps and their benefits to patients and caregivers.
Objective
The aim of this study was to document the cascade of potential influences from digital access to digital use and then to mHealth use, as well as the potential influence of sociodemographic variables on elements of the cascade.
Methods
A cross-sectional survey was conducted from January to February 2021 among adult clients at outpatient departments in 12 tertiary hospitals of Inner Mongolia, China. Structural equation modeling was conducted after the construct comprising digital access, digital use, and mHealth use was validated.
Results
Of 2115 participants, the β coefficients (95% CI) of potential influence of digital access on digital use, and potential influence of digital use on mHealth use, were 0.28 (95% CI 0.22-0.34) and 0.51 (95% CI 0.38-0.64), respectively. Older adults were disadvantaged with regard to mHealth access and use (β=–0.38 and β=–0.41), as were less educated subgroups (β=–0.24 and β=–0.27), and these two factors had nonsignificant direct effects on mHealth use.
Conclusions
To overcome the mHealth use divide, it is important to improve digital access and digital use among older adults and less educated groups.
Keywords: digital divide, mHealth, app, structural equation modeling, client
Introduction
The term mobile health (mHealth) was coined in 2003 [1] and is defined as health care practice through mobile devices and their apps [2,3]. mHealth apps have been developed for hospitals to allocate and manage their medical care services and to improve patient satisfaction [4,5]. During the COVID-19 pandemic, mHealth apps were used to implement prescreening, tracking cases, and social distancing measures [6-8]. COVID-19 as an extra factor is also exacerbating existing inequalities [9]. Older adults and less educated people have been affected the most by lockdown measures [9,10]. Some hospitals have implemented mHealth-based online appointments and video consultations with health care providers [11,12], instead of traditional register windows and consultation rooms, in order to reduce contacts [13,14]. Vulnerable people benefit the least from these digital solutions [9,10].
The digital divide is defined as a gap between people who have access to internet services and those who do not [15,16]. The digital divide is a central issue in the world today [17,18] and is described using a three-level framework [19] (Figure 1). Around half the number of people worldwide have access to the internet. Sociodemographic characteristics, particularly age, gender, education, and income, predict internet access and use [7,20].
Figure 1.

The three-level digital divide framework.
As of December 2020, Chinese internet penetration had reached 70.4% [21]. Patient satisfaction has become an important indicator for measuring health care quality [22,23] and policy evaluations of health care systems, which directly connect with health services use [24]. mHealth app features affect user satisfaction in various health care scenarios [25,26]. mHealth is a specific area that can be used to examine the digital divide. The Chinese government has tried to implement reforms to reduce waiting times and improve health care and patient satisfaction, including the use of mHealth [27-29]. In 2015, the Chinese government issued an action plan requiring at least 50% of appointments to be online for visiting doctors in tertiary hospitals by the end of 2017 [30]. However, the adoption rate of mobile services for outpatients was low, accounting for only 31.5% in 2019 [31]. Whether mHealth in China has reached its goal is still a subject for debate.
In China, 83% of tertiary hospitals provide online appointments, of which 60% have mHealth services [4]. The majority of mHealth apps were nested into WeChat using an official account or a mini-app [12,32]; WeChat is the most popular social media platform in China, whereas other platforms have been built by local governments, companies, or hospitals. Common mHealth services based out of hospitals are extremely similar to each other. Generally, potential users must first install the mHealth app or subscribe to the WeChat official account, sign up to be a user, then sign in to use the mHealth service. Users can make an appointment with the doctors and pay the fee for clinical tests or medicine [33]. mHealth use is recognized as a fundamental social determinant of health [34], which facilitates access to medical care services and health outcomes [35,36]. Meanwhile, hospital-based mHealth apps can be used by caregivers, who may act as proxy users on behalf of patients to reduce the digital divide [37].
Inner Mongolia is a province located in the northern part of China and borders Mongolia and Russia to the north. It is an underdeveloped province [38] containing 49 ethnic minority groups. Traditional Mongolian medicine, traditional Chinese medicine, and Western medicine are well supported by the government and accepted by local citizens [39]. Within this context, it is likely that there is digital divide between different groups of health care users. A study on digital divide among hospital clients in this area could lead to improvement of health care in the future.
To date, few studies have been conducted to analyze the digital divide regarding the use of hospital-based mHealth apps. All previous studies ran regressions to find the potential influence of sociodemographic variables on mHealth use without considering the clients’ digital access and digital use backgrounds. Our framework of evaluation of the digital divide in mHealth covers the whole spectrum, from digital access to digital use, mHealth use, and time and satisfaction when using health care services (Figure 2). Separating the potential influence of sociodemographics on each part of the cascade, with simultaneous evaluation of the flow of potential influence along the cascade, will lead to better understanding and a more appropriate formulation of policy to minimize these digital divides.
Figure 2.

Research and hypothesis model of mobile health (mHealth) digital divide.
Methods
Study Design and Setting
A cross-sectional survey was conducted in January and February 2021 in 12 tertiary hospitals across three cities of the Inner Mongolia Autonomous Region. All studied hospitals provide mHealth apps with eHealth codes, appointments with doctors, electronic payment (e-payment), and health record checking.
Participants
Clients (ie, patients and caregivers) who were visiting the outpatient department for nonemergency care, were aged 18 years or older, and able to speak Chinese were eligible for the study.
Questionnaire
The questionnaire was created by the research team and reviewed by an epidemiologist from the public health school with mHealth research expertise. The IT department of the Affiliated People’s Hospital of Inner Mongolia Medical University was consulted twice on the amended questionnaire.
Data Collection Procedure
A study team from the Inner Mongolia Medical University comprised of resident physicians was assembled and trained on the data collection process. The interviewers consecutively contacted clients at a drugstore or outpatient departure areas, explained the study, and asked for their consent to participate in the study. Consenting participants were asked to complete the questionnaire via face-to-face interviews.
Ethics Approval
This research study was approved by the Office of Human Research Ethics Committee, Faculty of Medicine, Prince of Songkla University, Thailand (REC.63-306-18-1).
Variables
Independent Variables
Independent variables included demographic information (ie, age, gender, and area of residence) and socioeconomic status (ie, educational level, employment status, and household monthly income).
Constructing the Mediators
Initially, we created a set of digital activities, including having household internet bandwidth, using a computer, using email, having a smartphone, having the ability to install apps, having wearable devices, using the internet, shopping online, using e-payment, using social media, searching online, using the internet daily, and using the internet for more than 5 years. For mHealth app use, since all apps were similar, we did not specify an mHealth app name in the questionnaire. mHealth app use was a latent intermediary variable, with its value loaded onto a series of observed variables: having mHealth apps, having an eHealth code, making appointments with doctors, attending consultations with doctors, making e-payments for medical care, and checking health records. All of these observed variables were on a “yes or no” binary scale. We then randomly split the data set in half to run exploratory factor analysis (EFA) in order to obtain the constructs; we then analyzed reliability within each factor. Subsequently, the constructs were tested on the remaining half of the data set for validation via confirmatory factor analysis (CFA).
Dependent Variables
Dependent variables included time and satisfaction with health care. We selected four indicators related to mHealth use: waiting time, check-in process, medicine withdrawal and payment process, and general satisfaction. These indicators were assessed using the Chinese Outpatient Experience Questionnaire [40], which uses a 5-point Likert scale, ranging from 1 (the worst satisfaction) to 5 (the best satisfaction).
Statistical Analysis
Data were double-entered into EpiData (version 3.1; The EpiData Association), and analysis was performed using R (version 4.1.0; The R Foundation). Descriptive statistics were used to summarize the characteristics of the clients, namely frequency with percentage for categorical variables and mean with SD for continuous variables.
CFA was used to analyze the correlation matrix among the domains. A multiple-indicator, multiple-cause model (MIMIC) with structural equation modeling (SEM) [41] was used to examine the association between sociodemographic variables, mHealth use, and time and satisfaction with health care. The “polycor” R package was used for polychoric and polyserial correlations of categorical variables [42], the “psych” R package was use for EFA [43], and the “lavaan” R package was used for CFA and SEM [44]. The sample size per hospital was calculated based on the assumption that 38.4% of Chinese adults have an mHealth app [45], using an infinite population proportion formula as follows:
 |
with a 10% error rate (d) and a 95% CI (α=.05). A 10% nonresponse rate was also assumed. With these parameters, 102 participants were required to be recruited from each hospital. Due to the effect of COVID-19 on mHealth use, we decided to recruit 200 participants from each hospital. Finally, 2366 participants were included.
Results
Sociodemographic Factors
A total of 2115 clients provided valid responses. Their mean age was 43.34 (SD 15.39) years. Other demographic characteristics are summarized in Table 1. The participants were distributed nearly equally between the two genders. Three-quarters resided in an urban area. Almost half of the participants were educated at the tertiary education level. More than half were employed by the government or a company. Their household incomes were also somewhat evenly distributed, with a median of ¥4000 to ¥6000 (a currency exchange rate of ¥1=US $0.15 is applicable), which was deemed to be middle class in China [46].
Table 1.
Basic characteristics of the participants.
| Variable | Participants (N=2115), n (%)a | |||
| Sociodemographic variables | ||||
|
|
Age (years), mean (SD) | 43.34 (15.39) | ||
|
|
Gender | |||
|
|
|
Male | 1007 (47.61) | |
|
|
|
Female | 1108 (52.39) | |
|
|
Urban residence | |||
|
|
|
Yes | 1630 (77.07) | |
|
|
|
No | 485 (22.93) | |
|
|
Educational level | |||
|
|
|
Primary or less | 297 (14.04) | |
|
|
|
Secondary | 805 (38.06) | |
|
|
|
Tertiary | 1013 (47.90) | |
|
|
Employment status | |||
|
|
|
Employed | 1166 (55.13) | |
|
|
|
Unemployed | 949 (44.87) | |
|
|
Household monthly income (¥b) | |||
|
|
|
0-2000 | 220 (10.40) | |
|
|
|
2001-4000 | 424 (20.05) | |
|
|
|
4001-6000 | 456 (21.56) | |
|
|
|
6001-8000 | 345 (16.31) | |
|
|
|
8001-9999 | 314 (14.85) | |
|
|
|
≥10,000 | 356 (16.83) | |
| Digital activities | ||||
|
|
Have household bandwidth | |||
|
|
|
No | 365 (17.26) | |
|
|
|
Yes | 1750 (82.74) | |
|
|
Use a computer | |||
|
|
|
No | 669 (31.63) | |
|
|
|
Yes | 1446 (68.37) | |
|
|
Use email | |||
|
|
|
No | 925 (43.74) | |
|
|
|
Yes | 1190 (56.26) | |
|
|
Have a smartphone | |||
|
|
|
No | 129 (6.10) | |
|
|
|
Yes | 1986 (93.90) | |
|
|
Have the ability to install apps | |||
|
|
|
No | 584 (27.61) | |
|
|
|
Yes | 1531 (72.39) | |
|
|
Have wearable devices | |||
|
|
|
No | 1564 (73.95) | |
|
|
|
Yes | 551 (26.05) | |
|
|
Use the internet | |||
|
|
|
No | 244 (11.54) | |
|
|
|
Yes | 1871 (88.46) | |
|
|
Shop online | |||
|
|
|
No | 555 (26.24) | |
|
|
|
Yes | 1560 (73.76) | |
|
|
Use e-paymentc | |||
|
|
|
No | 429 (20.28) | |
|
|
|
Yes | 1686 (79.72) | |
|
|
Use social media | |||
|
|
|
No | 548 (25.91) | |
|
|
|
Yes | 1567 (74.09) | |
|
|
Search online | |||
|
|
|
No | 543 (25.67) | |
|
|
|
Yes | 1572 (74.33) | |
|
|
Daily internet use | |||
|
|
|
No | 473 (22.36) | |
|
|
|
Yes | 1642 (77.64) | |
|
|
More than 5 years of internet use | |||
|
|
|
No | 687 (32.48) | |
|
|
|
Yes | 1428 (67.52) | |
| mHealthd use | ||||
|
|
Have mHealth apps | |||
|
|
|
No | 792 (37.45) | |
|
|
|
Yes | 1323 (62.55) | |
|
|
Have eHealth code | |||
|
|
|
No | 682 (32.25) | |
|
|
|
Yes | 1433 (67.75) | |
|
|
Make appointments with doctors | |||
|
|
|
No | 978 (46.24) | |
|
|
|
Yes | 1137 (53.76) | |
|
|
Attend consultations with doctors | |||
|
|
|
No | 1876 (88.70) | |
|
|
|
Yes | 239 (11.30) | |
|
|
Use e-payment for medical care | |||
|
|
|
No | 1102 (52.10) | |
|
|
|
Yes | 1013 (47.90) | |
|
|
Health record checking | |||
|
|
|
No | 1409 (66.62) | |
|
|
|
Yes | 706 (33.38) | |
aAll values are reported as n (%), except for the age variable.
bA currency exchange rate of ¥1=US $0.15 is applicable.
ce-payment: electronic payment.
dmHealth: mobile health.
Digital Activities
Overall, 88.46% of the participants used the internet, 82.74% had access to the internet at home, and 93.90% had a smartphone. In total, 68.37% of participants used a computer, and 56.26% could use email. Three-quarters of the participants could self-install an app, and one-quarter wore smart wearable devices. Around three-quarters of the participants purchased commodities online, used e-payment, used social media, and performed information-searching online. Most used the internet daily and had been using it for more than 5 years.
mHealth App Use
Overall, 62.55% of the participants had an mHealth app, 67.75% had an eHealth code, 53.76% could make an appointment to see a doctor, 47.90% used e-payment for health care, 33.38% reviewed their health record on an mHealth app, and 11.30% consulted with a doctor online (Table 1).
EFA Model of mHealth Digital Divide
From the EFA, validation of the classification of digital activities was performed with a Kaiser-Meyer-Olkin test [47], with a sample adequacy of 0.929 [48], and a Bartlett test of sphericity, which was statistically significant (χ2253=1260.1, P<.001) [49]. Based on the parallel analysis, four factors were determined [50]. Due to the nonnormally distributed data, principal axis factoring was used as an appropriate extraction method [51], and oblimin rotation was used as an appropriate oblique rotation method [52]. Five items (ie, “have household bandwidth,” “have wearable devices,” “use social media,” “use e-payment,” and “attend consultations with doctors”) had factor loadings of less than 0.4 [53] or high cross-loadings [54] and were, thus, dropped from the analysis.
Finally, we came up with four domains (ie, factors): digital access, digital use, mHealth use, and time and satisfaction with health care. Details of the EFA are shown in Table 2.
Table 2.
Measurement items and their reliability by exploratory factor analysis.
| Factor and items | Loading | Communality | Cronbach αa | Proportion of total variancea | |
| Digital access | |||||
|
|
Have a smartphone | 0.717 | 0.557 | .80 | 0.121 |
|
|
Use the internet | 0.886 | 0.825 |
|
|
|
|
Daily internet use | 0.542 | 0.478 |
|
|
| Digital use | |||||
|
|
Have the ability to install apps | 0.740 | 0.716 | .92 | 0.212 |
|
|
More than 5 years of internet use | 0.613 | 0.517 |
|
|
|
|
Shop online | 0.604 | 0.676 |
|
|
|
|
Search online | 0.696 | 0.689 |
|
|
|
|
Use a computer | 0.878 | 0.721 |
|
|
|
|
Use email | 0.881 | 0.703 |
|
|
| mHealthb use | |||||
|
|
Have mHealth apps | 0.610 | 0.533 | .86 | 0.154 |
|
|
Have eHealth code | 0.469 | 0.373 |
|
|
|
|
Make appointments with doctors | 0.863 | 0.646 |
|
|
|
|
Use e-paymentc for medical care | 0.846 | 0.771 |
|
|
|
|
Health record checking | 0.710 | 0.563 |
|
|
| Time and satisfaction with health care | |||||
|
|
Waiting time | 0.779 | 0.586 | .84 | 0.133 |
|
|
Check-in process | 0.836 | 0.728 |
|
|
|
|
Medicine withdrawal and payment process | 0.803 | 0.658 |
|
|
|
|
General satisfaction | 0.649 | 0.423 |
|
|
aValues for groups are reported in the row of the top variable of the group.
bmHealth: mobile health.
ce-payment: electronic payment
The factor loadings were high, ranging from 0.469 to 0.886. Cronbach α values were all above .8. These four factors explained 62% of the variance. All of these values suggested that our construct was adequate.
CFA and SEM Model of mHealth Digital Divide
The second part of the data set was used to assess reliability and validity by CFA. The measurement model of digital divide in mHealth app use was adequately measured by associated indicators based on high factor loadings. The correlations among latent variables by CFA are shown in Table 3. The model fitted the data well, according to the following indices: χ2129=528.3, χ2/df=4.095, comparative fit index (CFI)=0.940, Tucker-Lewis index (TLI)=0.929, root mean square error of approximation (RMSEA)=0.054 (90% CI 0.049-0.059), and standardized root mean square residual (SRMR)=0.042. The Cronbach α reliability coefficient was greater than .7, and convergent validity based on average variance extracted was greater than 0.5.
Table 3.
Correlation analysis (Pearson r and 2-tailed P value) among latent variables by confirmatory factor analysis.
| Latent variable | Digital access | Digital use | mHealtha use | Time and satisfaction with health care | |||||||
| Digital access | |||||||||||
|
|
r | 1.000 | 0.718b | 0.417b | 0.159b | ||||||
|
|
P value | —c | <.001 | <.001 | .001 | ||||||
| Digital use | |||||||||||
|
|
r | 0.718b | 1.000 | 0.607b | 0.226b | ||||||
|
|
P value | <.001 | — | <.001 | <.001 | ||||||
| mHealth use | |||||||||||
|
|
r | 0.417b | 0.607b | 1.000 | 0.231b | ||||||
|
|
P value | <.001 | <.001 | — | <.001 | ||||||
| Time and satisfaction with health care | |||||||||||
|
|
r | 0.159b | 0.226b | 0.231b | 1.000 | ||||||
|
|
P value | .001 | <.001 | <.001 | — | ||||||
| Cronbach α | .745 | .912 | .857 | .835 | |||||||
| Average variance extracted | 0.582 | 0.639 | 0.559 | 0.587 | |||||||
amHealth: mobile health.
bThe correlation is significant at a significance value of .05 (2-tailed).
cNot applicable.
A MIMIC model with SEM was investigated for the model of mHealth digital divide by using the weighted least square mean and variance adjusted estimator [55], since most of the variables were categorical. The overall indices of the final SEM model fitted the data well: χ2216=682.6, χ2/df=3.160, RMSEA=0.045 (90% CI 0.041-0.049), SRMR=0.036, CFI=0.949, and TLI=0.938 [53].
Figure 3 shows the regressions of all the paths. The details of the β coefficients and 95% CIs are shown in Table 4. Age was taken as a continuous variable. Although education and household income were initially ordinal categorical variables, we standardized them as continuous variables to suit the SEM. Their coefficients were interpreted as whether these had a dose-response relationship with the outcome. Age and education were strongly associated with digital access and digital use. Income had a low effect on digital access, and income, employment status, and urban residence were weakly correlated with digital use. No significant gender gap regarding these variables was seen. The cascaded coefficients (95% CI) from digital access to digital use, then to mHealth use, and then to time and satisfaction with health care were 0.28 (95% CI 0.22-0.35), 0.51 (95% CI 0.38-0.64), and 0.14 (95% CI 0.05-0.22), respectively. mHealth use, however, had a weakly significant effect on time and satisfaction with health care. mHealth use was not significantly associated with sociodemographic variables, except for employment status, with which it had a weak correlation.
Figure 3.
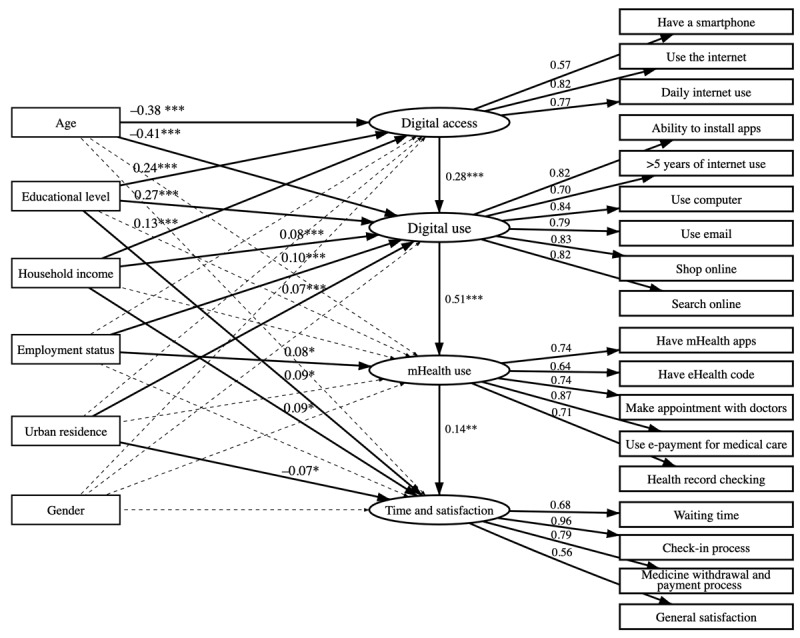
Structural equation modeling for digital divide in mobile health (mHealth). Solid lines represent significant relationships, and dotted lines represent nonsignificant ones; numbers on the lines from sociodemographic variables to latent variables are standardized coefficients, and numbers on the lines from latent variables to items are loadings. ***P<.001, **P<.01, and *P<.05.
Table 4.
Regression weights of parameters by the multiple-indicator, multiple-cause model with structural equation modeling.
| Link | β coefficient (95% CI) | P value |
| Age → digital access | –0.38 (–0.45 to –0.31) | <.001 |
| Age → digital use | –0.41 (–0.46 to –0.36) | <.001 |
| Age → mHealtha use | –0.04 (–0.15 to 0.06) | .40 |
| Age → time and satisfaction with health care | –0.08 (–0.16 to 0.01) | .07 |
| Educational level → digital access | 0.24 (0.15 to 0.32) | <.001 |
| Educational level → digital use | 0.27 (0.22 to 0.33) | <.001 |
| Educational level → mHealth use | 0.04 (–0.05 to 0.12) | .41 |
| Educational level → time and satisfaction with health care | 0.09 (0.00 to 0.17) | .04 |
| Household income → digital access | 0.13 (0.06 to 0.19) | <.001 |
| Household income → digital use | 0.08 (0.04 to 0.12) | <.001 |
| Household income → mHealth use | 0.02 (–0.05 to 0.08) | .62 |
| Household income → time and satisfaction with health care | 0.09 (0.02 to 0.17) | .01 |
| Employment status → digital access | 0.03 (–0.02 to 0.09) | .20 |
| Employment status → digital use | 0.10 (0.07 to 0.14) | <.001 |
| Employment status → mHealth use | 0.08 (0.02 to 0.15) | .01 |
| Employment status → time and satisfaction with health care | 0.003 (–0.07 to 0.07) | .94 |
| Urban residence → digital access | –0.02 (–0.09 to 0.05) | .53 |
| Urban residence → digital use | 0.07 (0.03 to 0.11) | <.001 |
| Urban residence → mHealth use | –0.04 (–0.09 to 0.02) | .20 |
| Urban residence → time and satisfaction with health care | –0.07 (–0.14 to –0.01) | .03 |
| Gender→ digital access | 0.06 (0.00 to 0.11) | .06 |
| Gender → digital use | –0.01 (–0.05 to 0.02) | .41 |
| Gender → mHealth use | –0.05 (–0.11 to 0.00) | .07 |
| Gender → time and satisfaction with health care | 0.006 (–0.06 to 0.07) | .85 |
| Digital access → digital use | 0.28 (0.22 to 0.35) | <.001 |
| Digital use → mHealth use | 0.51 (0.38 to 0.64) | <.001 |
| mHealth use → time and satisfaction with health care | 0.14 (0.05 to 0.22) | .002 |
amHealth: mobile health.
The potential influence of sociodemographic characteristics reflected the level of digital divide. The number of variables and the magnitude of the coefficients were higher for digital use than for digital access and mHealth use. Thus, use divide in our setting was the most important gap.
Discussion
Principal Findings
We confirmed the framework of digital divide in mHealth app use. Our subjects were mostly educated and middle class, with good experience in internet use and other digital media. Between one-half to two-thirds were using basic mHealth features. Sociodemographic factors had stronger potential influences on digital use than on digital access; they also had the least direct effect on mHealth use and time and satisfaction with health care. However, mHealth use was potentially influenced by digital use. Time and satisfaction with health care, on the other hand, was only weakly associated with mHealth use.
The data from this study identified a cascade of potential successive influences, where digital access influenced digital use, which then influenced mHealth use. mHealth use was determined by digital access and use. Similar to our study, a study by Tirado-Morueta et al [20] found that there was an indirect potential influence pathway from physical access to operative use and expressive informative use of the internet; ignoring this intermediary and simple running regression that predicted mHealth use from sociodemographics would lead to a misinterpretation of the results.
Among the sociodemographic variables examined, age and educational level were the stronger potential influencing variables. Both had direct independent influence on digital access and use, but had no direct effect on mHealth use; in addition, educational level had little effect on time and satisfaction with health care. Thus, their effects occurred in the early part of the digital chain. Based on this potential pathway, assistance for older adults and less educated public clients would need to start with improvements in access and use of the internet in general, as well as mobile facilities, such as email, social media, and online business. Experience with these will make mHealth use easier for them.
Sociodemographic variables had a stronger potential influence on digital use than on digital access. This may reflect that the use divide was due to lifestyle differences more than it was due to inequity problems [56]. The cost of digital access in China was relatively small (around US $15/60 Mbps or more per month [57]) and, hence, did not contribute much to digital access inequalities. On the other hand, certain sociodemographic groups, such as youth and upper-class people, choosing or needing to use digital technology is due to their lifestyle [58]. The small but significant correlation (β=0.28) between digital access and digital use may, in fact, reflect a noncausal relationship.
With the use of SEM, our findings on the effects of sociodemographic variables were different from those of other studies using one-step regression [59,60]. These other studies showed that sociodemographic variables potentially influenced mHealth use, but they missed the fact that the effect passed through digital use. Their findings would indicate the emphasis to improve mHealth use among the underprivileged. Our findings, on the other hand, imply that improved general digital use would be a more natural way to empower these groups of clients. This will make it easier and probably more effective to introduce mHealth to them. To reduce the existing digital divide among hospital clients, the hospital administration should provide special services or appropriate education to assist clients in making better use of mHealth apps.
According to another study in China, mHealth was effective in reducing patient waiting times and increasing patient satisfaction in tertiary hospitals [26]. Another study found that waiting times for consultations and prescription filling reduced, resulting in increased outpatient satisfaction with pharmacy services [27]. Moreover, our study validated the marginally significant effect of mHealth use on shorter waiting times and improved satisfaction. This indicates that mHealth app use cannot adequately explain shorter waiting times and increased satisfaction. This indicates a need for further study. Additionally, since mHealth app use in hospitals is in its infancy, mHealth apps must be improved in terms of design and marketing based on existing digital use to increase their use and provide benefits to clients [33].
Limitations
This was a cross-sectional study. One may argue that the causation proposed in the SEM was limited by temporal sequence and may not be valid. We argue that sociodemographic variables are long-term values and do not vary much over time, whereas digital divide in these domains only comes after. Mobile apps were developed nearly a decade after the wide use of the internet began, and hospital-based mHealth is the most recent development. Therefore, our proposed pathway may not be flawed in terms of temporal sequence. The current stage of mHealth development in our setting is changing continuously. Thus, further studies may produce different results.
Conclusions
In order to close the mHealth use divide, it is important to improve digital access and digital use among older adults and less educated groups.
Acknowledgments
Funding was received from the Higher Education Research Promotion and Thailand’s Education Hub for the Southern Region of ASEAN (Association of Southeast Asian Nations) Countries Project Office of the Higher Education Commission and Inner Mongolia Medical University, China. We would like to express our thanks to the Information technology (IT) staff and all participants from the study hospitals. This study is part of the first author’s thesis to fulfil the requirement for the degree of Doctor of Philosophy in epidemiology.
Abbreviations
- ASEAN
Association of Southeast Asian Nations
- CFA
confirmatory factor analysis
- CFI
comparative fit index
- EFA
exploratory factor analysis
- e-payment
electronic payment
- mHealth
mobile health
- MIMIC
multiple-indicator, multiple-cause model
- RMSEA
root mean square error of approximation
- SEM
structural equation modeling
- SRMR
standardized root mean square residual
- TLI
Tucker-Lewis index
Footnotes
Conflicts of Interest: None declared.
References
- 1.Istepanian R, Lacal J. Emerging mobile communication technologies for health: Some imperative notes on m-health. Proceedings of the 25th Annual International Conference of the IEEE Engineering in Medicine and Biology Society; The 25th Annual International Conference of the IEEE Engineering in Medicine and Biology Society; September 17-21, 2003; Cancun, Mexico. 2003. pp. 1414–1416. [DOI] [Google Scholar]
- 2.mHealth: New horizons for Health Through Mobile Technologies. Geneva, Switzerland: World Health Organization; 2011. [2019-10-01]. https://apps.who.int/iris/bitstream/handle/10665/44607/9789241564250_eng.pdf . [Google Scholar]
- 3.Becker S, Miron-Shatz T, Schumacher N, Krocza J, Diamantidis C, Albrecht U. mHealth 2.0: Experiences, possibilities, and perspectives. JMIR Mhealth Uhealth. 2014 May 16;2(2):e24. doi: 10.2196/mhealth.3328. https://mhealth.jmir.org/2014/2/e24/ v2i2e24 [DOI] [PMC free article] [PubMed] [Google Scholar]
- 4.2019-2020 Investigation Report on the State of Informatization of Chinese Hospitals. Beijing, China: China Hospital Information Management Association; 2021. [2021-06-01]. https://www.chima.org.cn/Html/News/Articles/8688.html . [Google Scholar]
- 5.Liu H, Lee W, Sun Y, Fen J, Chen T, Chou L, Hwang S. Hospital-owned apps in Taiwan: Nationwide survey. JMIR Mhealth Uhealth. 2018 Jan 16;6(1):e22. doi: 10.2196/mhealth.8636. https://mhealth.jmir.org/2018/1/e22/ v6i1e22 [DOI] [PMC free article] [PubMed] [Google Scholar]
- 6.Ming LC, Untong N, Aliudin NA, Osili N, Kifli N, Tan CS, Goh KW, Ng PW, Al-Worafi YM, Lee KS, Goh HP. Mobile health apps on COVID-19 launched in the early days of the pandemic: Content analysis and review. JMIR Mhealth Uhealth. 2020 Sep 16;8(9):e19796. doi: 10.2196/19796. https://mhealth.jmir.org/2020/9/e19796/ v8i9e19796 [DOI] [PMC free article] [PubMed] [Google Scholar]
- 7.Grill E, Eitze S, De Bock F, Dragano N, Huebl L, Schmich P, Wieler LH, Betsch C. Sociodemographic characteristics determine download and use of a corona contact tracing app in Germany-Results of the COSMO surveys. PLoS One. 2021;16(9):e0256660. doi: 10.1371/journal.pone.0256660. https://dx.plos.org/10.1371/journal.pone.0256660 .PONE-D-21-09958 [DOI] [PMC free article] [PubMed] [Google Scholar]
- 8.Salathé M, Althaus CL, Neher R, Stringhini S, Hodcroft E, Fellay J, Zwahlen M, Senti G, Battegay M, Wilder-Smith A, Eckerle I, Egger M, Low N. COVID-19 epidemic in Switzerland: On the importance of testing, contact tracing and isolation. Swiss Med Wkly. 2020 Mar 09;150:w20225. doi: 10.4414/smw.2020.20225. https://doi.emh.ch/10.4414/smw.2020.20225 .Swiss Med Wkly. 2020;150:w20225 [DOI] [PubMed] [Google Scholar]
- 9.van Deursen AJ. Digital inequality during a pandemic: Quantitative study of differences in COVID-19-related internet uses and outcomes among the general population. J Med Internet Res. 2020 Aug 20;22(8):e20073. doi: 10.2196/20073. https://www.jmir.org/2020/8/e20073/ v22i8e20073 [DOI] [PMC free article] [PubMed] [Google Scholar]
- 10.Giansanti D, Veltro G. The digital divide in the era of COVID-19: An investigation into an important obstacle to the access to the by the citizen. Healthcare (Basel) 2021 Mar 26;9(4):371. doi: 10.3390/healthcare9040371. https://www.mdpi.com/resolver?pii=healthcare9040371 .healthcare9040371 [DOI] [PMC free article] [PubMed] [Google Scholar]
- 11.Hannemann N, Götz NA, Schmidt L, Hübner U, Babitsch B. Patient connectivity with healthcare professionals and health insurer using digital health technologies during the COVID-19 pandemic: A German cross-sectional study. BMC Med Inform Decis Mak. 2021 Aug 25;21(1):250. doi: 10.1186/s12911-021-01605-8. https://bmcmedinformdecismak.biomedcentral.com/articles/10.1186/s12911-021-01605-8 .10.1186/s12911-021-01605-8 [DOI] [PMC free article] [PubMed] [Google Scholar]
- 12.Yan A, Zou Y, Mirchandani DA. How hospitals in mainland China responded to the outbreak of COVID-19 using information technology-enabled services: An analysis of hospital news webpages. J Am Med Inform Assoc. 2020 Jul 01;27(7):991–999. doi: 10.1093/jamia/ocaa064. http://europepmc.org/abstract/MED/32311036 .5822867 [DOI] [PMC free article] [PubMed] [Google Scholar]
- 13.Gong K, Xu Z, Cai Z, Chen Y, Wang Z. Internet hospitals help prevent and control the epidemic of COVID-19 in China: Multicenter user profiling study. J Med Internet Res. 2020 Apr 14;22(4):e18908. doi: 10.2196/18908. https://www.jmir.org/2020/4/e18908/ v22i4e18908 [DOI] [PMC free article] [PubMed] [Google Scholar]
- 14.Wang Y, Liu Y, Shi Y, Yu Y, Yang J. User perceptions of virtual hospital apps in China: Systematic search. JMIR Mhealth Uhealth. 2020 Aug 12;8(8):e19487. doi: 10.2196/19487. https://mhealth.jmir.org/2020/8/e19487/ v8i8e19487 [DOI] [PMC free article] [PubMed] [Google Scholar]
- 15.Falling through the net: Defining the digital divide. National Telecommunications and Information Administration, US Department of Commerce. 1999. [2019-12-04]. https://www.ntia.doc.gov/legacy/ntiahome/fttn99/contents.html .
- 16.Compaine BM, editor. The Digital Divide: Facing a Crisis or Creating a Myth? Cambridge, MA: The MIT Press; 2001. pp. 1–357. [Google Scholar]
- 17.van Dijk JAGM. Digital divide research, achievements and shortcomings. Poetics. 2006 Aug;34(4-5):221–235. doi: 10.1016/j.poetic.2006.05.004. [DOI] [Google Scholar]
- 18.Srinuan C, Bohlin E. Understanding the digital divide: A literature survey and ways forward. Proceedings of the 22nd European Regional Conference of the International Telecommunications Society; The 22nd European Regional Conference of the International Telecommunications Society; September 18-21, 2011; Budapest, Hungary. 2011. pp. 1–38. https://www.econstor.eu/bitstream/10419/52191/1/672623358.pdf . [Google Scholar]
- 19.Wei K, Teo H, Chan HC, Tan BCY. Conceptualizing and testing a social cognitive model of the digital divide. Inf Syst Res. 2011 Mar;22(1):170–187. doi: 10.1287/isre.1090.0273. [DOI] [Google Scholar]
- 20.Tirado-Morueta R, Aguaded-Gómez J, Hernando-Gómez Á. The socio-demographic divide in internet usage moderated by digital literacy support. Technol Soc. 2018 Nov;55:47–55. doi: 10.1016/j.techsoc.2018.06.001. [DOI] [Google Scholar]
- 21.The 47th Statistical Report on China’s Internet Development. Beijing, China: China Internet Network Information Center; 2021. Feb, [2021-10-06]. https://www.cnnic.com.cn/IDR/ReportDownloads/202104/P020210420557302172744.pdf . [Google Scholar]
- 22.Zhao D, Zhao H, Cleary PD. Understanding the determinants of public trust in the health care system in China: An analysis of a cross-sectional survey. J Health Serv Res Policy. 2019 Jan 03;24(1):37–43. doi: 10.1177/1355819618799113. [DOI] [PubMed] [Google Scholar]
- 23.Prakash B. Patient satisfaction. J Cutan Aesthet Surg. 2010 Sep;3(3):151–155. doi: 10.4103/0974-2077.74491. http://www.jcasonline.com/article.asp?issn=0974-2077;year=2010;volume=3;issue=3;spage=151;epage=155;aulast=Prakash . [DOI] [PMC free article] [PubMed] [Google Scholar]
- 24.Hussain A, Asif M, Jameel A, Hwang J. Measuring OPD patient satisfaction with different service delivery aspects at public hospitals in Pakistan. Int J Environ Res Public Health. 2019 Jul 02;16(13):2340. doi: 10.3390/ijerph16132340. https://www.mdpi.com/resolver?pii=ijerph16132340 .ijerph16132340 [DOI] [PMC free article] [PubMed] [Google Scholar]
- 25.Gimpel H, Manner-Romberg T, Schmied F, Winkler TJ. Understanding the evaluation of mHealth app features based on a cross-country Kano analysis. Electron Mark. 2021 Mar 24;31(4):765–794. doi: 10.1007/s12525-020-00455-y. [DOI] [PMC free article] [PubMed] [Google Scholar]
- 26.Xie W, Yang X, Cao X, Liu P. Effects of a comprehensive reservation service for non-emergency registration on appointment registration rate, patient waiting time, patient satisfaction and outpatient volume in a tertiary hospital in China. BMC Health Serv Res. 2019 Nov 01;19(1):782. doi: 10.1186/s12913-019-4652-6. https://bmchealthservres.biomedcentral.com/articles/10.1186/s12913-019-4652-6 .10.1186/s12913-019-4652-6 [DOI] [PMC free article] [PubMed] [Google Scholar]
- 27.Sun J, Lin Q, Zhao P, Zhang Q, Xu K, Chen H, Hu CJ, Stuntz M, Li H, Liu Y. Reducing waiting time and raising outpatient satisfaction in a Chinese public tertiary general hospital-An interrupted time series study. BMC Public Health. 2017 Aug 22;17(1):668. doi: 10.1186/s12889-017-4667-z. https://bmcpublichealth.biomedcentral.com/articles/10.1186/s12889-017-4667-z .10.1186/s12889-017-4667-z [DOI] [PMC free article] [PubMed] [Google Scholar]
- 28.Sun J, Hu G, Ma J, Chen Y, Wu L, Liu Q, Hu J, Livoti C, Jiang Y, Liu Y. Consumer satisfaction with tertiary healthcare in China: Findings from the 2015 China National Patient Survey. Int J Qual Health Care. 2017 Apr 01;29(2):213–221. doi: 10.1093/intqhc/mzw160.mzw160 [DOI] [PubMed] [Google Scholar]
- 29.Lu C, Hu Y, Xie J, Fu Q, Leigh I, Governor S, Wang G. The use of mobile health applications to improve patient experience: Cross-sectional study in Chinese public hospitals. JMIR Mhealth Uhealth. 2018 May 23;6(5):e126. doi: 10.2196/mhealth.9145. https://mhealth.jmir.org/2018/5/e126/ v6i5e126 [DOI] [PMC free article] [PubMed] [Google Scholar]
- 30.Xie W, Cao X, Dong H, Liu Y. The use of smartphone-based triage to reduce the rate of outpatient error registration: Cross-sectional study. JMIR Mhealth Uhealth. 2019 Nov 11;7(11):e15313. doi: 10.2196/15313. https://mhealth.jmir.org/2019/11/e15313/ v7i11e15313 [DOI] [PMC free article] [PubMed] [Google Scholar]
- 31.Ye Q, Deng Z, Chen Y, Liao J, Li G, Lu Y. How resource scarcity and accessibility affect patients' usage of mobile health in China: Resource competition perspective. JMIR Mhealth Uhealth. 2019 Aug 09;7(8):e13491. doi: 10.2196/13491. https://mhealth.jmir.org/2019/8/e13491/ v7i8e13491 [DOI] [PMC free article] [PubMed] [Google Scholar]
- 32.Shen L, Wang S, Chen W, Fu Q, Evans R, Lan F, Li W, Xu J, Zhang Z. Understanding the function constitution and influence factors on communication for the WeChat official account of top tertiary hospitals in China: Cross-sectional study. J Med Internet Res. 2019 Dec 09;21(12):e13025. doi: 10.2196/13025. https://www.jmir.org/2019/12/e13025/ v21i12e13025 [DOI] [PMC free article] [PubMed] [Google Scholar]
- 33.Yu W, Yu X, Hu H, Duan G, Liu Z, Wang Y. Use of hospital appointment registration systems in China: A survey study. Glob J Health Sci. 2013 Jul 22;5(5):193–201. doi: 10.5539/gjhs.v5n5p193. doi: 10.5539/gjhs.v5n5p193. [DOI] [PMC free article] [PubMed] [Google Scholar]
- 34.Sieck CJ, Sheon A, Ancker JS, Castek J, Callahan B, Siefer A. Digital inclusion as a social determinant of health. NPJ Digit Med. 2021 Mar 17;4(1):52. doi: 10.1038/s41746-021-00413-8. doi: 10.1038/s41746-021-00413-8.10.1038/s41746-021-00413-8 [DOI] [PMC free article] [PubMed] [Google Scholar]
- 35.Free C, Phillips G, Felix L, Galli L, Patel V, Edwards P. The effectiveness of M-health technologies for improving health and health services: A systematic review protocol. BMC Res Notes. 2010 Oct 06;3:250. doi: 10.1186/1756-0500-3-250. https://bmcresnotes.biomedcentral.com/articles/10.1186/1756-0500-3-250 .1756-0500-3-250 [DOI] [PMC free article] [PubMed] [Google Scholar]
- 36.Be He@lthy, Be Mobile: Annual Report 2017. Geneva, Switzerland: World Health Organization and International Telecommunication Union; 2018. [2022-05-17]. https://apps.who.int/iris/bitstream/handle/10665/326498/9789241516242-eng.pdf?sequence=1&isAllowed=y . [Google Scholar]
- 37.Hamilton EC, Saiyed F, Miller CC, Eguia A, Fonseca AC, Baum GP, Tsao K, Austin MT. The digital divide in adoption and use of mobile health technology among caregivers of pediatric surgery patients. J Pediatr Surg. 2018 Aug;53(8):1478–1493. doi: 10.1016/j.jpedsurg.2017.08.023.S0022-3468(17)30519-5 [DOI] [PubMed] [Google Scholar]
- 38.Wang L, Xiao Y, Rao E, Jiang L, Xiao Y, Ouyang Z. An assessment of the impact of urbanization on soil erosion in Inner Mongolia. Int J Environ Res Public Health. 2018 Mar 19;15(3):550. doi: 10.3390/ijerph15030550. https://www.mdpi.com/resolver?pii=ijerph15030550 .ijerph15030550 [DOI] [PMC free article] [PubMed] [Google Scholar]
- 39.Li M, Fan Y, McNeil EB, Chongsuvivatwong V. Traditional Mongolian, Traditional Chinese, and Western Medicine hospitals: System review and patient survey on expectations and perceptions of quality of healthcare in Inner Mongolia, China. Evid Based Complement Alternat Med. 2018;2018:2698461. doi: 10.1155/2018/2698461. doi: 10.1155/2018/2698461. [DOI] [PMC free article] [PubMed] [Google Scholar]
- 40.Hu Y, Zhang Z, Xie J, Wang G. The Outpatient Experience Questionnaire of comprehensive public hospital in China: Development, validity and reliability. Int J Qual Health Care. 2017 Feb 01;29(1):40–46. doi: 10.1093/intqhc/mzw133.mzw133 [DOI] [PubMed] [Google Scholar]
- 41.Chang C, Gardiner J, Houang R, Yu Y. Comparing multiple statistical software for multiple-indicator, multiple-cause modeling: An application of gender disparity in adult cognitive functioning using MIDUS II dataset. BMC Med Res Methodol. 2020 Nov 12;20(1):275. doi: 10.1186/s12874-020-01150-4. https://bmcmedresmethodol.biomedcentral.com/articles/10.1186/s12874-020-01150-4 .10.1186/s12874-020-01150-4 [DOI] [PMC free article] [PubMed] [Google Scholar]
- 42.Fox J, Dusa A. Package ‘polycor’: Polychoric and polyserial correlations. The Comprehensive R Archive Network. 2022. Jan 11, [2022-05-07]. https://cran.r-project.org/web/packages/polycor/polycor.pdf .
- 43.Revelle W. Package ‘psych’: Procedures for psychological, psychometric, and personality research. Personality Project. 2021. Mar 27, [2022-03-01]. https://personality-project.org/r/psych-manual.pdf .
- 44.Yves RT, Jorgensen TD, Rockwood N, Oberski D, Byrnes J, Vanbrabant L, Savalei V, Merkle E, Hallquist M, Rhemtulla M, Katsikatsou M, Barendse M, Scharf F, Du H. Package ‘lavaan’: Latent variable analysis. The Comprehensive R Archive Network. 2022. Mar 31, [2022-04-05]. https://cran.r-project.org/web/packages/lavaan/lavaan.pdf .
- 45.Xie Z, Nacioglu A, Or C. Prevalence, demographic correlates, and perceived impacts of mobile health app use amongst Chinese adults: Cross-sectional survey study. JMIR Mhealth Uhealth. 2018 Apr 26;6(4):e103. doi: 10.2196/mhealth.9002. https://mhealth.jmir.org/2018/4/e103/ v6i4e103 [DOI] [PMC free article] [PubMed] [Google Scholar]
- 46.Households' income and consumption expenditure in the first half year of 2021. National Bureau of Statistics of China. 2021. Jul 16, [2022-05-10]. http://www.stats.gov.cn/enGliSH/PressRelease/202107/t20210716_1819567.html .
- 47.Kaiser HF. A second generation Little Jiffy. Psychometrika. 1970 Dec;35(4):401–415. doi: 10.1007/BF02291817. [DOI] [Google Scholar]
- 48.Kaiser HF, Rice J. Little Jiffy, Mark IV. Educ Psychol Meas. 2016 Jul 02;34(1):111–117. doi: 10.1177/001316447403400115. [DOI] [Google Scholar]
- 49.Bartlett MS. The effect of standardization on a χ2 approximation in factor analysis. Biometrika. 1951 Dec;38(3/4):337. doi: 10.2307/2332580. [DOI] [Google Scholar]
- 50.Courtney MGR. Determining the number of factors to retain in EFA: Using the SPSS R-Menu v2 0 to make more judicious estimations. Pract Assess Res Eval. 2013;18:1–14. doi: 10.7275/9cf5-2m72. https://scholarworks.umass.edu/cgi/viewcontent.cgi?article=1305&context=pare . [DOI] [Google Scholar]
- 51.Brown TA. Confirmatory Factor Analysis for Applied Research. 2nd edition. New York, NY: The Guilford Press; 2015. [Google Scholar]
- 52.Fabrigar LR, Wegener DT. Exploratory Factor Analysis: Understanding Statistics. New York, NY: Oxford University Press; 2011. [Google Scholar]
- 53.Hair Jr JF, Black WC, Babin BJ, Anderson RE. Multivariate Data Analysis: A Global Perspective. 7th edition. London, UK: Pearson Education; 2010. [Google Scholar]
- 54.Pettersson E, Turkheimer E. Item selection, evaluation, and simple structure in personality data. J Res Pers. 2010 Aug 01;44(4):407–420. doi: 10.1016/j.jrp.2010.03.002. http://europepmc.org/abstract/MED/20694168 . [DOI] [PMC free article] [PubMed] [Google Scholar]
- 55.Gana K, Broc G. Structural Equation Modeling with lavaan. London, UK: ISTE Ltd; 2019. [Google Scholar]
- 56.Hofmann G, Thomas G. Digital lifestyle 2020. IEEE Multimed. 2008 Apr;15(2):4–7. doi: 10.1109/mmul.2008.24. [DOI] [Google Scholar]
- 57.Price rankings by country of internet (60 Mbps or more, unlimited data, cable/ADSL) (utilities (monthly)) Numbeo. 2022. [2021-11-01]. https://www.numbeo.com/cost-of-living/country_price_rankings?itemId=33 .
- 58.Winkelhake U. The Digital Transformation of the Automotive Industry. Cham, Switzerland: Springer; 2021. “Digital lifestyle”—Future employees and customers; pp. 29–46. [Google Scholar]
- 59.Carroll JK, Moorhead A, Bond R, LeBlanc WG, Petrella RJ, Fiscella K. Who uses mobile phone health apps and does use matter? A secondary data analytics approach. J Med Internet Res. 2017 Apr 19;19(4):e125. doi: 10.2196/jmir.5604. https://www.jmir.org/2017/4/e125/ v19i4e125 [DOI] [PMC free article] [PubMed] [Google Scholar]
- 60.Ernsting C, Dombrowski SU, Oedekoven M, O'Sullivan JL, Kanzler M, Kuhlmey A, Gellert P. Using smartphones and health apps to change and manage health behaviors: A population-based survey. J Med Internet Res. 2017 Apr 05;19(4):e101. doi: 10.2196/jmir.6838. https://www.jmir.org/2017/4/e101/ v19i4e101 [DOI] [PMC free article] [PubMed] [Google Scholar]