

Abstract
Light-driven conversion of CO2 to chemicals provides a sustainable alternative to fossil fuels, but homogeneous systems are typically limited by cross reactivity between different redox half reactions and inefficient charge separation. Herein, we present the bioinspired development of amphiphilic photosensitizer and catalyst pairs that self-assemble in lipid membranes to overcome some of these limitations and enable photocatalytic CO2 reduction in liposomes using precious metal-free catalysts. Using sodium ascorbate as a sacrificial electron source, a membrane-anchored alkylated cobalt porphyrin demonstrates higher catalytic CO production (1456 vs 312 turnovers) and selectivity (77 vs 11%) compared to its water-soluble nonalkylated counterpart. Time-resolved and steady-state spectroscopy revealed that self-assembly facilitates this performance enhancement by enabling a charge-separation state lifetime increase of up to two orders of magnitude in the dye while allowing for a ninefold faster electron transfer to the catalyst. Spectroelectrochemistry and density functional theory calculations of the alkylated Co porphyrin catalyst support a four-electron-charging mechanism that activates the catalyst prior to catalysis, together with key catalytic intermediates. Our molecular liposome system therefore benefits from membrane immobilization and provides a versatile and efficient platform for photocatalysis.
Introduction
The sunlight-driven reduction of CO2 to value-added products is a promising and sustainable path to mitigate anthropogenic CO2 emissions and produce renewable platform chemicals. The use of lipid membranes such as liposomes as artificial photosynthetic scaffolds is an elegant and bioinspired approach to design photosynthetic systems.1 These synthetic liposomes can self-assemble into biomimetics of thylakoid membranes while allowing tunability of their supramolecular and photocatalytic components. Crucially, they facilitate charge separation2−4 and can spatially separate (compartmentalize) redox half reactions,5,6 thereby avoiding cross reactivity (such as back reactions and charge recombination)7−10 that severely limits homogeneous photocatalysis.1,11
Liposomes have been explored as scaffolds for different photochemical processes, including charge separation dynamics across lipid membranes5,7,9,12,13 and molecule-based photocatalytic systems for water oxidation and reduction.14−17 More recently, full water splitting was reported using liposomes embedded with photocatalytic metal organic frameworks.6 However, CO2 photoreduction liposome systems remain scarce,18,19 and understanding has been limiting, hence preventing further development. The previously reported examples utilized a membrane-bound ruthenium tris-bipyridine dye and Lehn-type rhenium bipyridine catalyst, which generated moderate amounts of CO under visible light irradiation (CO turnover number [TONCO] = 190 after 15 h18 and 15 after 3 h19). In comparison, the library of homogeneous CO2 photocatalytic systems is extensive, and earth-abundant catalysts based on terpyridine and porphyrin ligand families display high catalytic activity and product selectivity under aqueous conditions.20−25
Herein, we exploit the tunability of molecular catalysts to synthesize alkylated CO2 reduction catalysts to self-assemble with alkylated photosensitizers in liposome membranes. These new catalysts are based on state-of-the-art homogeneous catalysts,20,21 with modified ligand scaffolds. The beneficial effects of self-assembly and flexibility of the approach,1 which enable facile variation of active sites in the liposomes, are demonstrated by a series of new alkylated precious metal-free catalysts based on terpyridine and porphyrin ligands (Figure 1A). Photocatalysis results comparing the performance between alkylated catalysts and water-soluble catalyst analogues are provided, and time-resolved/steady-state emission (photoluminescence) and transient absorption spectroscopies are utilized to determine the beneficial effects of self-assembly on charge separation. These techniques provide unprecedented insights into the photoinduced charge-transfer dynamics at the water–membrane interfaces. Key interactions between the sacrificial electron donor sodium ascorbate (NaHAsc), membrane-bound [Ru(bipyridine)3]2+-type photosensitizer, and catalyst molecules are examined to explain the superior photocatalytic activity of liposomes compared to their homogeneous analogues. Furthermore, the most active catalyst, 5,10,15,20-(tetra-N-hexadecyl-4-pyridinium)porphyrin cobalt(II) (CoPL), is comprehensively studied on transparent electrodes using in situ UV–vis–NIR and resonance Raman spectroelectrochemistry to understand its catalytic behavior, an approach that still remains scarce.26−32 In combination with density functional theory (DFT), these methods reveal important reaction intermediates during CO2 reduction and an unusual precatalytic four-electron charging mechanism that precedes its catalytic activity.
Figure 1.

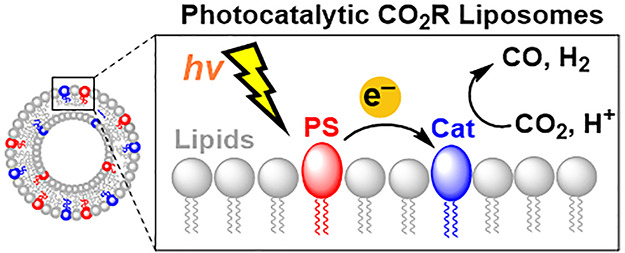
Structures of molecular components and phospholipids, and schematic representation of molecularly decorated liposomes. (A) Lipophilic (subscript L) and water-soluble (subscript W) bis-terpyridine- and porphyrin-based molecular catalysts (blue, left and center) and ruthenium tris-bipyridine photosensitizer (red, right). (B) Phospholipids 1,2-dimyristoyl-sn-glycero-3-phosphocholine (DMPC) and 1,2-distearoyl-sn-glycero-3-phosphoethanolamine-N-[methoxy(polyethylene glycol)-2000] (NaDSPE-PEG2K). (C) Scheme of a molecularly functionalized liposome system, with the inset highlighting a simplified representation of different electron transfer steps occurring during photocatalytic CO2 reduction at the water–membrane interfaces. Cat = catalyst, PS = photosensitizer, and ED = electron donor, i.e., sodium ascorbate (NaHAsc).
Results and Discussion
Synthesis and Assembly of Photocatalytic Liposomes
The tunability of molecular catalysts allows the periphery of the catalyst to be functionalized for self-assembly while maintaining a functional catalytically active site. The 3d transition metal complexes of Fe, Co, and Ni have emerged as active CO2 reduction catalysts with terpyridine20,23,33 and porphyrin21,24 ligands (hereinafter denoted as T and P, respectively), with no reports yet implementing them in self-assembled photocatalytic CO2 reduction liposome systems. To increase their lipophilicity and facilitate assembly at the water–membrane interface in the liposomes, hexadecyl chains were introduced into the ligands to prepare a systematic series (denoted as MTL and MPL, where L = lipophilic, W = water-soluble, and M = Co, Ni, Fe; Figure 1).1 Full synthetic and characterization details are provided in the Supplementary Methods section (see Figures S1–S4).
The UV–vis spectra and cyclic voltammograms (CVs) are comparable for the alkylated and water-soluble analogues in all cases, including the photosensitizers (Figures 2A,B and S5–S15), which indicates that the catalytically active site remains largely unchanged. Focusing on the most active catalysts CoPL and CoPW (see below), analogous absorption features are observed by UV–vis spectroscopy in acetone (Figure 2A, Soret bands: ε426nm = 1.07 × 10⁵ and ε423nm 1.05 × 10⁵ M–1 cm–1, respectively), as well as analogous electrochemical response. The CV of CoPL in N2- and CO2-saturated dimethylformamide (DMF) shows five reversible redox processes centered at −0.82, −0.99, −1.20, −1.38, and −1.49 V vs Fc0/+ (Figure 2B).21,34 The first two processes correspond to the same metal-centered single-electron reduction process (CoII/I), possibly due to different electroactive environments created by the (de)coordination of DMF molecules and the different arrangement of the long alkyl tails in solution.34 The other three redox waves are assigned based on the literature to a one-electron porphyrin-centered single-electron reduction (PW0/–) and two pyridinium-centered two-electron reductions (Table S1).21,34 Integration of the square wave voltammetry (SWV) scans of CoPL and CoPW and comparison of the relative ratios between the charge passed during chronoamperometry measurements in DMF confirm that both molecules can store up to six electrons (Figure S16 and Tables S2 and S3).
Figure 2.

Comparison of UV–vis spectra and cyclic voltammetry (CV) of CoPL and CoPW catalysts and photocatalytic CO2 reduction results. (A) UV–vis spectra of porphyrin-based (blue) water-soluble CoPw and (black) lipophilic CoPL catalysts in acetone. (B) CV of CoPL and CoPW in (black) N2- and (orange) CO2-saturated 0.2 M TBAPF6 DMF solutions. (C) Cryo-TEM of unilamellar liposomes containing [DMPC] = 100 μM, [NaDSPE-PEG2K] = 1 μM, [RuPSL] = 10 μM, and [NiTL] = 2 μM. (D) Photocatalytic activity as a function of time of liposomes containing all alkylated catalysts at the same concentration (500 nM) in CO2-saturated 0.1 M NaHCO3. (E) Photocatalytic activity of (red) CoPL in liposomes and (orange) CoPW in homogeneous conditions as a function of catalyst concentration (0–500 nM) in CO2-saturated 0.1 M NaHCO3 after 4-h experiments. (F) Photocatalytic activity of liposomes containing CoPL as a function of catalyst concentration (0–500 nM) in CO2-saturated 0.1 M (red) NaHCO3 and (gray) NaH2PO4 buffer after 4-h experiments. Arrows in Figure 2E,F indicate the dataset’s y axis. CV experimental conditions: working electrode: glassy carbon (φ = 3 mm), counter electrode: Pt mesh, reference electrode: Ag/AgNO3 (10 mM) in 0.2 M TBAPF6 acetonitrile. Fc+/0 couple = +0.07 V vs Ag/AgNO3. Scan rate: 100 mV s–1. Photocatalytic experimental conditions: (liposomes, plots D-F) [DMPC] = 100 μM, [NaDSPE-PEG2K] = 1 μM, [RuPSL] = 10 μM, [Catalyst] = 500 nM in plot D or 20–500 nM in plots E and F. (Homogeneous, plot E) [RuPSW] = 10 μM, [Catalyst] = 20–500 nM. CO2-saturated 0.1 M NaHAsc and 0.1 M NaHCO3 (pH = 6.7) or NaH2PO4 (pH = 6.3) at 25 °C.
The liposomes are fabricated by extrusion using two different phospholipids (Figure 1B) to increase the liposomes’ stability and the affinity between the membrane and the metal complexes, which are mixed with the two phospholipids before extrusion (see the Supplementary Methods section).14−16,35 The first lipid is 1,2-dimyristoyl-sn-glycero-3-phosphocholine (DMPC), which is a zwitterionic lipid at neutral pH, has a transition-phase temperature of 24 °C, and is used to form the bulk of the membrane bilayers. The second lipid, 1,2-distearoyl-sn-glycero-3-phosphoethanolamine-N-[methoxy(polyethylene glycol)-2000] (NaDSPE-PEG2K), is an anionic and bulky lipid used as a dopant (<1% mol). The use of NaDSPE-PEG2K has a twofold benefit as electrostatic attraction improves immobilization of the positively charged molecular components, whereas its long methoxy polyethylene groups help diminish liposome aggregation.1 Dynamic light scattering measurements showed that extruded liposomes have average diameters of 149 ± 11 nm in 0.1 M NaHCO3 and 127 ± 9 nm in 0.1 M NaH2PO4 and 0.1 M NaHAsc (Tables S4–S6). These sizes are consistent with Cryo-TEM (Figure 2C). Dynamic light scattering also showed that liposome size, with and without dye and catalyst molecules, is not affected after 4 h of visible light irradiation (<10% size variation), which highlights the photostability of the lipids under our experimental conditions.
Furthermore, initial screening of molecule-containing liposomes fabricated with DMPC and two different lipids, i.e., 1,2-dilauroyl-sn-glycero-3-phosphocholine and 1,2-dipalmitoyl-sn-glycero-3-phosphocholine, showed that all three doped liposomes were in the fluid liquid crystal phase at room temperature, possibly due to the presence of 10% RuPSL (Figure S17). Importantly, DMPC-based liposomes exhibited better catalytic activity and electron transfer kinetics than the other two; hence, we selected DMPC as the main liposome building block thereafter (see Supplementary Note 1).
Photocatalytic CO2 Reduction in Liposomes
The photocatalytic activity of liposomes was assessed in CO2-saturated aqueous NaHCO3 buffer solution (25 °C) containing sodium ascorbate (NaHAsc) as a sacrificial electron donor (pH ≈ 6.7) under visible light irradiation from a solar light simulator (AM 1.5G, 100 mW cm–2, λ > 400 nm UV filter, IR water filter) (Figures S18–25). The photosensitizer is a single electron donor; therefore, photocatalytic tests employ an excess of photosensitizer to drive the 2e– reduction of CO2 to CO. During catalyst screening, a 20:1 photosensitizer to catalyst ratio was used to minimize electron transfer limitations and allow the nature of the catalysts to limit system performance.
CO evolved as the major photocatalytic CO2 reduction product from all six alkylated catalysts (Figures 1A and 2D) and was analyzed by gas chromatography (GC), with moderate-to-high CO selectivity (62% for NiPL and 74–87% for all others; Tables 1, S7, and S8). H2 was a byproduct, and no other products were detected after 4 h of photocatalysis (such as methane using GC or formate using nuclear magnetic resonance (NMR) and ion chromatography). In contrast, analogous homogeneous systems containing water-soluble photosensitizer RuPSW and catalysts (MPW or MTW) produce lower amounts of CO and, in most cases, higher amounts of H2 under the same experimental conditions (Figure 2E, Tables 1, S8, and S9). This is exemplified by comparing CoPL in liposomes with its homogeneous analogue CoPW, reported previously,21 as CoPL shows more catalytic turnovers (TONCO = 189 ± 8 vs 65 ± 1) and a higher CO formation rate (89 ± 18 vs 24 ± 1 nmolCO h–1) under the same experimental conditions. This difference in performance can be ascribed to diffusion limitations for the homogeneous system, such as slower electron transfer kinetics between RuPSW and catalysts (see below).3,4,18 This can be probed indirectly by varying the catalyst concentration, with CoPL-containing liposomes being more active and CO selective at all concentrations (20–500 nM) with a directly proportional relationship between CO formation and CoPL concentration (Figure 2F). At 20 nM catalyst concentration, CoPL reaches a TONCO of 735 ± 91 and CO selectivity of 78%, compared to a TONCO of 529 ± 3 and CO selectivity of 58% for CoPW.
Table 1. Summary of Exclusion Control and Buffer-Dependent Experimentsa.
| entry | PSb | catalyst (nM) | buffer | CO/nmol (TONCO) | H2/nmol (TONH2) | PTONCOc | CO Sel. /%d |
|---|---|---|---|---|---|---|---|
| 1 | RuPSL | CoPL (500) | NaHCO3 | 283 (189) | 55 (36) | 19 | 84 |
| 2 | RuPSL | CoPL (20) | NaHCO3 | 44 (735) | 14 (225) | 3 | 78 |
| 3 | RuPSL | CoPL (500) | NaH2PO4 | 541 (361) | 120 (80) | 36 | 82 |
| 4 | RuPSL | CoPL (20) | NaH2PO4 | 87 (1456) | 26 (434) | 6 | 77 |
| 5 | RuPSW | CoPW (500) | NaHCO3 | 97 (65) | 15 (10) | 6 | 87 |
| 6 | RuPSW | CoPW(20) | NaHCO3 | 32 (529) | 23 (379) | 2 | 58 |
| 7 | RuPSW | CoPW (500) | NaH2PO4 | 199 (133) | 97 (65) | 13 | 73 |
| 8 | RuPSW | CoPW (20) | NaH2PO4 | 19 (312) | 146 (2425) | 1 | 11 |
| 9e | RuPSL | CoPL (500) | NaHCO3 | n.d. (−) | n.d. (−) | ||
| 10 | – | CoPL (500) | NaHCO3 | n.d. (−) | n.d. (−) | ||
| 11f | RuPSL | – | NaHCO3 | 6 (−) | 5 (−) | <1 | 54 |
| 12g | RuPSL | CoPL (500) | NaHCO3 | n.d. (−) | n.d. (−) | ||
| 13f | RuPSW | – | NaHCO3 | 28 (−) | 31 (−) | 2 | 48 |
Results confirm the origin of CO and compare the buffer-dependent catalytic activity of CoPL in liposomes and CoPW in homogeneous conditions.
In all cases, [PS] = 10 μM. [DMPC] = 100 μM and [NaDSPE-PEG2K] = 1 μM used with RuPSL; [NaHAsc] = 0.1 M in CO2-saturated aqueous 0.1 M NaHCO3 (pH ≈ 6.7) or 0.1 M NaH2PO4 (pH ≈ 6.3) buffer solution, λ > 400 nm, AM 1.5G, 100 mW cm–2, 25 °C.
PTONCO is the TONCO based on PS and is calculated to be 2 × mol CO /mol PS.
CO selectivity (%) = nCO/(nCO + nH2) × 100. “n.d.” stands for not detected.
Experiments carried out in the dark.
In experiments without a catalyst, the CO and H2 evolved likely come from RuPSL or RuPSW and unidentified photodegraded byproducts.37,38
NaHAsc was absent.
Exchanging the CO2-saturated 0.1 M buffer from NaHCO3 to NaH2PO4 (pH ≈ 6.7 vs 6.3) provides a higher buffering capacity and minimizes proton gradients near the two-dimensional water–membrane interface.36 This change increases the rate of CO production for CoPL at varying catalyst concentrations while also maintaining high CO selectivity (Figure 2F). This leads to a TONCO of 1456 ± 36 and CO selectivity of 77% for CoPL at 20 nM, compared to 312 ± 22 and 11% for CoPW. These results exceed previously reported Re(bipyridine)-based liposome systems,18,19 and match top performing homogeneous photocatalytic CO2 reduction systems in aqueous conditions (Table S10).
Exclusion control experiments for the CoPL system confirm that no gaseous products evolve in the absence of RuPSL, NaHAsc, or light irradiation (Table 1 for details). Photocatalysis with isotopically labeled 13CO2 shows the formation of 13CO as the only photocatalytic CO2 reduction product, which confirms that CO is produced from CO2 (Figure S26). The rate of CO formation in all cases decays over time, which can be attributed to the photodegradation of RuPSL during light irradiation. This hypothesis is confirmed by electronic absorption spectroscopy showing that after light irradiation in liposomes, containing both RuPSL and an alkylated catalyst, the 450 nm band belonging to RuPSL decreases in intensity irreversibly over time. This is in contrast to liposomes containing only CoPL, where the Soret band intensity does not diminish (Figure S27), consistent with previous reports.15,37−39 Additionally, while 0.1 M NaHAsc was chosen as the optimal concentration to obtain a high CO evolution rate and CO selectivity, variation of NaHAsc concentration (50–400 mM), as well as visible light intensity (20–100%), shows that CO and H2 formation is affected by both variables (Tables S11 and S12), confirming that formation of reduced RuPSL– species is limiting the overall reaction of the studied liposomes.
Photoinduced Charge Transfer in Liposomes
To determine
the effects of membrane self-assembly on electron transfer steps,
time-resolved and steady-state emission quenching studies (Stern–Volmer
analysis) were carried out with water-soluble and lipophilic photosensitizers
(i.e., RuPSW or RuPSL) (Figure S28). In both cases, [RuII(bpy)3]2+ is photoexcited and reductively
quenched by NaHAsc to form [RuII(bpy)2(bpy·–)]+, with the photoluminescence
intensity of photoexcited Ru(II) being dependent on the quenching
rate.40 Examining homogeneous RuPSW, the quenching occurs by diffusional encounter with
NaHAsc, as observed with indistinguishable steady-state and time-resolved
Stern–Volmer plots (i.e., I0/I and τ0/τ as a function of [NaHAsc]
in Figure 3A; bimolecular
quenching rate constant kq = 3.7 ×
107 M–1 s–1). In contrast,
while the emission intensity is strongly decreased by increasing the
concentration of NaHAsc, it does not have an obvious effect on the
emission lifetime of RuPSL in liposomes (Figure 3B). This can be attributed
to a high local concentration of HAsc–, which is
electrostatically attracted to the charge-dense liposome membranes
loaded with cationic RuPSL (coulombic association-driven
static quenching with an association constant KA of 31 M–1). This is further supported by
comparing the quenching quantum efficiencies ( ; I = emission intensity)
in liposomes of 100 mM anionic HAsc– (φ =
0.74) with a 100 mM concentration of the cationic quencher methyl
viologen (φ = 0.16; Figure S29).
By contrast in homogeneous solution, methyl viologen shows a rate
constant kq ≈ 1.0 × 10⁹ M–1 s–1 with excited
[RuII(bpy)3]2+, which is twenty-seven-fold
larger than that of NaHAsc.
; I = emission intensity)
in liposomes of 100 mM anionic HAsc– (φ =
0.74) with a 100 mM concentration of the cationic quencher methyl
viologen (φ = 0.16; Figure S29).
By contrast in homogeneous solution, methyl viologen shows a rate
constant kq ≈ 1.0 × 10⁹ M–1 s–1 with excited
[RuII(bpy)3]2+, which is twenty-seven-fold
larger than that of NaHAsc.
Figure 3.

Photoinduced charge transfer in liposomes. (A and B) Stern–Volmer plots in the homogeneous environment and liposomes, respectively, from steady-state emission intensity (I0/I) and lifetime (τ0/τ) data as a function of NaHAsc concentration, where I0 and τ0 are the values in the absence of NaHAsc. (C) Normalized transient absorption kinetic traces collected for RuPS– at 500 nm for 500 μs after laser excitation. (D) Normalized kinetic traces for RuPSW– at 500 nm (original ΔOD ≈ 0.025) obtained in the presence of [NiTW] = 0–300 μM. (E) Normalized kinetic traces for RuPSL– at 500 nm (original ΔOD ≈ 0.003) obtained in the presence of [NiTL] = 0–5 μM. (F) Summary of photoinduced charge-transfer dynamics of photocatalytic liposome and homogeneous systems (see also Table S14). (Green) Lifetime of excited photosensitizer molecules, and in brackets, the percent contribution for the short-lifetime component, in homogeneous (Hom.) and liposomes (Lip.) before self-quenching occurs, without the presence of HAsc–. Experimental conditions: (homogeneous) [RuPSW] = 30 μM; and (liposomes) [DMPC] = 100 μM, [NaDSPE-PEG2K] = 1 μM, [RuPSL] = 10 μM in Ar-saturated 0.1 M NaHCO3. (Red) Reductive quenching rate and adsorption rate constants (kq and KA, respectively), and charge separation quantum yields (φET) for homogeneous and liposome systems (see Figure S31 and Supplementary Note 3). Experimental conditions: (homogeneous) [RuPSW] = 30 μM, [NaHAsc] = 0–0.3 M; and (liposomes) [DMPC] = 100 μM, [NaDSPE-PEG2K] = 1 μM, [RuPSL] = 10 μM, [NaHAsc] = 0–0.1 M in Ar-saturated 0.1 M NaHCO3. (Orange) Charge recombination timescale between reduced PS and oxidized quenchers in homogeneous and liposomes. Experimental conditions: (homogeneous) [RuPSW] = 30 μM; and (liposomes) [DMPC] = 100 μM, [NaDSPE-PEG2K] = 1 μM, [RuPSL] = 10 μM in Ar-saturated 0.1 M NaHAsc and 0.1 M NaHCO3. (Blue) One-electron transfer rate constants between the reduced PS and a catalyst. Experimental conditions: (homogeneous) [RuPSW] = 30 μM, [NiTW] = 0–300 μM or [CoPW] = 0–25 μM; and (liposomes) [DMPC] = 100 μM, [NaDSPE-PEG2K] = 1 μM, [RuPSL] = 10 μM, [NiTL] = 0–5 μM in Ar-saturated 0.1 M NaHAsc and 0.1 M NaHCO3. (Pink) Charge recombination timescale between the reduced catalyst (NiTW) and oxidized quencher in homogeneous conditions. Experimental conditions: [RuPSW] = 30 μM, [NiTW] = 100 μM in Ar-saturated 0.1 M NaHAsc and 0.1 M NaHCO3.
Immobilizing complexes in liposomes increases their local concentration, which may increase the rate of self-quenching processes of RuPSL.1 This was examined by monitoring the phosphorescence decay rate at 600 and 650 nm in the absence of NaHAsc, which showed no difference for homogeneous RuPSW. In contrast, the decay for membrane-bound RuPSL was faster as the RuPSL concentration increased (DMPC/RuPSL molar ratios of 10:1, 20:1, and 40:1 were studied; Figure S30). Data fitting of the emission trace at 650 nm indicated a short-lifetime component attributed to self-quenching by a neighboring ground-state RuPSL molecule (see Supplementary Note 2 and Table S14). The contribution of this self-quenching component to the overall rate is smaller at higher concentrations of DMPC. This indicates that diluting RuPSL in the liposomes hinders self-quenching events, presumably by spatially separating them. This emphasizes the importance of balancing higher photosensitizer concentrations to maximize light absorption against self-quenching processes. Photocatalysis results showed that higher concentrations of DMPC (more liposomes), with constant total concentrations of RuPSL and CoPL, had higher catalytic activity consistent with the above findings (Figure S24 and Table S13).
Transient absorption spectroscopy (TAS) uses laser pulse excitation and measures the absorption of photogenerated species. This allows the lifetimes of the photoexcited [RuIII(bpy)2(bpy·–)]2+* and reductively quenched [RuII(bpy)2(bpy·–)]+ (RuPS–) to be compared in homogeneous solution and within liposomes.41 Reductive quenching of the photoexcited state by NaHAsc forms the formal RuPS–, which absorbs at 500 nm. RuPS– has a reduction potential of ≈−1.2 V vs SHE in 0.1 M NaHCO3,22 which provides enough driving force to reduce the catalysts. The conversion of RuPS to RuPS– (i.e., charge separation quantum yield or φET) is higher in homogeneous conditions than in liposomes (35 vs 6%) and may be ascribed to the charged liposome membranes. While liposomes favor static quenching (see above), they also hinder diffusion of oxidized ascorbate species and thereby lower their solvent-cage escape yield (Figure S31 and Supplementary Note 3). In contrast, the decay of RuPS– is far slower in liposomes than in homogeneous solution, with a substantial absorbance value remaining even 500 μs after the excitation pulse (Figure 3C). While the homogeneous RuPSW– decay is approximately single exponential (26 μs time constant), RuPSL– is strongly biphasic (Figure S32), with one phase similar to that in homogeneous solution (110 μs time constant, 23% contribution) and one much slower, which represents the majority of RuPSL– (2.4 ms time constant, 77% contribution). A tentative assignment is that the fast phase is the rapid recombination of immobilized RuPSL– and oxidized ascorbate molecules remaining near the reaction site at the same liposome, possibly at the interior liposome interface, while the slower recombination is between RuPSL– species and oxidized ascorbate molecules that have escaped into the bulk solution.3 Thereby, despite liposomes showing lower φET, the incorporation of charged dyes into the liposome membrane slows recombination processes and favors long-lived charge separated states, highlighting liposomes as more efficient systems for photoinduced charge separation.
Key to catalytic turnover is the electron transfer kinetics between the reduced photosensitizer RuPS– and catalyst, which can be probed using TAS to monitor the absorption decay of RuPS– in the presence of the catalyst. NiTW and CoPW were analyzed as homogeneous model catalysts because of the lack of visible absorption of NiTW, which complements that of RuPS, and the high catalytic performance of CoPW. The presence of either leads to a more rapid decay of RuPSW– species (Figures 3D and S33 and Supplementary Note 4) and is accompanied by the formation of new absorption bands at 450 and 470 nm for NiTW– and CoPW–, respectively, as well as the bleaching of the Soret band at ≈430 nm for CoPW– (Figures S34 and S35). In liposomes, all six alkylated catalysts accelerate the decay of the RuPSL– species, which is a solid indicator of electron transfer occurring from RuPSL– to the catalysts in close proximity (Figures 3E, S36, and S37). Exemplifying the beneficial forward electron transfer kinetics of membrane-bound species over homogeneous systems, the bimolecular electron transfer rate constant kET of membrane-bound NiTL is nine times faster than that of the homogeneous system NiTW (2.0 × 10¹⁰ vs 2.2 × 10⁹ M–1 s–1; Figure S38). This enables a comparable electron transfer yield for 5 μM NiTL in liposomes and 100 μM NiTW in homogeneous solution (ca. 80% in both cases; see Table S14 and Supplementary Note 5 for details). Notably, the kET of CoPW (1.3 × 10¹⁰ M–1 s–1) is six times faster than that of NiTW and highlights the larger driving force to reduce CoPW compared to NiTW.
Taken together, these findings (summarized in Figure 3F) show that self-assembly of the membrane-bound species strongly affects reductive quenching and self-quenching dynamics. They can also increase charge separation and recombination lifetimes. Crucially, despite the lower φET of liposomes, the relatively high surface concentration of membrane-bound species in liposomes diminishes diffusion limitations that hinder homogeneous systems. This is due to shorter electron transfer distances between photosensitizers and catalysts, which greatly assists catalysis.1,15
Mechanistic Studies of CoPL-Mediated CO2 Reduction
The high catalytic activity of CoPL prompted an investigation into its catalytic mechanism. The hydrophobic nature of its alkyl tails enables it to be immobilized via physisorption onto conductive supports such as transparent fluorine-doped tin oxide (FTO) or glassy carbon electrodes (GCE) after dropcasting. This allowed a mechanistic study coupling its electrochemical response to spectroelectrochemical (SEC) UV–vis and Raman spectroscopies. The results were rationalized by DFT calculations to examine the molecular changes that CoPL undergoes during CO2 reduction.
The SWV of FTO|CoPL in CO2-saturated 0.1 M NaHCO3 displays two reduction waves appearing at −0.1 and −0.35 V vs SHE (Figure 4A), which are assigned to a first metal-centered one-electron process and then a ligand-centered three-electron process (Table S3). FTO|CoPL and GCE|CoPL presented a catalytic CO2 reduction wave with an onset potential (Eonset) at −0.9 V, and CO is detected by GC after chronoamperometry at −0.9 V (0.07 and 0.16 μmol CO cm–2, respectively), (Figure S39 and Table S15). In contrast, the equivalent blank chronoamperometry experiments using bare FTO and GCE evolved 0.01 and 0 μmol CO cm–2, respectively. For comparison, the immobilized catalyst shows similar redox processes and catalytic onset to CoPW.21,24 Chronoamperometry measurements at −0.9 V of the other five alkylated catalysts (MPL and MTL) on GCE reveal that they are less active and CO selective than CoPL (Figure S39C), indicating that CoPL has the lowest overpotential (η ≃ 0.37 V) to reduce CO2 of all six alkylated catalysts, which supports the trend observed in photocatalysis.
Figure 4.

Square wave voltammetry (SWV) scans, chronoamperometry, and UV–vis–NIR spectroelectrochemistry (SEC) of CoPL immobilized on FTO. (A) SWV scans of CoPL dropcast on fluorine-doped tin oxide (FTO) in N2- and CO2-saturated 0.1 M NaHCO3. Deconvoluted SWV waves are shown as dashed lines. (B and C) In situ UV–vis–NIR SEC of CoPL dropcast on FTO in N2- and CO2-saturated 0.1 M NaHCO3, respectively. (D) Potential-dependent change in the normalized absorbance of the 415 nm (Soret band of CoPL) and 860 nm bands under CO2 compared to under N2 (filled vs open circles). N.B.: The small differences between plots B and C in the shape of the initial spectra at +0.7 V vs SHE are attributed to the different degrees of aggregation of CoPL molecules on the electrode surfaces after dropcasting.44
UV–vis–NIR SEC of FTO|CoPL compared changes in N2- and CO2-saturated 0.1 M NaHCO3 (pH 8.0 and 6.7, respectively) with chronoamperometric potential steps from +0.7 to −0.9 V vs SHE. The pH difference between N2- and CO2-saturated 0.1 M NaHCO3 solutions is caused by the hydration of CO2 to form carbonic acid.36 At +0.7 V, the complex is in the Co(II) state and features a Soret band at 415 nm and Q-band absorption at 535 and 670 nm (Figure 4B,C). The Soret band decreases in intensity as Co(II) is reduced to Co(I),34 starting at 0.0 V in N2 and −0.1 V in CO2, with complete reduction at −0.7 V in both N2 and CO2 (Figure 4D). This is consistent with our SWV and TAS, and the Soret band bleaching may correspond to formation of cobalt hydride species (Co–H) under N2, or binding of CO2 under CO2 saturation.42 Concurrent with CoII/I reduction, the absorption bands at 510 and 575 nm become more intense (Figure S40), indicating reduction of the porphyrin ligand.34 Additionally, a new absorption at 860 nm grows in intensity from −0.3 to −0.7 V and is assigned to the reduction of two hexadecyl-N-pyridinium rings, in agreement with our SWV results and the literature.21,34,43 There are negligible absorption changes at 860 nm from −0.7 to −0.9 V, indicating that the remaining two hexadecyl-N-pyridinium rings are not reduced, even under catalytic conditions. Therefore, this analysis indicates a four-electron reduction that activates the cobalt porphyrin prior to catalysis in water (see below), in contrast to the six-electron reduction of homogeneous CoPL previously observed in DMF, which is not catalytically active (Figures 2B and S13 and Supplementary Note 6 with associated Figure S41 for further discussion).
Raman SEC on FTO|CoPL was performed analogously to UV–vis SEC and interpreted as difference spectra obtained by subtracting the oxidized species spectrum (+0.7 V) from each spectrum (Figure 5A,B). Thereby, reduction of the porphyrin ring is observed below −0.3 V under N2 and CO2 consistent with SWV and UV–vis–NIR SEC results (Figures S42 and S43), specifically changes to peaks at 1007 and 1599 cm–1, ascribed to stretching and bending modes of pyrrole rings (Cα–Cβ, Cβ–Cβ, and Cα–N) and methine bridge (Cα–Cm) within the porphyrin core ligand,45 and between 1300 and 1500 cm–1 arising from CH2 twisting and CH3 bending modes from the alkyl tails (Table S16).46 Further reduction of the CoPL films from −0.5 to −0.7 V in N2 and CO2 induces the concomitant appearance of new and more intense bands (especially in the case of CO2) at 1192, 1212, and 1634 cm–1 that are ascribed to bending and stretching modes of C–C, C–N+, and N+–CH2 in the alkylated pyridinium rings.45,47 This corresponds to the increase in absorption at 860 nm attributed to reduced pyridinium rings. Importantly, applying −0.9 V induces no further spectral changes, highlighting that no more than two pyridinium rings of the CoPL molecules are reduced after −0.7 V, which is consistent with our SEC results and the literature.47 Furthermore, monitoring potential-dependent Raman intensities at 1599 and 1007 cm–1 for an oxidized and a reduced species, respectively, reproduces the trend observed in Figure 5B (Figure S44 and Table S17).
Figure 5.

Resonance Raman spectroelectrochemistry (SEC), DFT calculations, and proposed catalytic cycle for CoPL on FTO. Potential-dependent in situ Raman SEC: (A) difference spectra for N2- and (B) CO2-saturated conditions. Gray translucent bars highlight prominent bands. (C and D) (upper) Experimental and (lower) DFT-calculated spectra at +0.7 and −0.9 V, respectively. All experimental spectra have a polynomial background removed. (E) Proposed catalytic mechanism for CoPL immobilized on FTO supported by experimental and computational results. SWV = square wave voltammetry, CA = chronoamperometry. The dashed box and arrows highlight the experimental techniques utilized to identify different intermediates at the steady state. N.B.: The small differences between plots A and B in the shape of the initial spectra at −0.1 V vs SHE are attributed to the different degrees of aggregation of CoPL molecules on the electrode surfaces after dropcasting.44
Having identified at least two species with distinct charge by Raman SEC, DFT calculations were carried out to obtain simulated Raman spectra for possible reaction intermediates. DFT calculations were performed using CoPW as a simplified structural model (CoP hereinafter) with various charges (+5 to −2) with and without several coadsorbed ligands (CO, CO2, COOH, H2O, and H). Results confirm that the cobalt oxidation state largely influences the Raman spectrum, whereas the axial ligands (other than CO2) result in minimal changes (Supplementary Note 7 and Figures S45–S48). Crucially, the DFT-calculated Raman spectra for the unreduced ([CoP]4+ and [CoP(H2O)]4+) and four-electron reduced ([CoP(CO)]0 and [CoP(H2O)]0) complexes reproduce the experimental spectra obtained under N2 and CO2 at +0.7 and −0.9 V, respectively (Figure 5C,D). This indicates that CoPL molecules can store up to four electrons, in agreement with SWV and UV–vis–NIR SEC. We hence propose a catalytic cycle for CoPL immobilized on FTO (Figure 5E). This catalytic mechanism proceeds via binding of CO2 and protonation by the singly reduced [CoPL]3+ (Eappl = −0.1 V vs SHE). Three further electron transfer steps, protonation, and dehydration of the CO2H adduct then form [CoPL(CO)]2+ (Eappl = −0.7 V). Subsequently, two-electron transfer steps (Eappl = −0.9 V) lead to the formation of the six-electron-reduced [CoPL(CO)]0 adduct. Desorption of CO and coordination of H2O form [CoPL(H2O)]0, which can react with CO2 and two protons to reform [CoPL(CO)]2+ and close the cycle.
Conclusions
We report a systematic series of amphiphilic earth-abundant CO2 reduction catalysts, which were designed to readily self-assemble into lipid membranes and form, together with an amphiphilic ruthenium dye, photocatalytic liposomes. The most active liposome system containing the 5,10,15,20-(tetra-N-hexadecyl-4-pyridinium)porphyrin cobalt(II) catalyst CoPL is more active than its water-soluble analogue, achieving a high TONCO (1456 after 4 h) with high CO selectivity (77%). The CoPL system thereby exceeds previously reported benchmarks in CO2 photoreduction in liposome and homogeneous systems, highlighting the beneficial effect on the activity and product selectivity when immobilizing molecular catalysts onto two-dimensional lipid bilayer surfaces.
Time-resolved and steady-state spectroscopies provided unprecedented insights into the origin of the higher activity of liposome-bound molecular systems. Results revealed that self-assembled dyes have a 4–100 times longer charge separation state lifetime, and display a ninefold faster electron transfer to self-assembled catalysts compared to homogeneous analogues. Two-dimensional charged membranes diminish diffusion limitations between ascorbate and self-assembled photosensitizers due to electrostatic attraction, and despite lowering φET, they increase the reduced photosensitizer lifetime. Membrane immobilization also leads to a higher relative surface concentration of membrane-bound species. This shortens the electron transfer distance between photosensitizers and catalysts, thereby resulting in enhanced catalytic activity. Furthermore, the superior catalytic activity of CoPL was examined to show that it undergoes a four-electron activation mechanism before catalytic turnover with key intermediates being determined by DFT calculations. The proposed multielectron activation mechanism further highlights the advantage of self-assembled systems as the electron transfer efficiency between dye–catalyst pairs is much higher than for diffusional systems. This effect is fundamental to the high activity of these photocatalytic liposome systems.
Hence, beyond providing new insights into the photoinduced charge-transfer dynamics of membrane-bound species and the catalytic mechanism of CoPL, this work illustrates the power of combining time-resolved and in situ spectroscopic techniques to understand molecule-based systems. This work shows the potential of liposome-bound molecular systems for efficient photocatalysis, which can move beyond CO2 reduction in future development.
Experimental Section
Materials
All synthetic procedures involving air- or moisture-sensitive materials were carried out under an inert N2 atmosphere by using Schlenk techniques. Solvents were purchased dried (e.g., DMF) or dried using standard purification procedures under an inert atmosphere. Reagents for synthesis were purchased from commercial suppliers in the highest purity available and used without further purification. CO2 and N2 gas bottles (2% methane internal standard) were purchased from BOC. NaHCO3 (99%), [Co(H2O)6](BF4)2 (>99%), (+)-sodium L-ascorbate (>99%), iodomethane (99%), sodium acetate (99%), tetrabutylammonium hexafluorophosphate (TBAPF6, >99%), 4,4′-dimethyl-2,2′-dipyridyl (98%), and n-butyllithium solution (2.5 M hexane) were purchased from Merck. [Ni(H2O)6](BF4)2 (>99%) was purchased from Fisher Scientific. 4’-Hydroxy-2,2′:6′,2″-terpyridine (98%) was purchased from HETCAT. Anhydrous FeCl2 (99%), 2,2′:6′,2″-terpyridine (97%), and 1-bromohexadecane (97%) were purchased from AK Scientific. [RuCl2(bpy)2] (with a minimum of 19% Ruthenium content) was purchased from Alfa Aesar. Sodium hexafluorophosphate (98.5%), Ni(acetate)2·4H2O (97%), and Co(acetate)2·4H2O (97%) were purchased from Acros Organics. 5,10,15,20-(Tetra-4-pyridyl)porphyrin (P, 98%), iron(III) 5,10,15,20-(tetra-N-methyl-4-pyridyl)porphyrin pentachloride (95%), and nickel(III) 5,10,15,20-(tetra-N-methyl-4-pyridyl)porphyrin pentachloride (95%) were purchased from Porphychem.
Lipid (dry powder) DMPC and polycarbonate extrusion filters (pore size = 0.2 μm; diameter = 19 mm) were purchased from Merck. Lipid (dry powder) NaDSPE-PEG2K, DLPC, DPPC and the extruder set, containing two needles with a holder and heating block, were purchased from Avanti.
Physical Characterization
1H and 13C NMR spectra were collected with a Bruker 400 MHz NMR spectrometer at room temperature. Chemical shifts for 1H NMR spectra are referenced relative to residual protons in the deuterated solvent (Eurisotop). Elemental analyses were carried out by the Microanalysis Service of the Yusuf Hamied Department of Chemistry, University of Cambridge, using a Perkin-Elmer 240 Elemental Analyzer. High-resolution mass spectra were recorded using a Synapt G2-Si high-definition mass spectrometer. UV–vis spectra were collected using a Cary 60 UV–vis spectrometer. Attenuated total reflectance fourier-transform infrared spectra were recorded on a Nicolet iS50 spectrometer. Dynamic light scattering experiments were performed with a Zetasizer Nano ZS.
Preparation of Liposomes and Synthesis of Catalysts and Photosensitizer
Full details of the followed methodology can be found in the Experimental Section in the Supporting Information.
Characterization of Liposomes
Liposome samples were characterized via dynamic light scattering and by cryogenic transmission electron microscopy, which were used to confirm liposome size and analyze the fluidity of liposome samples containing molecular species.
Dynamic Light Scattering
The size distribution of the hydrodynamic diameter (Zave) and the polydispersity index were measured at 25 °C by dynamic light scattering with a Zetasizer Nano-S from Malvern operating at 632.8 nm with a scattering angle of 173°.
Cryogenic Transmission Electron Microscopy (Cryo-TEM)
Samples were analyzed by Cryo-TEM as described elsewhere.48 In brief, samples were equilibrated at 25 °C and high relative humidity within a climate chamber. A small drop of each sample was deposited on a carbon-sputtered copper grid covered with a perforated polymer film. Excess liquid was thereafter removed by blotting with a filter paper, leaving a thin film of the solution on the grid. The sample was vitrified in liquid ethane and transferred to a microscope, continuously kept below −160 °C and protected against atmospheric conditions. Analyses were performed with a Zeiss Libra 120 transmission electron microscope (Carl Zeiss AG, Oberkochen, Germany) operating at 80 kV and in zero-loss bright-field mode. Digital images were recorded under low-dose conditions with a BioVision Pro-SM Slow Scan CCD camera (Proscan elektronische Systeme GmbH, Scheuring, Germany).
Photocatalysis
Before photocatalytic testing, the liposome or homogeneous reaction solution (3 mL) was purged for 20 min with CO2, or N2 for control experiments, containing in both cases 2% methane as the internal standard for GC. After purging, the vials were kept in a water bath at 25 °C and irradiated for 4 h using a Newport Oriel Xenon 150 W solar light simulator (100 mW cm–2, AM1.5G) containing infrared water and ultraviolet (λ > 400 nm) filters. Each different photocatalytic experiment was performed in triplicate, unless otherwise stated. In the case of light intensity experiments, additional neutral density filters were used to achieve different light intensities (90, 50 and 20%).
Gaseous Product Analysis
The amount of produced CO and H2 was analyzed by headspace gas analysis using a Shimadzu Tracera GC-2010 Plus with a barrier discharge ionization detector. The GC-2010 Plus was equipped with a ShinCarbon micro ST column (0.53 mm diameter) kept at 40 °C using helium carrier gas. Aliquots of 50 or 100 μL of the headspace gas were removed from the sealed photocatalytic vials using a gastight syringe (Hamilton) for GC analysis at hourly time intervals. Data are presented as mean ± standard error of the mean and were calculated from a number of repeats of independent experiments. No formate was detected using 1H NMR and ion chromatography. Photocatalytically generated methane was not detected, and this was confirmed by carrying out experiments with CO2 gas without any internal standard CH4. Then, after photocatalysis, the headspace gas was analyzed using GC.
Isotopic Labeling Experiment
Photocatalysis experiments in 0.1 M NaH2PO4 and 0.1 M NaHAsc aqueous solution with 13CO2 as the headspace gas were performed. After 3 h of simulated light irradiation, the vial headspace was transferred to an evacuated gas infrared cell (SpecAc, 10-cm path length, equipped with KBr windows) and a high-resolution transmission spectrum was collected with a Thermo Scientific Nicolet iS50 FT-IR spectrometer.
Quantum Yield Measurements
One-milliliter solutions containing DMPC (100 μM) liposomes made of RuPSL (10 μM) and CoPL (500 nM) were irradiated with monochromatic light (λ = 450 nm), using two different light intensities (I1 = 5.55 and I2 = 11.73 mW cm–2), produced with a solar simulator (LOT LSN 254) equipped with a monochromator (LOT MSH 300). Duplicate experiments were performed for each light intensity, and the averaged values of the produced μmol of CO were utilized to determine ΦCO using eq 1:
| 1 |
where nCO is the moles of photogenerated CO gas, NA is the Avogadro constant in mol–1, h is the Planck constant in J s, c is the speed of light in m s–1, tirr is the irradiation time in s, λ is the monochromatic light wavelength in m, I is the light intensity in J s–1 m–2, and A is the irradiation cross-section in m2. P is the probability of absorbing a photon by the photosensitizer, i.e., 1–10–(Abs@454nm), where due to the high scattering of the DMPC liposomes the absorbance used was calculated employing the bulk concentration of RuPSL (10 μM) and its molar attenuation coefficient (1.35 × 10⁴ M–1 cm–1) in methanol.
Steady-State Emission and Absorption Spectroscopy
Absorption spectra were recorded in 1.0 cm quartz cuvettes on a Cary 50 Bio spectrometer. Steady-state emission spectra were recorded in 1.0 cm quartz cuvettes on a Fluorolog 3 fluorimeter (Horiba) with double grating monochromators and a P928 PMT detector, and before measurements, all solutions were degassed with Ar.
Determination of the RuPS Quenching Constants
For dynamic (diffusional) quenching, the Stern–Volmer equation (eq 2) was applied:49
| 2 |
where I0 and I are emission intensities in the absence and presence of the quencher, while τ0 and τ are emission lifetimes in the absence and presence of the quencher, respectively. KSV is the Stern–Volmer constant, and kq is the second-order rate constant for the quenching reaction.
For static quenching, where the emission intensity from the associated complex can be neglected, the following relation (eq 3) was used:49
| 3 |
where KA is the association constant between the dye and quencher, and I0 and I have the same meaning as in the previous equation. In the case of purely static quenching, the observed lifetime of the unquenched dyes is not affected (τ0 = τ).
Nanosecond Transient Absorption and Emission Measurements
For nanosecond transient absorption and emission measurements, optical excitation was performed by using the third harmonic output of a frequency-doubled Q-switched Nd:YAG laser combined with an OPO to generate 460 nm excitation pulses. For time-resolved spectra and kinetic traces on nano-to-microsecond time scales, a Quanta-Ray Pro series/OPO combination (Spectra-Physics) was used to give 460 nm, 8 mJ pulse–1 (in some cases, 20, 30, and 50 mJ pulse–1). The laser was coupled to a LP 920 detection system (Edinburgh Instruments) equipped with a pulsed XBO 450 W xenon Arc Lamp (Osram), which can provide the white light for probing. An iStar CCD camera (Andor Technology) and a LP920-K photomultiplier (PMT) detector connected to a Tektronix TDS 3052 500 MHz 5 GS/s oscilloscope were used for transient signal detection. Transient absorption and emission data were acquired using LP 900 software and processed using Origin 2018 software. For kinetic traces on milli-second time scales and above, a Quantel, Brilliant B laser with Opotek OPO was used to provide 460 nm, 15 mJ pulses. The probe light was single wavelength and provided using an un-pulsed 150 W Xe lamp in a flash photolysis spectrometer (Applied Photophysics LKS.60). Two monochromators were used to minimize sample excitation by probe light: the first monochromator was set to the desired detection wavelength before reaching the sample, and the second monochromator was placed after samples. The absorption difference of samples at specified wavelength can be monitored with a PMT Hamamatsu R928 detector and digitized using an Agilent Technologies Infinium digital oscilloscope (600 MHZ). Transient absorption data were acquired within the Applied Photophysics LKS software package. All transient absorption and emission measurements were carried out at room temperature, and a 1.0 cm path length quartz cell cuvette was used for the measurements, and before measurements, all solutions were degassed with Ar.
Fabrication of GCE|Catalyst
Before immobilizing the alkylated catalysts, the GCE surface (diameter = 3.0 mm; area = 0.09 cm2) was cleaned by polishing using 0.015 μm alumina, rinsed with Milli-Q water, followed by sonication in Milli-Q water and acetone for 10 min each solvent, and dried with a N2 stream. The alkylated catalysts were immobilized onto the GC electrodes via dropcasting a known concentration of the catalysts in methanol (MTL) or acetone (MPL), followed by air drying. The concentration of catalysts on the GCE, calculated based on the dropcast volume and concentration of the initial solution, was 1.15 nmol cm–2.
Fabrication of FTO|CoPL
Before immobilizing CoPL, the FTO electrodes were sonicated in acetone and isopropanol for 10 min each and then dried in air overnight. CoPL was immobilized onto FTO by dropcasting 0.4 mL of a 0.2 mM 1:1 acetone/hexane solution of the catalyst and drying in air.
Electrochemistry
CV, SWV, and chronoamperometry measurements were conducted using an Ivium CompactStat potentiostat.
CV and SWV were used to characterize the catalysts in N2- or CO2-saturated 0.2 M TBAPF6 DMF homogeneous solutions at room temperature. A custom-made two compartment H-cell with frit separating the compartments with a three-electrode configuration was employed with airtight compartments. The glassy carbon and Pt mesh were used as working and counter electrodes, respectively, and Ag/AgNO3 (10 mM) was used as the reference electrode. All experiments in DMF are referenced against the ferrocene redox couple [E(Fc0/+) = +0.07 V vs Ag/AgNO3 (10 mM)].
Chronoamperometry measurements of GCE|catalysts and SWV and chronoamperometry measurements of FTO|CoPL were performed in a custom-made three-neck one-compartment cell. A three-electrode configuration was employed, using the GCE|catalyst or FTO|CoPL as the working electrode, Pt mesh as the counter electrode, and Ag/AgCl (KClsat) as the reference electrode (BASi RE-6). The potentials were converted from Ag/AgCl (KClsat) to the standard hydrogen electrode (SHE) by adding +0.199 V. All experiments carried out in aqueous conditions were reported against SHE. The electrolyte solution was 0.1 M NaHCO3 (aq.) (15 mL) and was purged with N2 or CO2 for 30 min to remove atmospheric O2. The pH of the N2- and CO2-saturated 0.1 M NaHCO3 was 8.0 and 6.7, respectively. All chronoamperometry experiments were performed for 4 h, and the applied potential was −1.1 V vs Ag/AgCl (KClsat), i.e., −0.9 V vs SHE, without iR correction. All measurements were performed at room temperature as triplicate for each catalyst, and data are presented as mean ± standard error of the mean. The mean values and standard errors of the mean were calculated from the number of repeats of independent experiments.
In Situ UV–vis–NIR Spectroelectrochemistry
Measurements were conducted in a single-compartment airtight electrochemical cell using N2- or CO2-saturated 0.1 M NaHCO3, and a three-electrode configuration was employed. FTO|CoPL was used as the working electrode, Pt mesh as the counter electrode, and Ag/AgCl (KClsat) as the reference electrode (BASi RE-6). For stepwise chronoamperometry (+0.7 V to −0.9 V vs SHE), the working electrode was kept at each potential for 1 min and the UV–vis–NIR spectra were recorded on an Agilent Cary 60 spectrophotometer using Cary WinUV scanning software. Applied potentials were +0.7, +0.2, +0.1, 0.0, −0.1, −0.2, −0.3, −0.4, −0.5, −0.6, −0.7, −0.8, and −0.9 V vs SHE. Using different electrodes, as the final step, after the stepwise reduction of the film, the potential was switched back to +0.7 V to reoxidize the film. Normalized absorbance values were calculated using eq 4:
| 4 |
In Situ Resonance Raman Spectroelectrochemistry
Raman spectra were obtained using a Renishaw inVia spectrometer. Excitation at 785 nm and collection were via a 20× 0.45 NA objective. Typical laser power was 0.4 mW with 60 s exposure time. SEC experiments were performed using an Autolab PGSTAT204 in a custom-built 3D printed cell using FTO|CoPL as the working electrode, leakless Ag/AgCl as the reference electrode (Green Leaf Scientific), and Pt mesh as the counter electrode. During chronoamperometry, 1 min was allowed at each applied potential step (i.e., +0.7, −0.1, −0.3, −0.5, −0.7, and −0.9 V vs SHE), before spectra were recorded to allow the cell to equilibrate. Spectral analysis was performed with a custom python script. Approximately 10 spectra were recorded per potential on different sample areas, with averaged spectra used for further analysis. Spectra were background-subtracted using a 4th order polynomial estimation method. Difference spectra were calculated from the difference of each spectrum with the first, recorded at +0.7 V vs SHE, using both raw and background-subtracted spectra to ensure that no processing artifacts are introduced by background subtraction. Relative intensity versus potential was calculated as follows. First, characteristic modes for the oxidized and reduced species were selected and confirmed via comparison to DFT calculations. Next, the mode area at each potential, (V), is obtained by integrating spectral intensity. Relative intensity is then calculated using eq 5:
| 5 |
Computational Details
DFT calculations were performed with Gaussian09 (revision D1).50 Geometry optimization, vibrational analysis, and Raman activities were calculated with a 6–31 + G*51,52 basis set for C, H, O, and N and the Stuttgart/Dresden effective core potential (SDD)53,54 for Co, Ni, Fe, and Ru. All the calculations were performed using the uB3LYP55 functional including Grimmes D3 dispersion correction.56 Single-point energy calculations were performed with a 6-311++G(3df,3pd)57,58 basis set for C, H, O, and N and the SDD for Co, Ni, Fe, and Ru. Free energies were calculated from single-point energy calculations and free energy corrections obtained from geometry optimization and vibrational frequency calculation, and a correction to a 1 M standard was applied (1.9 kcal mol–1). Solvent effects for the geometry optimization and single-point calculations were modeled with a PCM solvation model with the dielectric constant of H2O (78.4).59 Various spin states of the intermediates were calculated, and the most stable one was chosen. Electron transfer energies were referenced by the calculated [Ru(bipy)3]2+/[Ru(bipy)3]1+ redox cycle, and proton transfer energies were calculated from the free energy of a free proton in H2O (−272.2 kcal mol–1).60,61
Theoretical Raman spectra were simulated based on the calculated Raman activities for a corresponding frequency according to eq 6:
| 6 |
where υi is the individually i calculated frequency, υ0 is the frequency of the probing light (12738.85 cm–1), h is the Plank constant (6.626·10–34 J s), c is the speed of light (3.00·10–8 m s–1), k is the Boltzmann constant (1.38·10–23 J K–1), T is the temperature (298.15 K), and Si is the DFT-calculated Raman activity for each individually i calculated frequency. A correction factor of 0.96 for the calculated frequencies was applied. For the simulated spectra, a gaussian broadening with a variance of 40 cm–1 was applied to each frequency and all the individual gaussian curves were summed up to obtain the final simulated Raman spectra.
Acknowledgments
The authors thank Dr. Sayan Kar and Dr. Carla Casadevall at the University of Cambridge for helpful discussions. The authors also thank S. Young and N. Howard at the University of Cambridge for performing elemental analyses, D. Matak-Vinkovic at the University of Cambridge for performing mass spectrometry analyses, and Lars Gedda and Katarina Edwards at Uppsala University for performing Cryo TEM measurements, and Dr. Heather Greer at University of Cambridge for performing TEM and EDX measurements (instrument supported by EP/P030467/1). This work was supported by the EU Horizon 2020 Future and Emerging Technologies (FET) Open programme project SoFiA (GAN 828838 to S.R.J., H.S., A.P., S.B., L.H., and E.R.). S.R.J. gratefully acknowledges the European commission for a Horizon 2020 Marie Sklodowska-Curie individual Fellowship (GAN 891338). E.L. is also grateful for the financial support from the Swiss National Science Foundation (Early.Postdoc postdoctoral fellowship: P2EZP2_191791) and a grant from the EPSRC Impact Acceleration Account (ConcSolH2). D.W. and J.J.B. acknowledge support from ERC 883703 PICOFORCE and EPSRC EP/R020965/1 RANT.
Supporting Information Available
The Supporting Information is available free of charge at https://pubs.acs.org/doi/10.1021/jacs.2c01725.
Additional experimental details for the synthesis of the described ligands and metal complexes (including NMR, MS, UV–vis, and IR data), preparation of liposomes, electrochemistry data of all catalysts in organic media and on electrodes, cryogenic transmission electron microscopy of liposomes, photocatalysis results, photoinduced charge-transfer dynamic investigations, UV–vis–NIR and resonance Raman spectroelectrochemistry results for CoPL on FTO, and DFT-calculated Raman spectra, and computed structures (PDF)
XYZ atomic coordinates (ZIP)
Author Present Address
⊥ Institute of Inorganic Chemistry I, Ulm University, Albert-Einstein-Allee 11, 89081 Ulm, Germany (A.P.)
Author Contributions
# S.R.J and H.S. contributed equally.
The authors declare no competing financial interest.
Supplementary Material
References
- Pannwitz A.; Klein D. M.; Rodríguez-Jiménez S.; Casadevall C.; Song H.; Reisner E.; Hammarström L.; Bonnet S. Roadmap towards solar fuel synthesis at the water interface of liposome membranes. Chem. Soc. Rev. 2021, 50, 4833–4855. 10.1039/D0CS00737D. [DOI] [PubMed] [Google Scholar]
- Takayanagi T.; Nagamura T.; Matsuo T. Photoinduced Electron Transfer between Amphipathic Ruthenium(II) Complex and N-Butylphenothiazine in Various Microenvironments. Ber. Bunsen. Phys. Chem. 1980, 84, 1125–1129. 10.1002/bbpc.19800841109. [DOI] [Google Scholar]
- Infelta P. P.; Graetzel M.; Fendler J. H. Aspects of artificial photosynthesis. Photosensitized electron transfer and charge separation in cationic surfactant vesicles. J. Am. Chem. Soc. 1980, 102, 1479–1483. 10.1021/ja00525a001. [DOI] [Google Scholar]
- Hammarström L.; Norrby T.; Stenhagen G.; Mårtensson J.; Åkermark B.; Almgren M. Two-Dimensional Emission Quenching and Charge Separation Using a Ru(II)-Photosensitizer Assembled with Membrane-Bound Acceptors. J. Phys. Chem. B. 1997, 101, 7494–7504. 10.1021/jp9710805. [DOI] [Google Scholar]
- Stikane A.; Hwang E. T.; Ainsworth E. V.; Piper S. E. H.; Critchley K.; Butt J. N.; Reisner E.; Jeuken L. J. C. Towards compartmentalized photocatalysis: multihaem proteins as transmembrane molecular electron conduits. Faraday Discuss. 2019, 215, 26–38. 10.1039/C8FD00163D. [DOI] [PubMed] [Google Scholar]
- Hu H.; Wang Z.; Cao L.; Zeng L.; Zhang C.; Lin W.; Wang C. Metal–organic frameworks embedded in a liposome facilitate overall photocatalytic water splitting. Nat. Chem. 2021, 13, 358–366. 10.1038/s41557-020-00635-5. [DOI] [PubMed] [Google Scholar]
- Grimaldi J. J.; Boileau S.; Lehn J.-M. Light-driven, carrier-mediated electron transfer across artificial membranes. Nature 1977, 265, 229–230. 10.1038/265229a0. [DOI] [PubMed] [Google Scholar]
- Steinberg-Yfrach G.; Rigaud J.-L.; Durantini E. N.; Moore A. L.; Gust D.; Moore T. A. Light-driven production of ATP catalysed by F0F1-ATP synthase in an artificial photosynthetic membrane. Nature 1998, 392, 479–482. 10.1038/33116. [DOI] [PubMed] [Google Scholar]
- Limburg B.; Bouwman E.; Bonnet S. Catalytic photoinduced electron transport across a lipid bilayer mediated by a membrane-soluble electron relay. Chem. Commun. 2015, 51, 17128–17131. 10.1039/C5CC07745A. [DOI] [PubMed] [Google Scholar]
- Schenning A.; Lutje Spelberg J.; Driessen M.; Hauser M.; Feiters M.; Nolte R. Enzyme Mimic Displaying Oscillatory Behavior. Oscillating Reduction of Manganese(III) Porphyrin in a Membrane-Bound Cytochrome P-450 Model System. J. Am. Chem. Soc. 1995, 117, 12655–12656. 10.1021/ja00155a600. [DOI] [Google Scholar]
- Calvin M. Simulating photosynthetic quantum conversion. Acc. Chem. Res. 1978, 11, 369–374. 10.1021/ar50130a001. [DOI] [Google Scholar]
- Steinberg-Yfrach G.; Liddell P. A.; Hung S.-C.; Moore A. L.; Gust D.; Moore T. A. Conversion of light energy to proton potential in liposomes by artificial photosynthetic reaction centres. Nature 1997, 385, 239–241. 10.1038/385239a0. [DOI] [Google Scholar]
- Bhosale S.; Sisson A. L.; Talukdar P.; Fürstenberg A.; Banerji N.; Vauthey E.; Bollot G.; Mareda J.; Röger C.; Würthner F.; Sakai N.; Matile S. Photoproduction of proton gradients with pi-stacked fluorophore scaffolds in lipid bilayers. Science 2006, 313, 84–86. 10.1126/science.1126524. [DOI] [PubMed] [Google Scholar]
- Hansen M.; Li F.; Sun L.; König B. Photocatalytic Water Oxidation at Soft Interfaces. Chem. Sci. 2014, 5, 2683–2687. 10.1039/C4SC01018C. [DOI] [Google Scholar]
- Limburg B.; Wermink J.; van Nielen S. S.; Kortlever R.; Koper M. T. M.; Bouwman E.; Bonnet S. Kinetics of Photocatalytic Water Oxidation at Liposomes: Membrane Anchoring Stabilizes the Photosensitizer. ACS Catal. 2016, 6, 5968–5977. 10.1021/acscatal.6b00151. [DOI] [Google Scholar]
- Troppmann S.; König B. Functionalized Membranes for Photocatalytic Hydrogen Production. Chem. – Eur. J. 2014, 20, 14570–14574. 10.1002/chem.201404480. [DOI] [PubMed] [Google Scholar]
- Troppmann S.; Brandes E.; Motschmann H.; Li F.; Wang M.; Sun L.; König B. Enhanced Photocatalytic Hydrogen Production by Adsorption of an [FeFe]-Hydrogenase Subunit Mimic on Self-Assembled Membranes. Eur. J. Inorg. Chem. 2016, 2016, 554–560. 10.1002/ejic.201501377. [DOI] [Google Scholar]
- Ikuta N.; Takizawa S.-Y.; Murata S. Photochemical reduction of CO2 with ascorbate in aqueous solution using vesicles acting as photocatalysts. Photochem. Photobiol. Sci. 2014, 13, 691–702. 10.1039/C3PP50429H. [DOI] [PubMed] [Google Scholar]
- Klein D. M.; Rodríguez-Jiménez S.; Hoefnagel M. E.; Pannwitz A.; Prabhakaran A.; Siegler M. A.; Keyes T. E.; Reisner E.; Brouwer A. M.; Bonnet S. Shorter Alkyl Chains Enhance Molecular Diffusion and Electron Transfer Kinetics Between Photosensitisers and Catalysts in CO2-Reducing Photocatalytic Liposomes. Chem. – Eur. J. 2021, 27, 17203. 10.1002/chem.202102989. [DOI] [PMC free article] [PubMed] [Google Scholar]
- Kuehnel M. F.; Orchard K. L.; Dalle K. E.; Reisner E. Selective photocatalytic CO2 reduction in water through anchoring of a molecular Ni catalyst on CdS nanocrystals. J. Am. Chem. Soc. 2017, 139, 7217–7223. 10.1021/jacs.7b00369. [DOI] [PubMed] [Google Scholar]
- Zhang X.; Cibian M.; Call A.; Yamauchi K.; Sakai K. Photochemical CO2 Reduction Driven by Water-Soluble Copper(I) Photosensitizer with the Catalysis Accelerated by Multi-Electron Chargeable Cobalt Porphyrin. ACS Catal. 2019, 9, 11263–11273. 10.1021/acscatal.9b04023. [DOI] [Google Scholar]
- Call A.; Cibian M.; Yamamoto K.; Nakazono T.; Yamauchi K.; Sakai K. Highly Efficient and Selective Photocatalytic CO2 Reduction to CO in Water by a Cobalt Porphyrin Molecular Catalyst. ACS Catal. 2019, 9, 4867–4874. 10.1021/acscatal.8b04975. [DOI] [Google Scholar]
- Wang Q.; Warnan J.; Rodríguez-Jiménez S.; Leung J. J.; Kalathil S.; Andrei V.; Domen K.; Reisner E. Molecularly engineered photocatalyst sheet for scalable solar formate production from carbon dioxide and water. Nat. Energy 2020, 5, 703–710. 10.1038/s41560-020-0678-6. [DOI] [Google Scholar]
- Zhang X.; Yamauchi K.; Sakai K. Earth-Abundant Photocatalytic CO2 Reduction by Multielectron Chargeable Cobalt Porphyrin Catalysts: High CO/H2 Selectivity in Water Based on Phase Mismatch in Frontier MO Association. ACS Catal. 2021, 10436–10449. 10.1021/acscatal.1c02475. [DOI] [Google Scholar]
- Arcudi F.; Đorđević L.; Nagasing B.; Stupp S. I.; Weiss E. A. Quantum Dot-Sensitized Photoreduction of CO2 in Water with Turnover Number > 80,000. J. Am. Chem. Soc. 2021, 143, 18131–18138. 10.1021/jacs.1c06961. [DOI] [PubMed] [Google Scholar]
- Mondal B.; Rana A.; Sen P.; Dey A. Intermediates Involved in the 2e–/2H+ Reduction of CO2 to CO by Iron(0) Porphyrin. J. Am. Chem. Soc. 2015, 137, 11214–11217. 10.1021/jacs.5b05992. [DOI] [PubMed] [Google Scholar]
- Reuillard B.; Ly K. H.; Rosser T. E.; Kuehnel M. F.; Zebger I.; Reisner E. Tuning Product Selectivity for Aqueous CO2 Reduction with a Mn(bipyridine)-pyrene Catalyst Immobilized on a Carbon Nanotube Electrode. J. Am. Chem. Soc. 2017, 139, 14425–14435. 10.1021/jacs.7b06269. [DOI] [PMC free article] [PubMed] [Google Scholar]
- Leung J. J.; Warnan J.; Ly K. H.; Heidary N.; Nam D. H.; Kuehnel M. F.; Reisner E. Solar-driven reduction of aqueous CO2 with a cobalt bis(terpyridine)-based photocathode. Nat. Catal. 2019, 2, 354–365. 10.1038/s41929-019-0254-2. [DOI] [Google Scholar]
- Guo Z.; Chen G.; Cometto C.; Ma B.; Zhao H.; Groizard T.; Chen L.; Fan H.; Man W.-L.; Yiu S.-M.; Lau K.-C.; Lau T.-C.; Robert M. Selectivity control of CO versus HCOO– production in the visible-light-driven catalytic reduction of CO2 with two cooperative metal sites. Nat. Catal. 2019, 2, 801–808. 10.1038/s41929-019-0331-6. [DOI] [Google Scholar]
- Fernández S.; Franco F.; Casadevall C.; Martin-Diaconescu V.; Luis J. M.; Lloret-Fillol J. A Unified Electro- and Photocatalytic CO2 to CO Reduction Mechanism with Aminopyridine Cobalt Complexes. J. Am. Chem. Soc. 2020, 142, 120–133. 10.1021/jacs.9b06633. [DOI] [PubMed] [Google Scholar]
- Lu X.; Ahsaine H. A.; Dereli B.; Garcia-Esparza A. T.; Reinhard M.; Shinagawa T.; Li D.; Adil K.; Tchalala M. R.; Kroll T.; Eddaoudi M.; Sokaras D.; Cavallo L.; Takanabe K. Operando Elucidation on the Working State of Immobilized Fluorinated Iron Porphyrin for Selective Aqueous Electroreduction of CO2 to CO. ACS Catal. 2021, 11, 6499–6509. 10.1021/acscatal.1c01157. [DOI] [Google Scholar]
- Amanullah S.; Saha P.; Dey A. Activating the Fe(I) State of Iron Porphyrinoid with Second-Sphere Proton Transfer Residues for Selective Reduction of CO2 to HCOOH via Fe(III/II)–COOH Intermediate(s). J. Am. Chem. Soc. 2021, 143, 13579–13592. 10.1021/jacs.1c04392. [DOI] [PubMed] [Google Scholar]
- Elgrishi N.; Chambers M. B.; Artero V.; Fontecave M. Terpyridine complexes of first row transition metals and electrochemical reduction of CO2 to CO. Phys. Chem. Chem. Phys. 2014, 16, 13635–13644. 10.1039/C4CP00451E. [DOI] [PubMed] [Google Scholar]
- Araullo-McAdams C.; Kadish K. M. Electrochemistry, spectroscopy, and reactivity of (meso-tetrakis(1-methylpyridinium-4-yl)porphinato)cobalt(III,II,I) in nonaqueous media. Inorg. Chem. 1990, 29, 2749–2757. 10.1021/ic00340a009. [DOI] [Google Scholar]
- Hansen M.; Troppmann S.; König B. Artificial Photosynthesis at Dynamic Self-Assembled Interfaces in Water. Chem. – Eur. J. 2016, 22, 58–72. 10.1002/chem.201503712. [DOI] [PubMed] [Google Scholar]
- Edwardes Moore E.; Cobb S. J.; Coito A. M.; Oliveira A. R.; Pereira I. A. C.; Reisner E. Understanding the local chemical environment of bioelectrocatalysis. Proc. Natl. Acad. Sci. U. S. A. 2022, 119, e2114097119 10.1073/pnas.2114097119. [DOI] [PMC free article] [PubMed] [Google Scholar]
- Hawecker J.; Lehn J.-M.; Ziessel R. Photochemical reduction of carbon dioxide to formate mediated by ruthenium bipyridine complexes as homogeneous catalysts. J. Chem. Soc., Chem. Commun. 1985, 56–58. 10.1039/c39850000056. [DOI] [Google Scholar]
- Grant J. L.; Goswami K.; Spreer L. O.; Otvos J. W.; Calvin M. Photochemical reduction of carbon dioxide to carbon monoxide in water using a nickel(II) tetra-azamacrocycle complex as catalyst. J. Chem. Soc., Dalton Trans. 1987, 2105–2109. 10.1039/dt9870002105. [DOI] [Google Scholar]
- Nakada A.; Koike K.; Nakashima T.; Morimoto T.; Ishitani O. Photocatalytic CO2 Reduction to Formic Acid Using a Ru(II)–Re(I) Supramolecular Complex in an Aqueous Solution. Inorg. Chem. 2015, 54, 1800–1807. 10.1021/ic502707t. [DOI] [PubMed] [Google Scholar]
- Arias-Rotondo D. M.; McCusker J. K. The photophysics of photoredox catalysis: a roadmap for catalyst design. Chem. Soc. Rev. 2016, 45, 5803–5820. 10.1039/C6CS00526H. [DOI] [PubMed] [Google Scholar]
- Lomoth R.; Häupl T.; Johansson O.; Hammarström L. Redox-Switchable Direction of Photoinduced Electron Transfer in an Ru(bpy)32+–Viologen Dyad. Chem. – Eur. J. 2002, 8, 102–110. . [DOI] [PubMed] [Google Scholar]
- Hu X.-M.; Rønne M. H.; Pedersen S. U.; Skrydstrup T.; Daasbjerg K. Enhanced Catalytic Activity of Cobalt Porphyrin in CO2 Electroreduction upon Immobilization on Carbon Materials. Angew. Chem., Int. Ed. 2017, 56, 6468–6472. 10.1002/anie.201701104. [DOI] [PubMed] [Google Scholar]
- Ogawa M.; Ajayakumar G.; Masaoka S.; Kraatz H.-B.; Sakai K. Platinum(II)-Based Hydrogen-Evolving Catalysts Linked to Multipendant Viologen Acceptors: Experimental and DFT Indications for Bimolecular Pathways. Chem. – Eur. J. 2011, 17, 1148–1162. 10.1002/chem.201002470. [DOI] [PubMed] [Google Scholar]
- Götz R.; Ly H. K.; Wrzolek P.; Schwalbe M.; Weidinger I. M. Surface enhanced resonance Raman spectroscopy of iron Hangman complexes on electrodes during electrocatalytic oxygen reduction: advantages and problems of common drycast methods. Dalton Trans. 2017, 46, 13220–13228. 10.1039/C7DT01174A. [DOI] [PubMed] [Google Scholar]
- Terekhov S. N.; Kruglik S. G.; Malinovskii V. L.; Galievsky V. A.; Chirvony V. S.; Turpin P.-Y. Resonance Raman characterization of cationic Co(II) and Co(III) tetrakis(N-methyl-4-pyridinyl)porphyrins in aqueous and non-aqueous media. J. Raman. Spectrosc. 2003, 34, 868–881. 10.1002/jrs.1068. [DOI] [Google Scholar]
- Orendorff C. J.; Ducey M. W. Jr.; Pemberton J. E. Quantitative Correlation of Raman Spectral Indicators in Determining Conformational Order in Alkyl Chains. J. Phys. Chem. A 2002, 106, 6991–6998. 10.1021/jp014311n. [DOI] [PubMed] [Google Scholar]
- Liu B.; Blaszczyk A.; Mayor M.; Wandlowski T. Redox-Switching in a Viologen-type Adlayer: An Electrochemical Shell-Isolated Nanoparticle Enhanced Raman Spectroscopy Study on Au(111)-(1×1) Single Crystal Electrodes. ACS Nano 2011, 5, 5662–5672. 10.1021/nn201307g. [DOI] [PubMed] [Google Scholar]
- Almgren M.; Edwards K.; Karlsson G. Cryo transmission electron microscopy of liposomes and related structures. Colloids Surf. A Physicochem. Eng. Asp. 2000, 174, 3–21. 10.1016/S0927-7757(00)00516-1. [DOI] [Google Scholar]
- Lakowicz J. R.Principles of fluorescence spectroscopy; Springer: Boston, MA, 2006. [Google Scholar]
- Frisch M. J., Trucks G. W., Schlegel H. B., Scuseria G. E., Robb M. A., Cheeseman J. R., Scalmani G., Barone V., Mennucci B., Petersson G. A., Nakatsuji H., Caricato M., Li X., Hratchian H. P., Izmaylov A. F., Bloino J., Zheng G., Sonnenberg J. L., Hada M., Ehara M., Toyota K., Fukuda R., Hasegawa J., Ishida M., Nakajima T., Honda Y., Kitao O., Nakai H., Vreven T., Montgomery J. J. A., Peralta J. E., Ogliaro F., Bearpark M., Heyd J. J., Brothers E., Kudin K. N., Staroverov V. N., Kobayashi R., Normand J., Raghavachari K., Rendell A., Burant J. C., Iyengar S. S., Tomasi J., Cossi M., Rega N., Millam J. M., Klene M., Knox J. E., Cross J. B., Bakken V., Adamo C., Jaramillo J., Gomperts R., Stratmann R. E., Yazyev O., Austin A. J., Cammi R., Pomelli C., Ochterski J. W., Martin R. L., Morokuma K., Zakrzewski V. G., Voth G. A., Salvador P., Dannenberg J. J., Dapprich S., Daniels A. D., Farkas Ö., Fore J. B., Cioslowski J.; Fox D. J.. Gaussian 09, Revision D.01; Gaussian, Inc.: Wallingford, CT, 2009. [Google Scholar]
- Rassolov V. A.; Ratner M. A.; Pople J. A.; Redfern P. C.; Curtiss L. A. 6-31G* basis set for third-row atoms. J. Comput. Chem. 2001, 22, 976–984. 10.1002/jcc.1058. [DOI] [Google Scholar]
- Francl M. M.; Pietro W. J.; Hehre W. J.; Binkley J. S.; Gordon M. S.; DeFrees D. J.; Pople J. A. Self-consistent molecular orbital methods. XXIII. A polarization-type basis set for second-row elements. J. Chem. Phys. 1982, 77, 3654–3665. 10.1063/1.444267. [DOI] [Google Scholar]
- Dolg M.; Wedig U.; Stoll H.; Preuss H. Energy-adjusted ab initio pseudopotentials for the first row transition elements. J. Chem. Phys. 1987, 86, 866–872. 10.1063/1.452288. [DOI] [Google Scholar]
- Andrae D.; Häußermann U.; Dolg M.; Stoll H.; Preuß H. Energy-adjusted ab initio pseudopotentials for the second and third row transition elements. Theor. Chim. Acta 1990, 77, 123–141. 10.1007/BF01114537. [DOI] [Google Scholar]
- Becke A. D. Density-functional thermochemistry. III. The role of exact exchange. J. Chem. Phys. 1993, 98, 5648–5652. 10.1063/1.464913. [DOI] [Google Scholar]
- Grimme S.; Antony J.; Ehrlich S.; Krieg H. A consistent and accurate ab initio parametrization of density functional dispersion correction (DFT-D) for the 94 elements H-Pu. J. Chem. Phys. 2010, 132, 154104. 10.1063/1.3382344. [DOI] [PubMed] [Google Scholar]
- Krishnan R.; Binkley J. S.; Seeger R.; Pople J. A. Self-consistent molecular orbital methods. XX. A basis set for correlated wave functions. J. Chem. Phys. 1980, 72, 650–654. 10.1063/1.438955. [DOI] [Google Scholar]
- McLean A. D.; Chandler G. S. Contracted Gaussian basis sets for molecular calculations. I. Second row atoms, Z=11–18. J. Chem. Phys. 1980, 72, 5639–5648. 10.1063/1.438980. [DOI] [Google Scholar]
- Miertuš S.; Scrocco E.; Tomasi J. Electrostatic interaction of a solute with a continuum. A direct utilization of AB initio molecular potentials for the prevision of solvent effects. Chem. Phys. 1981, 55, 117–129. 10.1016/0301-0104(81)85090-2. [DOI] [Google Scholar]
- Kelly C. P.; Cramer C. J.; Truhlar D. G. Aqueous Solvation Free Energies of Ions and Ion–Water Clusters Based on an Accurate Value for the Absolute Aqueous Solvation Free Energy of the Proton. J. Phys. Chem. B. 2006, 110, 16066–16081. 10.1021/jp063552y. [DOI] [PubMed] [Google Scholar]
- Casasnovas R.; Ortega-Castro J.; Frau J.; Donoso J.; Muñoz F. Theoretical pKa calculations with continuum model solvents, alternative protocols to thermodynamic cycles. Int. J. Quantum Chem. 2014, 114, 1350–1363. 10.1002/qua.24699. [DOI] [Google Scholar]
Associated Data
This section collects any data citations, data availability statements, or supplementary materials included in this article.