

Abstract
Vitamin D compounds are a group of secosteroids derived from cholesterol that are vital for maintaining bone health in humans. Recent studies have shown extraskeletal effects of vitamin D, involving vitamin D metabolites such as the dihydroxylated vitamin D3 compounds 1,25-dihydroxyvitamin D3 and 24,25-dihydroxyvitamin D3. Differentiation and characterization of these isomers by mass spectrometry can be challenging due to the zero-mass difference and minor structural differences between them. The isomers usually require separation by liquid chromatography (LC) prior to mass spectrometry, which adds extra complexity to the analysis. Herein, we investigated and revisited the use of fragmentation methods such as collisional induced dissociation (CID), infrared multiphoton dissociation (IRMPD), electron induced dissociation (EID), and ultraviolet photodissociation (UVPD), available on a 12T Fourier transform ion cyclotron resonance mass spectrometer (FT-ICR MS) to generate characteristic fragments for the dihydroxylated vitamin D3 isomers that can be used to distinguish between them. Isomer-specific fragments were observed for the 1,25-dihydroxyvitamin D3, which were clearly absent in the 24,25-dihydroxyvitamin D3 MS/MS spectra using all fragmentation methods mentioned above. The fragments generated due to cleavage of the C-6/C-7 bond in the 1,25-dihydroxyvitamin D3 compound demonstrate that the fragile OH groups were retained during fragmentation, thus enabling differentiation between the two dihydroxylated vitamin D3 isomers without the need for prior chromatographic separation or derivatization.
Introduction
Vitamin D compounds comprise a class of fat-soluble secosteroids exhibiting some biological activity. Vitamin D3 (VD3) is primarily formed in the skin of mammals via photosynthesis, and it is widely known to regulate the amount of important minerals such as phosphate and calcium in the body.1 These nutrients are needed to keep bones, teeth, and muscles healthy. A lack of vitamin D3 can lead to bone deformities such as rickets in young children and bone pain in adults resulting in osteoporosis, a condition where the bone weakens and becomes brittle.2−5 It has also been linked to various other diseases such as diabetes, heart disease, and neurological disorders such as Alzheimer’s disease and schizophrenia.6−9
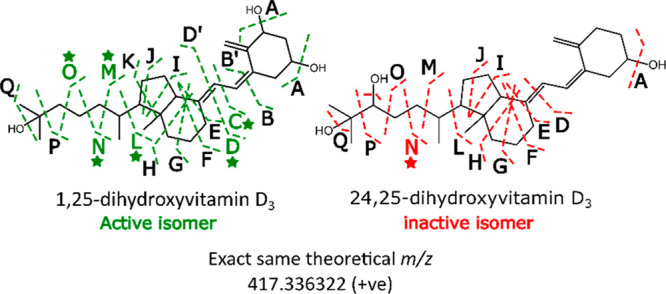
The metabolic pathway of vitamin D3 is illustrated by Figure 1. Vitamin D3 (cholecalciferol) is made in the skin from 7-dehydrocholesterol (7-DHC) under the influence of UV light (290–315 nm, UVB) from the sun.1,10 It metabolizes first to 25-hydroxyvitamin D3 (25(OH)D3) in the liver and is then further oxidized to the biologically active compound 1,25-dihydroxyvitamin D3 (1,25(OH)2D3).10−17 During catabolism of vitamin D3, 24,25-dihydroxyvitamin D3 is formed, which is usually considered to be inactive. However, there are some studies that show that this metabolite may have some biological activity of its own.18−21 For example, in 1982, Sömjen et al.22 found that 24,25(OH)2D3 may play a role in the metabolism of developing skeletal tissues of newborn mice, and Seo et al.23 showed that increased levels of 24,25(OH)2D3 levels in the serum may be correlated with the healing of tibial fractures in chicks.
Figure 1.

Pathway for vitamin D metabolism with the highlighted OH groups to emphasize the difference in structures of the dihydroxylated isomers. Redrawn and adapted from ref (25).
The most abundant metabolite 25(OH)D3 is commonly used as a marker compound for vitamin D status because of its high concentration levels and because of its direct link to the vitamin D substrate. Using the active compound 1,25(OH)2D3 as a biomarker for vitamin D3 sufficiency is difficult as its half-life is only a few hours and its concentration levels are very low.24
Currently, immunoassays26,27 and liquid chromatography–tandem mass spectrometry (LC-MS/MS)28,29 are commonly used for detecting and determining the levels of vitamin D metabolites in humans. Immunoassays can take time as only one metabolite can be measured per assay so the selectivity, accuracy, and reproducibility may suffer as a result. LC–MS/MS assays, however, provide better selectivity, sensitivity, and reproducibility and are highly considered as one of the main techniques for the analysis of vitamin D metabolites, specifically including the separation of vitamin d isomers, which is usually carried out in the LC domain.30−35 However, due to the low abundance of certain metabolites such as 1,25(OH)2D3 and the complex matrices they are detected in such as human serum, qualitative and quantitative analyses can be difficult due to isobaric and isomeric interferences that can arise from biological fluids.36
Vitamin D metabolites have also been analyzed using gas chromatography–mass spectrometry (GC–MS), but the metabolites tend to require some modification or derivatization using agents such as trimethylsilyl (TMS).37,38 For LC–MS, derivatization reagents such as 4-phenyl-1,2,4-triazoline-3,5-dione (PTAD)39−41 or Amplifex42 have been used to improve the ionization efficiency of the vitamin D compounds and to also decrease isobaric interference levels coming from the media, e.g., serum by shifting the m/z range of the vitamin D metabolites to higher values.43 However, this adds an additional step to the sample preparation and may require the data to be interpreted more carefully.
Recently, MS methods have been further developed to differentiate between isomeric and epimeric vitamin D3 metabolites. For example, Qi et al.44 implemented a matrix-assisted laser desorption ionization–collision induced dissociation (MALDI–CID) method after ion activation of reactive analyte/matrix adducts to distinguish between dihydroxyvitamin D3 isomers (1,25(OH)2D3 and 24,25(OH)2D3).44 The CID MS/MS spectra of the reactive matrix (1,5 diaminonaphthalene)/dihydroxyvitamin D3 adducts formed during MALDI produced isomer-diagnostic fragment ions because the fragile OH groups were preserved during dissociation of the C-6/C-7 bond.44 As there were differences in the locations of the −OH groups, different product ions were obtained. Chouinard et al.45 tested the separation capabilities of ion mobility–mass spectrometry (IMS-MS) to distinguish between the gas-phase conformations of 25(OH)D3 epimers with the aid of theoretical modeling of the epimers.45,46 These developments have encouraged utilization of different mass spectrometry techniques to further characterize and elucidate the structures of vitamin D metabolites.
In this work, we investigated the use of a 12 T Fourier transform ion cyclotron resonance mass spectrometer (FT-ICR MS), equipped with various fragmentation methods to enable differentiation of the two dihydroxylated vitamin D3 isomers, without the need for prior chromatographic separation or derivatization of the samples. Slow heating fragmentation methods such as CID were revisited. Photodissociation methods such as IRMPD and UVPD MS/MS and electron mediated fragmentation techniques such as EID were also explored. Dehydrations were observed in the spectra using all methods and the fragments corresponding to the consecutive losses of the three water molecules were by far the most abundant. The MS/MS spectra were also equally dense due to the series of hydrocarbon chain decompositions. However, using all fragmentation methods, multiple diagnostic fragments were observed for the active metabolite, 1,25(OH)2D3, showing the retention of the fragile OH groups, whereas the characteristic fragments of 1,25(OH)2D3 were clearly absent for the 24,25(OH)2D3 isomer.
Experimental Section
Chemicals
Solvent-evaporated standards of 1,25(OH)2D3 (15 μg) and 24,25(OH)2D3 (10 μg) were provided by the Volmer group from Humboldt University of Berlin, Germany. Ultrapure water was obtained using a Millipore (Merck Millipore, MA) Direct-Q Milli-Q UV III purification system (18.2 Ω). LC–MS grade methanol (≥99.9%) was purchased from VWR Chemicals (Germany), and formic acid was purchased from Honeywell Fluka (Germany). The samples were prepared to stock solutions of 36 μM for dihydroxylated vitamin D3 isomers in methanol, which were then stored in the −80 °C freezer. Final samples were diluted with water/methanol (50:50, v/v) with 1% v/v formic acid into concentrations of 1–10 μM for MS, CID, IRMPD, EID, and UVPD MS/MS experiments.
Mass Spectrometry
A 12 T (T) SolariX Fourier transform ion cyclotron resonance mass spectrometer (FTICR MS; Bruker Daltonik GmbH, Bremen, Germany) equipped with an actively shielded superconducting magnet was used for the experiments. Mass spectra were acquired with four mega data points (32 bit per point) over a mass range of m/z 98.2–1000 to produce a 1.12 s transient and ∼300,000 resolving power at m/z 400.
The samples were analyzed using a homemade nanoelectrospray ion source in positive ionization mode. Ions were externally accumulated in a hexapole collision cell for 0.5 s before they were transferred to the ICR analyzer cell for MS detection.
For all MS/MS experiments, the protonated molecules were isolated using the quadrupole mass filter with an isolation window of 5 m/z. For CID MS/MS after mass isolation of the precursor ion, argon was used as the collision gas and the resulting fragments were accumulated in the collision cell. The collision energy was optimized to 10 V.
A 25 W continuous wave CO2 laser (Synrad, Mukilteo, WA) was employed for the IRMPD MS/MS experiments with an output wavelength of 10.6 μm, pulse length of 0.1 s, and 50% laser power.
For the EID MS/MS experiments, the quadrupole isolated ions were accumulated in the hexapole for 1 s. Isolated ions of interest were transferred and trapped in the ICR cell. The trapped ions were then irradiated by electrons from a 1.5 A indirectly heated hollow dispenser cathode. The EID parameters used were a pulse length of 0.4 V, cathode bias of 19 V and extraction lens voltage of 3 V.
For the ultraviolet photodissociation experiments (UVPD), a 193 nm ArF excimer laser beam (10 Hz, Coherent, UK) was introduced into the back of the ICR cell of the instrument through a BaF2 window, and ions stored in the cell were irradiated with five laser shots (5 mJ/pulse at the laser head). No hardware modifications were required due to the pre-existing IRMPD setup which allowed simple alignment of the UV laser.
A stable telescopic compact high energy Q-switched pulsed Nd:YAG laser with an output wavelength of 213 nm (fifth harmonic of the Nd:YAG laser) (10 Hz; Litron Lasers, UK) was also used for UVPD, and ions were irradiated with 10 laser shots (∼1.5 mJ/pulse at the laser head).
All spectra were internally calibrated, manually interpreted and assigned via DataAnalysis 4.3 software (Bruker Daltonik, GmbH, Bremen, Germany) to achieve subppm accuracy for all assigned fragments in the MS and MS/MS spectra.
Results and Discussion
Full MS analysis of the dihydroxylated vitamin D3 isomers showed that the protonated molecule for both isomers was present at the same m/z, demonstrating that it is not possible to differentiate between the isomers simply based on the mass spectra (Figure S1). As illustrated in Figure 2, three major peaks were clearly identified in all of the MS/MS spectra, corresponding to initial dehydrations (loss of H2O). This was also observed in the MS confirming the fragile nature of the OH groups of the isomeric species. Schorr et al. have recently shown that H2O loss from the protonated OH group at C-3 or C-25 only requires activation energies of 10–15 kcal·mol–1.47 A homologous series of hydrocarbon losses (−CH2) resulting from direct carbon–carbon (C–C) cleavages were also observed in all the fragmentation spectra. These fragments contribute to the complex spectra and provide no structural information or any isomer-specific fragments for the species analyzed.
Figure 2.

CID spectra with inserts of m/z 100–350 regions with fragment peaks labeled of (a) 1,25(OH)2D3 and (b) 24,25(OH)2D3. Structure-specific fragments are denoted by the star symbol.
In previous studies, the use of CID for vitamin D3 compounds resulted in complex spectra often accompanied by limited structural information.36,48 Some of the other issues noted for these fat-soluble compounds including the lack of ionizable groups as well as analysis of these metabolites in complex matrices such as serum can be difficult, as the compounds are already present in low levels and interference from other species present in the matrices can contribute to the ion suppression for the vitamin D3 compounds such as 1,25(OH)2D3. Hence, these experiments are primarily tested on the provided standards of the VD3 isomers as a basis for method development for differentiation of the isomers using the available MS/MS methods.
As mentioned for the CID MS/MS spectra shown in Figure 2, the same observations can be made for the IRMPD, EID, and UVPD MS/MS spectra obtained (Figures S3–S6), which also present the significant water losses and the series of intense fragment peaks resulting from the hydrocarbon (−CH2) losses.
After collision energy optimization and on closer inspection and analysis of the MS/MS spectra, diagnostic fragments were detected for 1,25(OH)2D3, which were absent in the 24,25(OH)2D3 MS/MS spectra. An example of this is shown in Figure 3, observed for both CID and IRMPD (also observed with the other MS/MS methods), where the detected fragment at m/z 139.07 in the spectrum for 1,25(OH)2D3 was present, while it was absent in the 24,25(OH)2D3 MS/MS spectrum. This indicates that the fragile OH groups can be preserved during dissociation for one isomer but not for the other. This may be due to a difference in the energetics between both isomers as 24,25(OH)2D3; however, this is under strong consideration as the structural difference between both isomers is minor since the only difference is that 24,25(OH)2D3 has only one OH group on the A ring whereas 1,25(OH)2D3 has two OH groups on the A ring. On the other hand, Schorr et al.47 have recently demonstrated significant structural and energetic differences between the 25(OH)D3 epimers, which only differ in the stereochemical orientation of the C-3 hydroxyl group, due to differences in intramolecular H-bonding.
Figure 3.

Zoom in of m/z 139.0–139.2 region of (a) CID MS/MS spectra and (b) IRMPD MS/MS spectra of 1,25(OH)2D3 and 24,25(OH)2D3 showing 1,25(OH)2D3-specific fragment C. An 8-fold improvement in the S/N is also noted for the diagnostic fragment C using IRMPD MS/MS compared to CID MS/MS.
It is also noted that the signal of the protonated molecule in the 1,25(OH)2D3 CID MS/MS spectra is higher in intensity and, thus more stable compared to the signal of the protonated molecule in the 24,25(OH)2D3 CID MS/MS spectra (Figure 2) as well as the IRMPD, UVPD, and EID spectra (Figures S3–S6). This observation may also provide some insight as to why the characteristic fragments obtained for 1,25(OH)2D3 demonstrate the retention of either one or both OH groups on the compounds, which was not possible for the 24,25(OH)2D3 isomer.
For each MS/MS method, the parameters required for fragmentation optimization were tuned, and up to 100 scans were accumulated to ensure that the characteristic fragments observed for the 1,25(OH)2D3 spectra were absent for 24,25(OH)2D3 spectra. This included optimization of the collision energy for CID MS/MS experiments, the pulse length for ion interaction with IR or UV photons for both IRMPD and UVPD MS/MS, as well as the bias voltage, which is responsible for the energy of the electrons for the EID MS/MS experiments. Figure 4 shows how the optimization of the collision energy was necessary for the detection of one of the characteristic fragments of 1,25(OH)2D3, which appeared to be absent when a collision energy of 5 V was applied but present when the optimized collision energy of 10 V was used.
Figure 4.

m/z scale expansions of the region m/z 152.05–152.10 from the CID MS/MS spectra of 1,25-dihydroxyvitamin D3 after collision energy optimization.
The internal calibration of all fragmentation spectra (included in this work and in the Supporting Information) resulted in subppm mass accuracy assignment errors. Assignments were made with high confidence as the following criteria were followed closely. For example, all product ions and, in particular, the characteristic fragments for the differentiation between the isomers, were checked manually, based on low mass errors (<1 ppm) as well ensuring that the exact mass calculation and simulation of each characteristic fragment matched with the observed fragment in the MS/MS spectra obtained. It is important to have subppm mass assignments for the fragments as multiple assignments are possible; hence, it is also necessary to accompany this with the exact mass calculation and simulation of the assigned elemental formulas as shown in Figure 5a,b.
Figure 5.

m/z scale expansions of IRMPD spectra obtained of (a) m/z 123.0–123.2 and (b) m/z 139.0–142.2 for the IRMPD fragment ions of 1,25(OH)2D3 (top traces) and 24,25(OH)2D3 (middle traces). The exact mass calculation and simulation of the assigned elemental formulas with chemical structures are shown in the bottom trace.
Multiple diagnostic fragments for 1,25(OH)2D3 were detected as shown in Table 1. The table displays the main characteristic fragments detected in the 1,25(OH)2D3 spectra, which were definitively absent in the 24,25(OH)2D3 MS/MS spectra using the various MS/MS methods available. This was shown only for the 1,25(OH)2D3 isomer as this metabolite had fragments that were also generated for 24,25(OH)2D3 due to the fragile OH groups on the A ring and the side chain of the molecule. The assignment of the diagnostic fragments corresponds to the assigned cleavages of the 1,25(OH)2D3 compound; e.g., fragment “AD” refers to bonds “A” and “D” broken in the 1,25(OH)2D3 compound, as shown by the cleavage diagram in Figure 2.
Table 1. Fragmentation Table for Characteristic Fragments, Where One or Both OH Groups Are Retained on the Ring for 1,25(OH)2D3 and Are Absent in the 24,25(OH)2D3 Spectraa.
| fragmentation
method |
|||||||||||
|---|---|---|---|---|---|---|---|---|---|---|---|
| CAD |
IRMPD |
EID |
193
nm UVPD |
213
nm UVPD |
|||||||
| 1,25(OH)2D3 characteristic theoretical fragment(m/z) | assignment | intensity | S/N | intensity | S/N | intensity | S/N | intensity | S/N | intensity | S/N |
| 109.064791 | AB | X | X | X | X | medium | 18.1 | medium | 53.6 | medium | 58 |
| 127.075356 | B | X | X | high | 231.5 | medium | 18.9 | low | 23.1 | low | 42 |
| 135.080441 | AD | high | 346.4 | high | 639.4 | high | 106.7 | high | 585.7 | high | 507 |
| 139.075356 | C | low | 26.8 | high | 224.3 | medium | 12.6 | low | 29.5 | low | 27.1 |
| 147.080441 | AE | low | 20 | low | 27.7 | low | 21.2 | medium | 40.9 | low | 40.6 |
| 152.083181 | D | low | 30.8 | medium | 63.6 | high | 42.2 | medium | 36.9 | low | 24.7 |
| 165.091006 | E | low | 44.2 | medium | 70.2 | low | 12.8 | low | 14.7 | low | 12.2 |
| 287.200557 | L | high | 390.1 | high | 423.9 | medium | 198.7 | high | 141.2 | low | 25.3 |
| 315.231857 | M | high | 27.2 | medium | 77.6 | low | 39.6 | medium | 38.3 | low | 9.2 |
| 329.247507 | N | low | 128.1 | low | 26.5 | low | 12.1 | low | 15.8 | X | X |
| 343.263157 | O | high | 493.1 | medium | 67.6 | low | 53.3 | medium | 36.9 | X | X |
| 357.278807 | P | medium | 78 | low | 16.7 | X | X | X | X | X | X |
Testing all of the available fragmentation methods presents an opportunity for comparison of the suitability of each method for qualitative and quantitative analysis. Depending on the MS/MS method used, the metabolites may undergo a different fragmentation pathway, resulting in secondary fragmentation, improvement in the number of diagnostic fragments detected, or an improvement in the relative intensities of those diagnostic fragments. This is summarized in Table 1, and the relative intensity range used to designate the fragment intensity levels for the characteristic fragments of 1,25(OH)2D3 is provided in Table 2.
Table 2. Table Showing the Relative Intensity Range Used to Designate the Fragment Intensity Levels for the Characteristic Fragments of 1,25(OH)2D3.
| fragment intensity level | intensity range |
|---|---|
| low | 1 × 10⁶ – 5 × 10⁶ |
| medium | 5 × 10⁶ – 1 × 10⁷ |
| high | >1 × 10⁷ |
As shown by Table 1, the same main characteristic fragments (except for fragment B) were observed in the CID and IRMPD MS/MS spectra of 1,25(OH)2D3, but an improvement in the intensities and S/N of those same fragments was also observed with IRMPD MS/MS. With EID, however, the relative intensity of the diagnostic and nondiagnostic fragments was overall lower compared to both CID and IRMPD, yet complementary structural information was obtained with EID and an additional diagnostic fragment at m/z 109.06 (AB) was also observed. EID uses higher energy electrons and is a radical-based process, and these reasons may contribute to complexity of the EID spectra obtained and the presence of the additional fragment observed.
Compared to IRMPD, UVPD is a higher energy activation method based on the absorption of UV photons by the analyte ions, which is possible due to the UV chromophore properties of the C–C double bonds present in the 5,6-cis-triene system of the vitamin D compounds. The structural information obtained with 193 nm UVPD for the dihydroxylated vitamin D3 compounds also compared well with the MS/MS data obtained with CID, IRMPD, and EID MS/MS. This observation may be supported by a combination of the previously proposed UVPD mechanisms; direct dissociation (electronic excitation or relaxation into a dissociative orbital, like that of electron-based fragmentation methods e.g., EID) and internal conversion (internal conversion of the photon energy into vibrational modes results in fragmentation in the ground state so the fragments generated will be like those generated by CID and IRMPD).49−51
With 213 nm UVPD, the fragments obtained were low intensity compared to other MS/MS methods, yet structure-specific fragments and cross-ring cleavages across both molecules were observed. It is difficult to make a direct comparison between the performance of the 193 and 213 nm UVPD on the data obtained as the number of laser shots and the energy output for each laser were different. However, as shown in Table 1, although most fragments were low intensity, many of the isomer-specific fragments (nine out of the 12) listed for 1,25(OH)2D3 were detected with 213 nm UVPD MS/MS.
A direct infusion relative quantification method is discussed herein using the dihydroxylated vitamin D standards. The highlighted 1,25(OH)2D3-specific product ions m/z 135.08 and 287.20 were chosen to test if the relative quantitation of the isomers was possible as these fragments had the highest relative intensities and S/N out of the characteristic fragments listed in Table 1. Mixtures of 1,25(OH)2D3 and 24,25(OH)2D3 were prepared at known concentration ratios in which the 1,25(OH)2D3 content varied from 0 to 100% in 20% increments. Parts a and b of Figure 6 demonstrate that it is possible to discriminate between the dihydroxylated vitamin D3 isomers and show that, as the percentage of 1,25(OH)2D3 in the 1,25(OH)2D3 /24,25(OH)2D3 standard mixtures is increased the intensity of the IRMPD fragments at m/z 135.08 and 287.2 also increased in intensity.
Figure 6.

m/z scale expansion of (a) m/z 135.05–135.10 and (b) m/z 287.15–287.25 from the IRMPD spectra for the characteristic 1,25(OH)2D3 IRMPD fragment ions with increasing increments of 1,25(OH)2D3 in percentage concentration in the mixture. (c) Structure of 1,25(OH)2D3 with associated cleavages to produce the diagnostic fragments “AD” and “L”. (d) Calibration curves generated using the peak area ratio of the 1,25(OH)2D3-specific “AD” and “L” fragments.
A ratio was taken of the peak area of the 1,25(OH)2D3 specific fragment to the sum of all the fragments present in the IRMPD MS/MS spectrum for each isomer mixture. Fluctuations were observed in the calibration curve when only the peak area or the peak intensities of the characteristic fragment were plotted against the percentage of 1,25(OH)2D3 in the dihydroxylated vitamin D3 isomeric mixture. Calibration curves were obtained with good linearity (R2 > 0.99) with the inclusion of the confidently assigned (mass error <1 ppm) fragments and using the equation below:
Conclusions
In this study, the use of CID was revisited and alternative fragmentation methods such as IRMPD, UVPD, and EID MSMS/MS were investigated for the differentiation of the isomeric dihydroxylated vitamin D3 compounds. Extensive fragmentation including cross-ring cleavage of both dihydroxylated VD3 isomers was observed with all fragmentation methods applied. More significantly, isomer-specific fragments were observed for 1,25-dihydroxyvitamin D3, which were absent for 24,25-dihydroxyvitamin D3 after optimization of the parameters for each MS/MS method and accumulation of scans. The structure-specific fragments generated due to cleavage of the C-6/C-7 bond in the 1,25-dihydroxyvitamin D3 compound demonstrate that the OH groups were retained during dissociation using all the available fragmentation methods.
It should be noted that the water losses and series of hydrocarbon losses for both isomers dominate all the MS/MS spectra obtained. However, after detailed analysis, multiple characteristic fragments were found with the aid of the high resolving power and mass accuracy provided by the FT-ICR MS, which was fully equipped with all the different MS/MS methods.
In summary, diagnostic fragments were observed for 1,25-dihydroxyvitamin D3, enabling quick and easy differentiation between the two dihydroxylated vitamin D3 isomers without the need for prior chromatographic separation or derivatization of the molecules. Preliminary experiments for the quantitative analysis of 1,25-dihydroxyvitamin D3 were carried out, and a linear calibration curve using the diagnostic fragments observed for 1,25-dihydroxyvitamin D3 was established (R2 > 0.99).
This direct infusion quantification method using MS/MS has the potential to be applied to the vitamin D3 metabolites detected in matrices such as serum, which are routinely found in low concentrations and often masked by other endogenous material; hence, chromatographic separation prior to MS/MS analysis may be beneficial while the characteristic fragments listed in this work can be used to identify and quantify the biologically active 1,25-dihydroxyvitamin D3 compound.
Acknowledgments
This work is funded and supported with an EPSRC studentship (EPSRC 1947402), other EPSRC funding (J003022, N021630, L015307, N033191), BBSRC funding (P021875, R022399), the H2020 EU-FTICR Network (project 731077), Bruker Daltonics, the University of Warwick, and the Department of Chemistry. D.A.V. acknowledges research funding by the German Research Foundation (DFG VO 1355/5-2) and the Berlin University Alliance (BUA 501_LinkLab). Thanks is extended to members of the University of Warwick FT-ICR MS group for their helpful discussions and input during this work.
Supporting Information Available
The Supporting Information is available free of charge at https://pubs.acs.org/doi/10.1021/jasms.2c00085.
Tables of peak assignments of all spectra, as well as figures of mass spectra, mass isolation spectra, and tandem mass spectra (IRMPD, 193 nm UVPD, 213 nm UVPD, and EID) of 1,25 dihydroxylated vitamin D3 and 24,25 dihydroxylated vitamin D3; equation used to calculate the percentage fragmentation intensity to precursor intensity ratio of the characteristic fragments for 1,25-dihydroxyvitamin D3 (PDF)
The authors declare no competing financial interest.
Supplementary Material
References
- Holick M. F. Vitamin D Deficiency. N. Engl. J. Med. 2007, 357 (3), 266–281. 10.1056/NEJMra070553. [DOI] [PubMed] [Google Scholar]
- Christodoulou S.; Goula T.; Ververidis A.; Drosos G. Vitamin D and bone disease. BioMed. Res. Int. 2013, 2013, 396541. 10.1155/2013/396541. [DOI] [PMC free article] [PubMed] [Google Scholar]
- Soliman A. T.; El-Dabbagh M.; Adel A.; Ali M. A.; Aziz Bedair E. M.; ElAlaily R. K. Clinical Responses to a Mega-dose of Vitamin D3 in Infants and Toddlers With Vitamin D Deficiency Rickets. J. Trop. Pediatr. 2010, 56 (1), 19–26. 10.1093/tropej/fmp040. [DOI] [PubMed] [Google Scholar]
- Sahay M.; Sahay R. Rickets-vitamin D deficiency and dependency. Indian J. Endocrinol. Metab. 2012, 16 (2), 164–176. 10.4103/2230-8210.93732. [DOI] [PMC free article] [PubMed] [Google Scholar]
- Laird E.; Ward M.; McSorley E.; Strain J. J.; Wallace J. Vitamin D and bone health: potential mechanisms. Nutrients 2010, 2 (7), 693–724. 10.3390/nu2070693. [DOI] [PMC free article] [PubMed] [Google Scholar]
- Holick M. F. Vitamin D status: measurement, interpretation, and clinical application. Ann. Epidemiol. 2009, 19 (2), 73–78. 10.1016/j.annepidem.2007.12.001. [DOI] [PMC free article] [PubMed] [Google Scholar]
- Norman P. E.; Powell J. T. Vitamin D and Cardiovascular Disease. Circ. Res. 2014, 114 (2), 379–393. 10.1161/CIRCRESAHA.113.301241. [DOI] [PubMed] [Google Scholar]
- Valipour G.; Saneei P.; Esmaillzadeh A. Serum Vitamin D Levels in Relation to Schizophrenia: A Systematic Review and Meta-Analysis of Observational Studies. J. Clin. Endocrinol. Metab. 2014, 99 (10), 3863–3872. 10.1210/jc.2014-1887. [DOI] [PubMed] [Google Scholar]
- Littlejohns T. J.; Henley W. E.; Lang I. A.; Annweiler C.; Beauchet O.; Chaves P. H. M.; Fried L.; Kestenbaum B. R.; Kuller L. H.; Langa K. M.; Lopez O. L.; Kos K.; Soni M.; Llewellyn D. J. Vitamin D and the risk of dementia and Alzheimer disease. Neurology 2014, 83 (10), 920. 10.1212/WNL.0000000000000755. [DOI] [PMC free article] [PubMed] [Google Scholar]
- Bikle D. D. Vitamin D metabolism, mechanism of action, and clinical applications. Chem. Biol. 2014, 21 (3), 319–329. 10.1016/j.chembiol.2013.12.016. [DOI] [PMC free article] [PubMed] [Google Scholar]
- Adami S.; Frijlink W. B.; Bijvoet O. L. M.; O’Riordan J. L. H.; Clemens T. L.; Papapoulos S. E. Regulation of calcium absorption by 1,25,dihydroxy-vitamin D—Studies of the effects of a bisphosphonate treatment. Calcif. Tissue Int. 1982, 34 (1), 317–320. 10.1007/BF02411260. [DOI] [PubMed] [Google Scholar]
- Christakos S. Mechanism of action of 1,25-dihydroxyvitamin D3 on intestinal calcium absorption. Rev. Endocr. Metab. Disord. 2012, 13 (1), 39–44. 10.1007/s11154-011-9197-x. [DOI] [PubMed] [Google Scholar]
- Fleet J. C.; Bradley J.; Reddy G. S.; Ray R.; Wood R. J. 1α,25-(OH)2-Vitamin D3Analogs with Minimalin VivoCalcemic Activity Can Stimulate Significant Transepithelial Calcium Transport and mRNA Expressionin Vitro. Arch. Biochem. Biophys. 1996, 329 (2), 228–234. 10.1006/abbi.1996.0213. [DOI] [PubMed] [Google Scholar]
- DeLuca H. F.; Plum L. A.; Clagett-Dame M. Selective analogs of 1α,25-dihydroxyvitamin D3 for the study of specific functions of Vitamin D. J. Steroid Biochem. Mol. Biol. 2007, 103 (3), 263–268. 10.1016/j.jsbmb.2006.12.005. [DOI] [PubMed] [Google Scholar]
- Tanaka Y.; Frank H.; Deluca H. F. Biological Activity of 1,25-Dihydroxyvitamin D3 in the Rat1. Endocrinology 1973, 92 (2), 417–422. 10.1210/endo-92-2-417. [DOI] [PubMed] [Google Scholar]
- Kumar R. The Metabolism of 1,25-Dihydroxyvitamin D3*. Endocr. Rev. 1980, 1 (3), 258–267. 10.1210/edrv-1-3-258. [DOI] [PubMed] [Google Scholar]
- Wasserman R. H. Vitamin D and the Dual Processes of Intestinal Calcium Absorption. J. Nutr. 2004, 134 (11), 3137–3139. 10.1093/jn/134.11.3137. [DOI] [PubMed] [Google Scholar]
- Lam H.-Y.; Schnoes H. K.; DeLuca H. F.; Chen T. C. 24,25-Dihydroxyvitamin D3. Synthesis and biological activity. Biochemistry 1973, 12 (24), 4851–4855. 10.1021/bi00748a007. [DOI] [PubMed] [Google Scholar]
- Henry H.; Norman A.; Taylor A.; Hartenbower D.; Coburn J. Biological Activity of 24,25-Dihydroxycholecalciferol in Chicks and Rats. J. Nutr. 1976, 106, 724–734. 10.1093/jn/106.6.724. [DOI] [PubMed] [Google Scholar]
- Endo H.; Kiyoki M.; Kawashima K.; Naruchi T.; Hashimoto Y. Vitamin D3 metabolites and PTH synergistically stimulate bone formation of chick embryonic femur in vitro. Nature 1980, 286 (5770), 262–264. 10.1038/286262a0. [DOI] [PubMed] [Google Scholar]
- Galus K.; Szymendera J.; Zaleski A.; Schreyer K. Effects of 1α-hydroxyvitamin D3 and 24R,25-dihydroxyvitamin D3 on bone remodeling. Calcif. Tissue Int. 1980, 31 (1), 209–213. 10.1007/BF02407183. [DOI] [PubMed] [Google Scholar]
- Sömjen D.; Sömjen G. J.; Weisman Y.; Binderman I. Evidence for 24,25-dihydroxycholecalciferol receptors in long bones of newborn rats. Biochem. J. 1982, 204 (1), 31–36. 10.1042/bj2040031. [DOI] [PMC free article] [PubMed] [Google Scholar]
- Seo E.-G.; Einhorn T. A.; Norman A. W. 24R,25-Dihydroxyvitamin D3: An Essential Vitamin D3Metabolite for Both Normal Bone Integrity and Healing of Tibial Fracture in Chicks*. Endocrinology 1997, 138 (9), 3864–3872. 10.1210/endo.138.9.5398. [DOI] [PubMed] [Google Scholar]
- Crawford B. A.; Labio E. D.; Strasser S. I.; McCaughan G. W. Vitamin D replacement for cirrhosis-related bone disease. Nat. Clin Pract Gastroenterol Hepatol 2006, 3 (12), 689–699. 10.1038/ncpgasthep0637. [DOI] [PubMed] [Google Scholar]
- Muller M. J.; Volmer D. A. Mass spectrometric profiling of vitamin D metabolites beyond 25-hydroxyvitamin D. Clin. Chem. 2015, 61 (8), 1033–1048. 10.1373/clinchem.2015.241430. [DOI] [PubMed] [Google Scholar]
- Heijboer A. C.; Blankenstein M. A.; Kema I. P.; Buijs M. M. Accuracy of 6 routine 25-hydroxyvitamin D assays: influence of vitamin D binding protein concentration. Clin. Chem. 2012, 58 (3), 543–548. 10.1373/clinchem.2011.176545. [DOI] [PubMed] [Google Scholar]
- Cavalier E.; Lukas P.; Crine Y.; Peeters S.; Carlisi A.; Le Goff C.; Gadisseur R.; Delanaye P.; Souberbielle J.-C. Evaluation of automated immunoassays for 25(OH)-vitamin D determination in different critical populations before and after standardization of the assays. Clin. Chim. Acta 2014, 431, 60–65. 10.1016/j.cca.2014.01.026. [DOI] [PubMed] [Google Scholar]
- van den Ouweland J. M. W. Analysis of vitamin D metabolites by liquid chromatography-tandem mass spectrometry. TrAC, Trends Anal. Chem. 2016, 84, 117–130. 10.1016/j.trac.2016.02.005. [DOI] [Google Scholar]
- Wang Z.; Senn T.; Kalhorn T.; Zheng X. E.; Zheng S.; Davis C. L.; Hebert M. F.; Lin Y. S.; Thummel K. E. Simultaneous measurement of plasma vitamin D3 metabolites, including 4β,25-dihydroxyvitamin D3, using liquid chromatography–tandem mass spectrometry. Anal. Biochem. 2011, 418 (1), 126–133. 10.1016/j.ab.2011.06.043. [DOI] [PMC free article] [PubMed] [Google Scholar]
- Shah I.; James R.; Barker J.; Petroczi A.; Naughton D. P. Misleading measures in Vitamin D analysis: a novel LC-MS/MS assay to account for epimers and isobars. Nutr. J. 2011, 10, 46–46. 10.1186/1475-2891-10-46. [DOI] [PMC free article] [PubMed] [Google Scholar]
- Satoh M.; Ishige T.; Ogawa S.; Nishimura M.; Matsushita K.; Higashi T.; Nomura F. Development and validation of the simultaneous measurement of four vitamin D metabolites in serum by LC–MS/MS for clinical laboratory applications. Anal. Bioanal. Chem. 2016, 408 (27), 7617–7627. 10.1007/s00216-016-9821-4. [DOI] [PubMed] [Google Scholar]
- Liebisch G.; Matysik S. Accurate and reliable quantification of 25-hydroxy-vitamin D species by liquid chromatography high-resolution tandem mass spectrometry. J. Lipid Res. 2015, 56 (6), 1234–1239. 10.1194/jlr.D058511. [DOI] [PMC free article] [PubMed] [Google Scholar]
- Stepman H. C. M.; Vanderroost A.; Van Uytfanghe K.; Thienpont L. M. Candidate Reference Measurement Procedures for Serum 25-Hydroxyvitamin D3 and 25-Hydroxyvitamin D2 by Using Isotope-Dilution Liquid Chromatography–Tandem Mass Spectrometry. Clin. Chem. 2011, 57 (3), 441–448. 10.1373/clinchem.2010.152553. [DOI] [PubMed] [Google Scholar]
- Newman M. S.; Brandon T. R.; Groves M. N.; Gregory W. L.; Kapur S.; Zava D. T. A liquid chromatography/tandem mass spectrometry method for determination of 25-hydroxy vitamin D2 and 25-hydroxy vitamin D3 in dried blood spots: a potential adjunct to diabetes and cardiometabolic risk screening. J. Diabetes Sci. Technol. 2009, 3 (1), 156–162. 10.1177/193229680900300118. [DOI] [PMC free article] [PubMed] [Google Scholar]
- Socas-Rodríguez B.; Pilařová V.; Sandahl M.; Holm C.; Turner C. Simultaneous Determination of Vitamin D and Its Hydroxylated and Esterified Metabolites by Ultrahigh-Performance Supercritical Fluid Chromatography–Tandem Mass Spectrometry. Anal. Chem. 2022, 94 (7), 3065–3073. 10.1021/acs.analchem.1c04016. [DOI] [PMC free article] [PubMed] [Google Scholar]
- Volmer D. A.; Mendes L. R. B. C.; Stokes C. S. Analysis of vitamin D metabolic markers by mass spectrometry: Current techniques, limitations of the “gold standard” method, and anticipated future directions. Mass Spectrom. Rev. 2015, 34 (1), 2–23. 10.1002/mas.21408. [DOI] [PubMed] [Google Scholar]
- Yang M.-Y.; Huang C.-Y.; Chiu T. H. T.; Chang K.-C.; Lin M.-N.; Chen L.-Y.; Hu A. Using gas chromatography and mass spectrometry to determine 25-hydroxyvitamin D levels for clinical assessment of vitamin D deficiency. J. Food Drug Anal. 2019, 27 (2), 494–501. 10.1016/j.jfda.2018.12.010. [DOI] [PMC free article] [PubMed] [Google Scholar]
- Coldwell R. D.; Porteous C. E.; Trafford D. J. H.; Makin H. L. J. Gas chromatography—mass spectrometry and the measurement of vitamin D metabolites in human serum or plasma. Steroids 1987, 49 (1), 155–196. 10.1016/0039-128X(87)90083-3. [DOI] [PubMed] [Google Scholar]
- Aronov P. A.; Hall L. M.; Dettmer K.; Stephensen C. B.; Hammock B. D. Metabolic profiling of major vitamin D metabolites using Diels–Alder derivatization and ultra-performance liquid chromatography–tandem mass spectrometry. Anal. Bioanal. Chem. 2008, 391 (5), 1917. 10.1007/s00216-008-2095-8. [DOI] [PMC free article] [PubMed] [Google Scholar]
- Teegarden M. D.; Riedl K. M.; Schwartz S. J. Chromatographic separation of PTAD-derivatized 25-hydroxyvitamin D3 and its C-3 epimer from human serum and murine skin. J. Chromatogr. B 2015, 991, 118–121. 10.1016/j.jchromb.2015.04.011. [DOI] [PMC free article] [PubMed] [Google Scholar]
- Ogawa S.; Ooki S.; Shinoda K.; Higashi T. Analysis of urinary vitamin D3 metabolites by liquid chromatography/tandem mass spectrometry with ESI-enhancing and stable isotope-coded derivatization. Anal. Bioanal. Chem. 2014, 406 (26), 6647–6654. 10.1007/s00216-014-8095-y. [DOI] [PubMed] [Google Scholar]
- Hedman C. J.; Wiebe D. A.; Dey S.; Plath J.; Kemnitz J. W.; Ziegler T. E. Development of a sensitive LC/MS/MS method for vitamin D metabolites: 1,25 Dihydroxyvitamin D2&3 measurement using a novel derivatization agent. J. Chromatogr. B Analyt. Technol. Biomed. Life Sci. 2014, 953–954, 62–67. 10.1016/j.jchromb.2014.01.045. [DOI] [PMC free article] [PubMed] [Google Scholar]
- Ding S.; Schoenmakers I.; Jones K.; Koulman A.; Prentice A.; Volmer D. A. Quantitative determination of vitamin D metabolites in plasma using UHPLC-MS/MS. Anal. Bioanal. Chem. 2010, 398 (2), 779–789. 10.1007/s00216-010-3993-0. [DOI] [PMC free article] [PubMed] [Google Scholar]
- Qi Y.; Müller M. J.; Volmer D. A. Activation of Reactive MALDI Adduct Ions Enables Differentiation of Dihydroxylated Vitamin D Isomers. J. Am. Soc. Mass Spectrom. 2017, 28 (12), 2532–2537. 10.1007/s13361-017-1775-z. [DOI] [PubMed] [Google Scholar]
- Chouinard C. D.; Cruzeiro V. W. D.; Beekman C. R.; Roitberg A. E.; Yost R. A. Investigating Differences in Gas-Phase Conformations of 25-Hydroxyvitamin D3 Sodiated Epimers using Ion Mobility-Mass Spectrometry and Theoretical Modeling. J. Am. Soc. Mass Spectrom. 2017, 28 (8), 1497–1505. 10.1007/s13361-017-1673-4. [DOI] [PubMed] [Google Scholar]
- Chouinard C. D.; Cruzeiro V. W. D.; Kemperman R. H. J.; Oranzi N. R.; Roitberg A. E.; Yost R. A. Cation-dependent conformations in 25-hydroxyvitamin D3-cation adducts measured by ion mobility-mass spectrometry and theoretical modeling. Int. J. Mass spectrom. 2018, 432, 1–8. 10.1016/j.ijms.2018.05.013. [DOI] [PMC free article] [PubMed] [Google Scholar]
- Schorr P.; Kovačević B.; Volmer D. A. Overestimation of 3α- over 3β-25-Hydroxyvitamin D3 Levels in Serum: A Mechanistic Rationale for the Different Mass Spectral Properties of the Vitamin D Epimers. J. Am. Soc. Mass Spectrom. 2021, 32 (4), 1116–1125. 10.1021/jasms.1c00054. [DOI] [PubMed] [Google Scholar]
- Young D. C.; Vouros P.; Holick M. F.; Higuchi T. Collisionally induced dissociation in the study of A-ring hydroxylated vitamin D type compounds. Anal. Chem. 1992, 64 (8), 837–842. 10.1021/ac00032a004. [DOI] [PubMed] [Google Scholar]
- Lin M.-F.; Tzeng C.-M.; Dyakov Y. A.; Ni C.-K. Photostability of amino acids: Internal conversion versus dissociation. J. Chem. Phys. 2007, 126 (24), 241104. 10.1063/1.2751150. [DOI] [PubMed] [Google Scholar]
- Julian R. R. The Mechanism Behind Top-Down UVPD Experiments: Making Sense of Apparent Contradictions. J. Am. Soc. Mass Spectrom. 2017, 28 (9), 1823–1826. 10.1007/s13361-017-1721-0. [DOI] [PMC free article] [PubMed] [Google Scholar]
- Brodbelt J. S.; Morrison L. J.; Santos I. Ultraviolet Photodissociation Mass Spectrometry for Analysis of Biological Molecules. Chem. Rev. 2020, 120 (7), 3328–3380. 10.1021/acs.chemrev.9b00440. [DOI] [PMC free article] [PubMed] [Google Scholar]
Associated Data
This section collects any data citations, data availability statements, or supplementary materials included in this article.