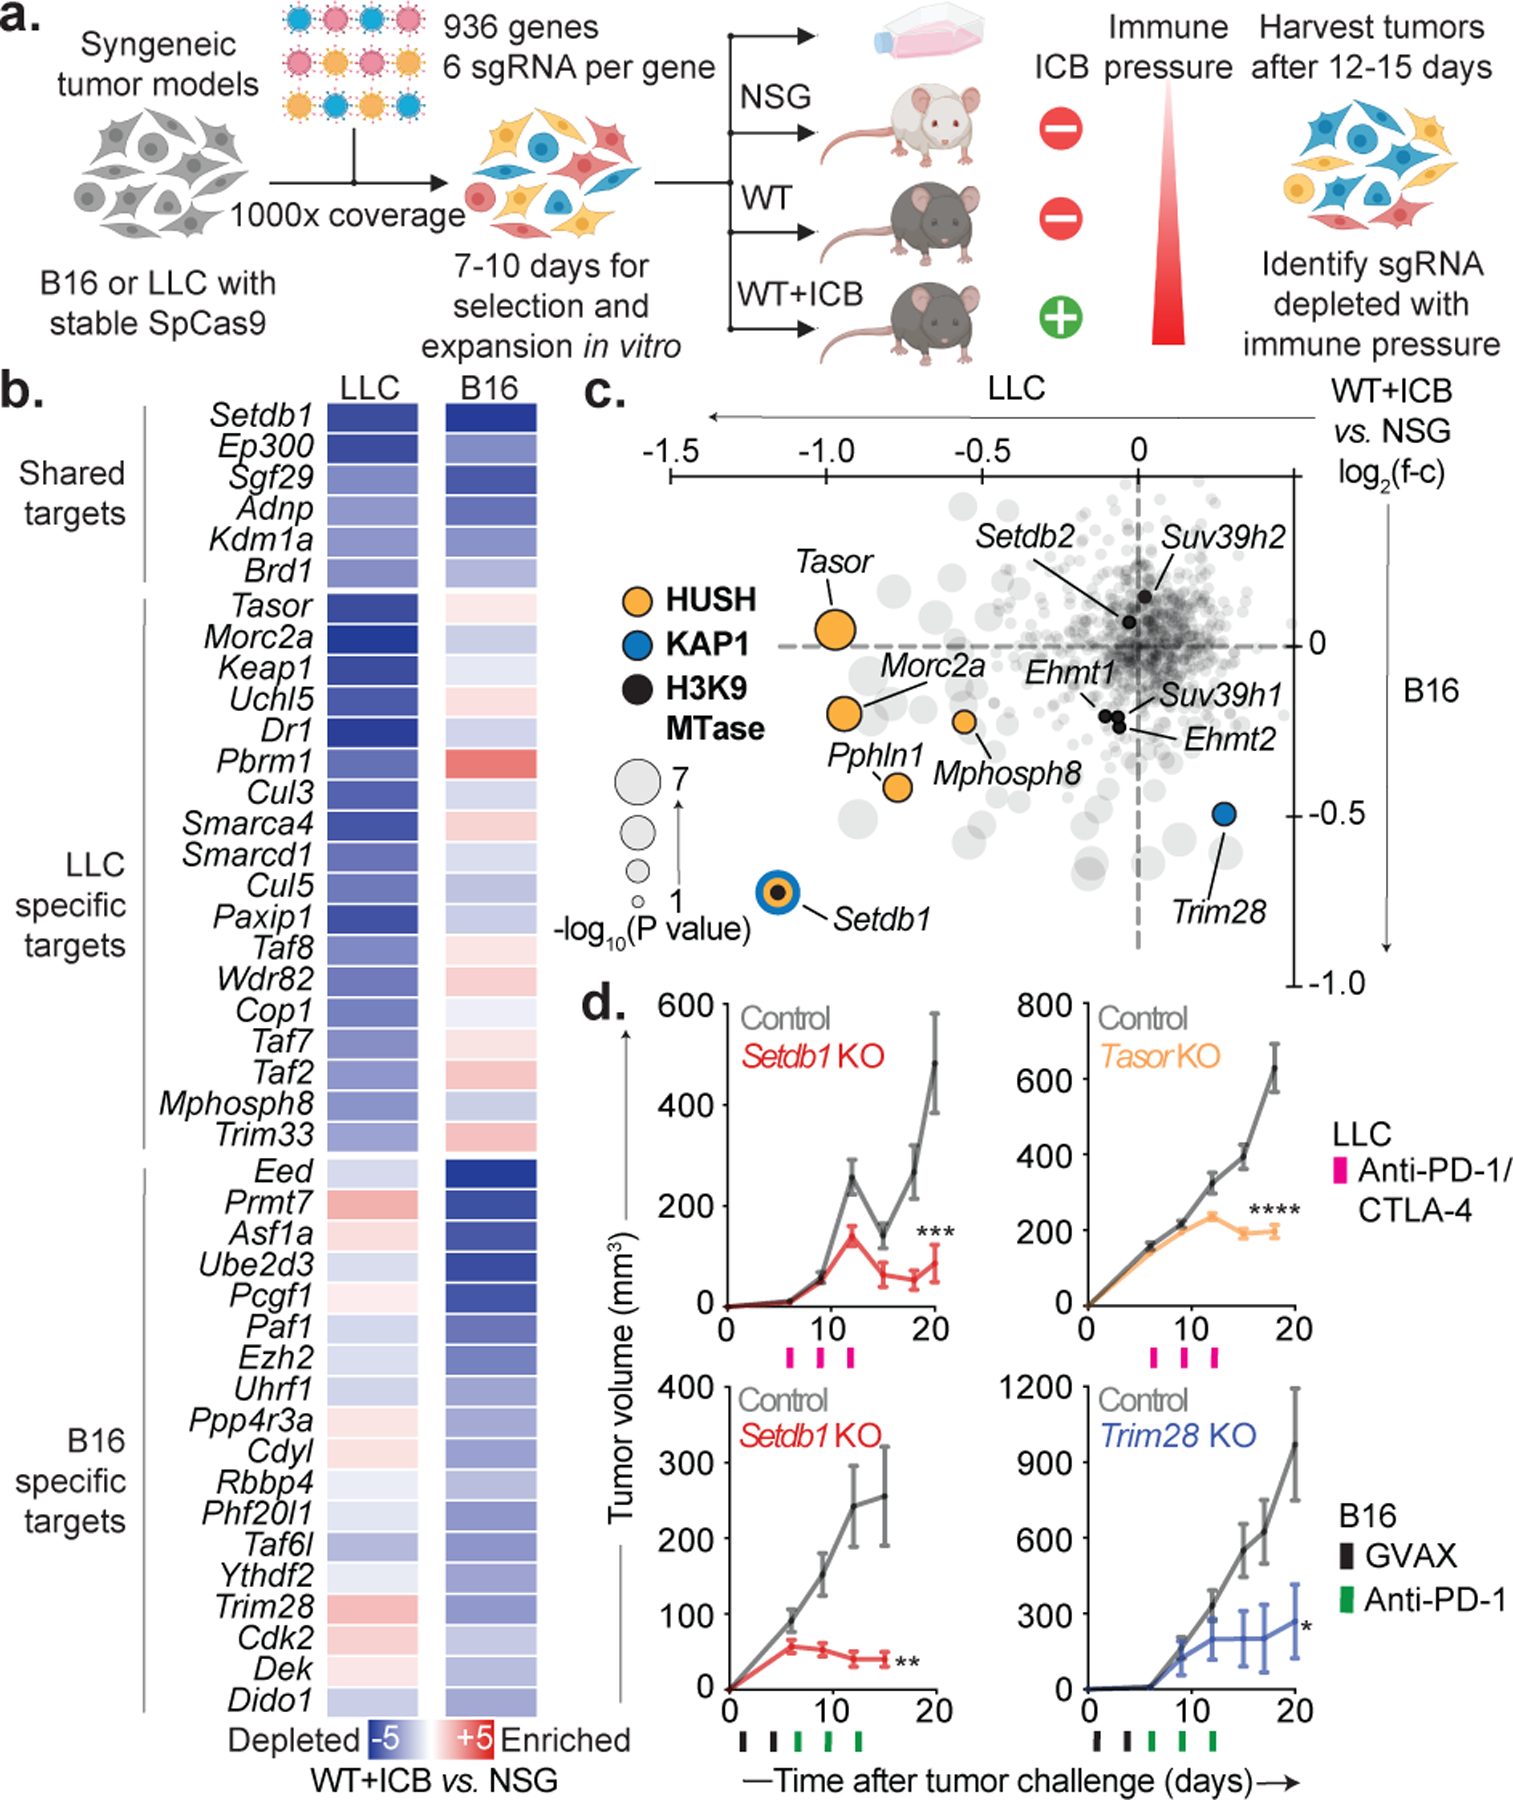
Figure 1. In vivo chromatin regulator screens.

(a) Chromatin regulator screens in B16 and LLC. (b) Depletion (blue) or enrichment (red) of targeted genes in ICB-treated WT versus NSG mice grouped by top shared and cell-specific hits. (c) Depletion (negative ratios) or enrichment (positive ratios) of targeted genes (grey) in ICB-treated WT versus NSG mice with Setdb1, Trim28 (KAP1), HUSH complex, and other H3K9-methyltransferases highlighted. (d) Tumor growth (mean volume +/− s.e.m.) for ICB-treated WT mice inoculated with Setdb1 (n=20) or Tasor KO (n=20) LLC (top), and Setdb1 (n=20) or Trim28 KO (n=5) B16 (bottom). Data are representative of 3 (Setdb1), 1 (Tasor), and 2 (Trim28) independent experiments with 2 distinct sgRNA. Statistics by two-sided Student’s t-test at indicated time-points. *P < 0.05; **P < 0.01; ***P < 0.001; ****P < 0.0001.
