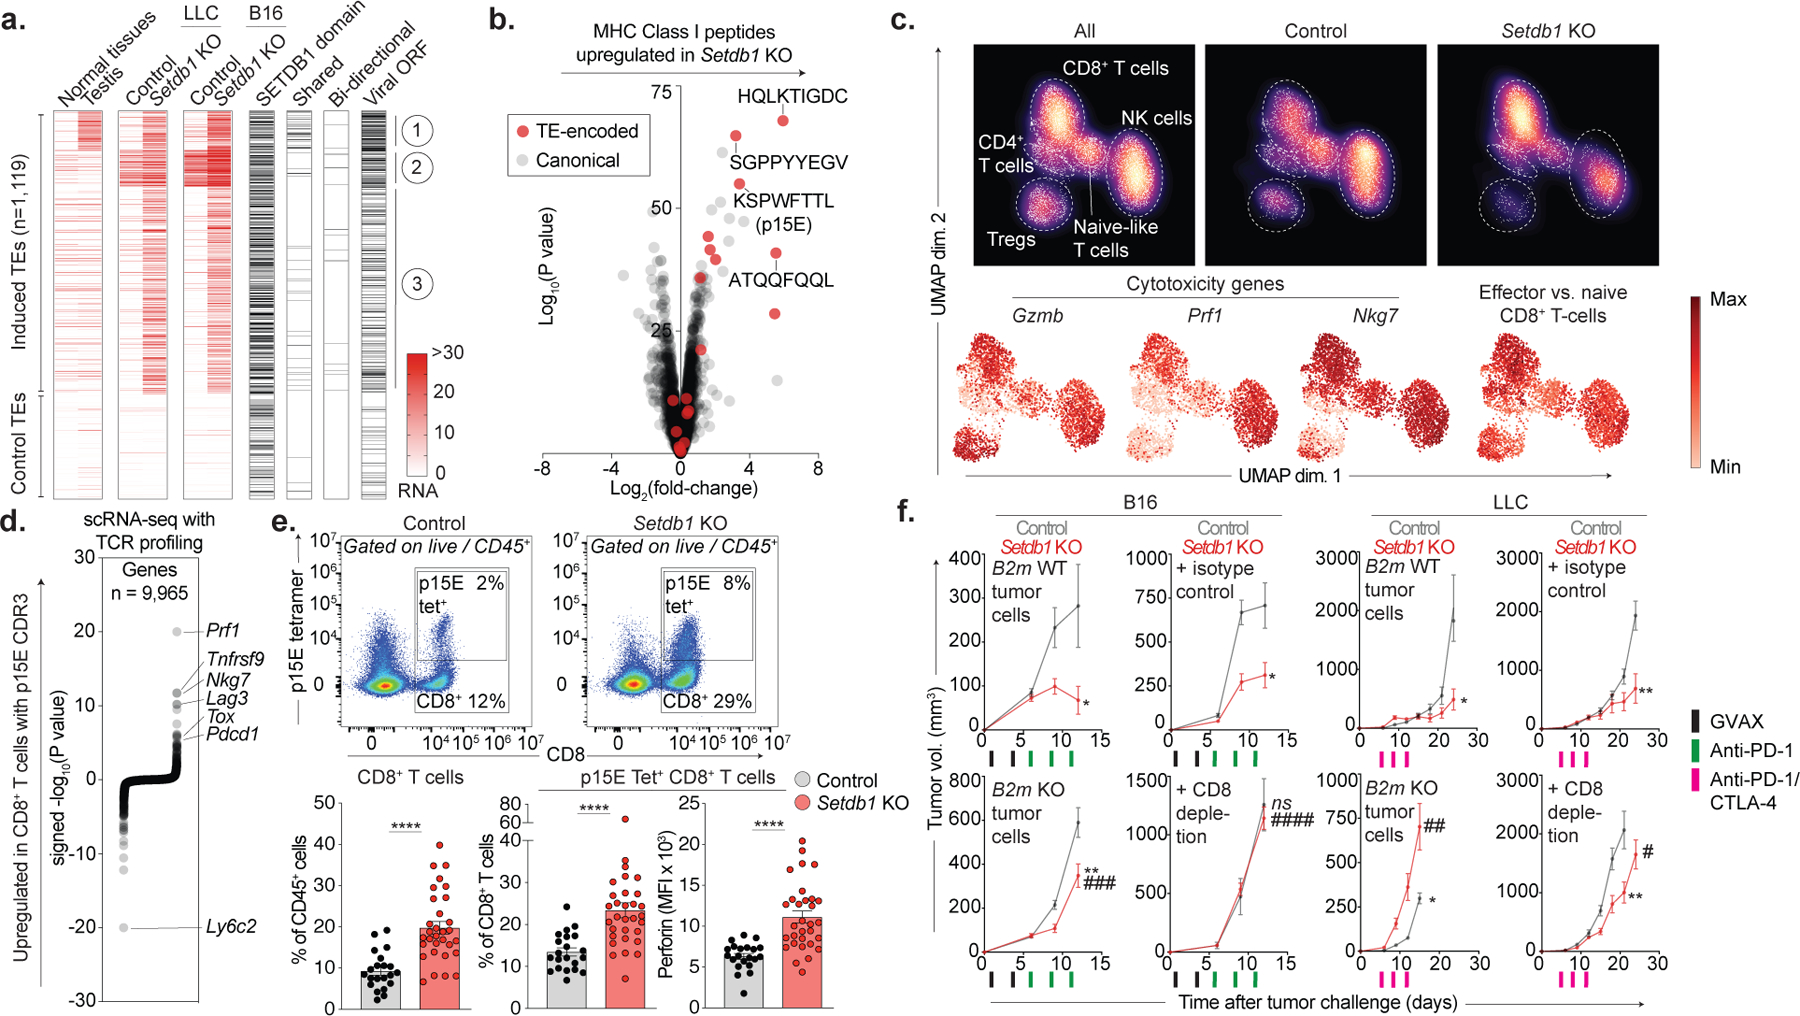
Figure 4. SETDB1 loss induces TE-encoded viral antigens.

(a) Heatmap shows RNA expression for TE insertions (rows) activated upon Setdb1 KO (top) versus downsampled controls (bottom). Median expression across 17 normal tissues and testis is indicated. Additional columns identify TEs within SETDB1 domains, and those that are activated in Setdb1 KO LLC and B16 (shared), undergo bidirectional transcription, or retain intact viral ORFs. (b) MHC-I peptidomics of LLC depicts TE-encoded (red) and canonical (grey) peptides in Setdb1 KO versus control. (c) UMAP density plots (top) of scRNA-seq (3’) for 4,497 lymphoid cells identified within CD45+-enriched immune cells from control (n=7) or Setdb1 KO (n=7) LLC tumors. Red heat (bottom) depicts expression of cytotoxicity genes and an effector CD8+ T-cell signature. Data represent one experiment. (d) scRNA-seq (5’) with TCR profiling of 9,526 CD8+ T-cells identified within CD4+/CD8+-enriched cells from control (n=8) or Setdb1 KO (n=6) LLC tumors. Plot shows differential expression of genes in CD8+ T-cells with p15E-specific TCRs versus T-cells with TCRs of no known specificity. Data represent one experiment. (e) Flow cytometry of total and p15E-specific CD8+ T-cells isolated from control (n=20) and Setdb1 KO (n=30) LLC tumors. Data are mean +/− s.e.m and representative of two experiments. Statistics by two-sided Student’s t-test. (f) Tumor growth (mean volume +/−s.e.m) for ICB-treated mice inoculated with control or Setdb1 KO tumor cells with intact (B2m WT) or deficient (B2m KO) MHC-I. Analogous curves shown for mice receiving isotype-control or CD8-depleting antibodies. Data represent 1 experiment in each cell-line (n=10 in LLC and n=15 in B16 per genotype/treatment). Statistics by two-sided Student’s t-test at indicated time-points. Stars and pound-signs indicate significance within or across the indicated genotypes/treatments, respectively. */#P < 0.05; **/##P < 0.01; ***/###P < 0.001; ****/####P < 0.0001.
