Abstract
Rationale: It has been suggested that patients with chronic obstructive pulmonary disease (COPD) experience considerable daily respiratory symptom fluctuation. A standardized measure is needed to quantify and understand the implications of day-to-day symptom variability.
Objectives: To compare standard deviation with other statistical measures of symptom variability and identify characteristics of individuals with higher symptom variability.
Methods: Individuals in the SubPopulations and InteRmediate Outcome Measures In COPD Study (SPIROMICS) Exacerbations sub-study completed an Evaluating Respiratory Symptoms in COPD (E-RS) daily questionnaire. We calculated within-subject standard deviation (WS-SD) for each patient at week 0 and correlated this with measurements obtained 4 weeks later using Pearson’s r and Bland Altman plots. Median WS-SD value dichotomized participants into higher versus lower variability groups. Association between WS-SD and exacerbation risk during 4 follow-up weeks was explored.
Measurements and Main Results: Diary completion rates were sufficient in 140 (68%) of 205 sub-study participants. Reproducibility (r) of the WS-SD metric from baseline to week 4 was 0.32. Higher variability participants had higher St George’s Respiratory Questionnaire (SGRQ) scores (47.3 ± 20.3 versus 39.6 ± 21.5, p=.04) than lower variability participants. Exploratory analyses found no relationship between symptom variability and health care resource utilization-defined exacerbations.
Conclusions: WS-SD of the E-RS can be used as a measure of symptom variability in studies of patients with COPD. Patients with higher variability have worse health-related quality of life. WS-SD should be further validated as a measure to understand the implications of symptom variability.
Keywords: chronic obstructive pulmonary disease, exacerbations, patient-reported outcomes, EXACT, symptom variation
Introduction
This article contains supplemental material.
Patients with chronic obstructive pulmonary disease (COPD) experience respiratory symptoms including breathlessness, cough, and sputum production that necessitate comprehensive assessment.1 This assessment, and hence, therapeutic decision-making, has not adequately incorporated symptom variability. Prior studies have examined the impact of morning symptoms and have correlated these to more frequent exacerbations and greater impact on health-related quality of life.2-7 Weaknesses of studies assessing symptom variability during the stable state include cross-sectional design and surveys dependent on participant recall of symptoms.2-11 Two prospective studies that examined symptom variability were limited by small sample size and a short follow-up period.9-12 The more recent prospective study evaluated 2669 participants over 1 week using the Night-time and the Early Morning Symptoms of COPD instruments and found more severe disease was associated with fluctuation in symptom number and intensity.12 A metric to define and compare individual symptom variability has not been developed.
Given correlation between morning symptom differences, quality of life, and exacerbation risk, the development of a symptom variability metric using prospectively collected data over a longer time in a highly phenotyped sample could contribute to comprehensive patient assessment. The SubPopulations and InteRmediate Outcome Measures In COPD Study (SPIROMICS) cohort provides a unique opportunity to evaluate the variability of respiratory symptoms prospectively. In the Exacerbation sub-study, a subset of SPIROMICS participants completed the Evaluating Respiratory Symptoms in COPD (E-RS™:COPD or E-RS),13,14 an 11-question patient-reported outcome (PRO) diary administered as part of the 14-item Exacerbation in Chronic Pulmonary Disease Tool (EXACT). The E-RS has been shown to be a reliable, valid, and responsive measure of respiratory symptom severity in stable COPD and is sensitive to the treatment effects of drug therapies.14-17 Measuring fluctuation in E-RS scores provides an opportunity to characterize day-to-day symptom variability as an additional dimension of symptom burden. A standardized measurement of symptom variability could in turn be tested for therapeutic responsiveness in future studies. Standard deviation is a common statistical measure to quantify variation and dispersion of biomedical data.18 We hypothesized that the within-subject standard deviation (WS-SD) of E-RS scores can serve as a potential metric to quantify variability of respiratory symptoms in patients with COPD.
Our objectives were as follows: (1) to evaluate the performance of the WS-SD variability metric compared to other statistical measures of variation, (2) to identify differences in baseline characteristics between individuals with higher versus lower WS-SD, and (3) explore the extent to which baseline symptom variability predicted future exacerbations. Preliminary results have been reported in an abstract.19
Materials and Methods
Study Cohort
SPIROMICS is a prospective cohort study that enrolled 2981 participants across 4 strata (never-smokers, smokers without COPD, mild/moderate COPD, and severe COPD) with the goals of identifying new COPD subgroups and markers of disease progression. The SPIROMICS protocol details full inclusion and exclusion criteria and assessments performed at baseline.13 In addition to these assessments, the main SPIROMICS study obtained additional imaging phenotypic markers including the square root of the wall area of a hypothetical airway with an internal perimeter of 10 mm (Pi10) and parametric response mapping.20
Data for these analyses were derived from the subgroup of participants with COPD participating in the SPIROMICS Exacerbation sub-study; this was incremental to the previously published SPIROMICS-wide exacerbation data.13 To be representative of patients at a baseline stable state, sub-study eligibility criteria included being free of a health care resource utilization (HCRU)-defined exacerbation in the 30 days before enrollment. Exclusion criteria included a primary diagnosis of asthma or visual or cognitive impairment preventing completion of the daily diary using a personal digital assistant. Institutional review boards at each center approved SPIROMICS, and all participants provided informed consent.
Symptom and Exacerbation Assessment
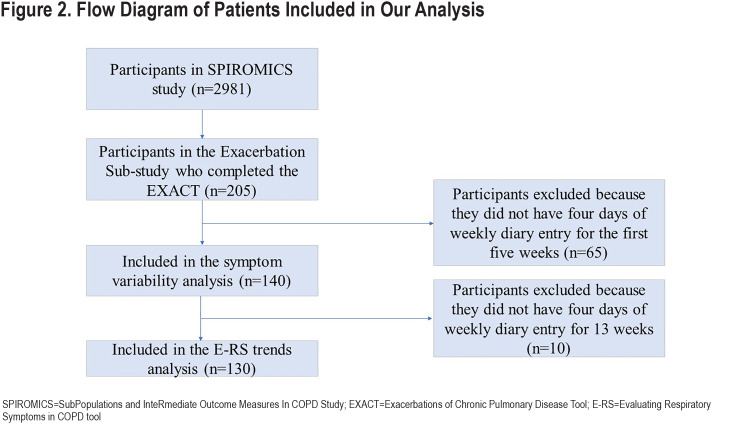
Sub-study participants completed the E-RS as part of their daily study diary. The E-RS total score ranges from 1 to 40 with higher scores indicating more severe symptoms, overall.21 Consistent with E-RS scoring guidelines, participants with at least 4 days of diary data per week and 80% completion rate of daily diary data for the first 5 weeks were included in the analysis; participants who did not meet this diary completion rate were excluded.
Exacerbations were defined by HCRU, i.e., an increase in respiratory symptoms that required a health care visit and were treated with antibiotics, systemic corticosteroids, or both.20 In addition, symptom-defined EXACT events were identified using the 14-item EXACT score, which ranges from 0-100 with higher scores indicating a worse health state. EXACT (symptom-defined) events, which are periods of acute sustained symptom worsening, are characterized by an increase from a stable baseline state in an individual’s EXACT score of >9 points for 3 consecutive days, or >12 points for 2 consecutive days.22,23
Study Design and Statistical Methods
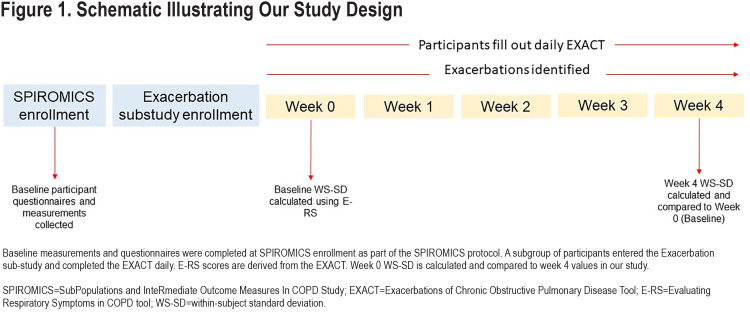
We compared the performance of the WS-SD of E-RS total scores calculated from the first week (baseline or Week 0) to 5 other metrics for estimating variability: interquartile range (IQR), range, median absolute deviation, variance, and coefficient of variation. The week 0 value for each variability measure was compared with the week 4 value using Pearson’s correlation to determine reproducibility. We constructed Bland-Altman plots for each variability metric also comparing week 0 values to week 4 values. Our main analysis focused on the first 5 weeks because prior to sub-study enrollment, participants were free of HCRU exacerbation for at least 30 days. We were interested in symptom variability during a time period closest to this stable state. A schematic of our study and timing of assessments is presented in Figure 1. Finally, we examined the change in WS-SD over each of 13 weeks and used paired t-tests to compare changes.
The week 0 median value of the E-RS total score WS-SD was used to dichotomize individuals into higher versus lower variability groups. Week 0 values were chosen as these were closest to the patient’s known 30-day exacerbation-free (stable) period prior to inclusion in the sub-study and reflect symptom variability at a stable state. Student t-test or Wilcoxon rank sum test was used for continuous variables and χ2 test or Fisher exact test was used for categorical variables for comparison of baseline patient characteristics between variability groups.
We explored differences in the number of participants experiencing HCRU-defined exacerbations over 5, 13, and 52 weeks in the higher versus lower variability group using Fisher exact test to compare proportions. We used multivariate logistic regression to explore the association between higher variability with an EXACT (symptom-defined) event during the 4-week post-baseline period. Statistical analysis was performed using R software version 3.6.3.
Results
Characteristics of Included Patients
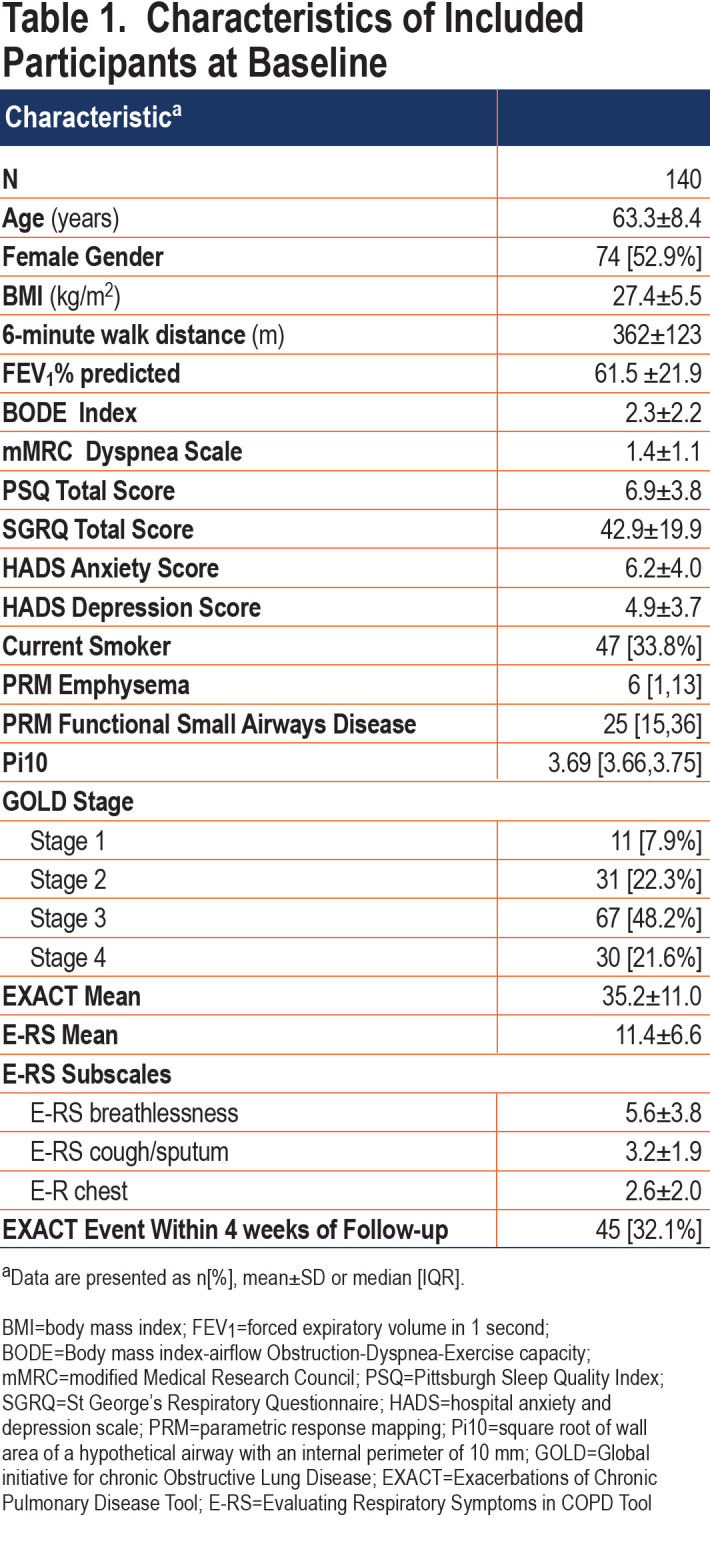
The E-RS was completed daily by 205 participants; data from 140 (68%) met criteria for this analysis with sufficient diary completion rates in the first 5 weeks of follow-up (Figure 2).Included participants had a mean age of 63.3±8.4 years and 53% were women. Mean E-RS total score at baseline, representing respiratory symptom severity overall, was 11.4±6.6. Further participant characterization is found in Table 1. Differences between the included and excluded participants were fewer EXACT events in the excluded group (anticipated because lower completion rates would result in fewer detected events), lower modified Medical Research Council (mMRC) Dyspnea Scale scores, and lower St George’s Respiratory Questionnaire (SGRQ) scores (Table E1 in the online supplement). Our extended analysis of E-RS scores through week 13 included a smaller sample size of 130 patients, as fewer participants met diary completion criteria (Figure 2).
Performance of Within Subject-Standard Deviation as a Symptom Variability Metric
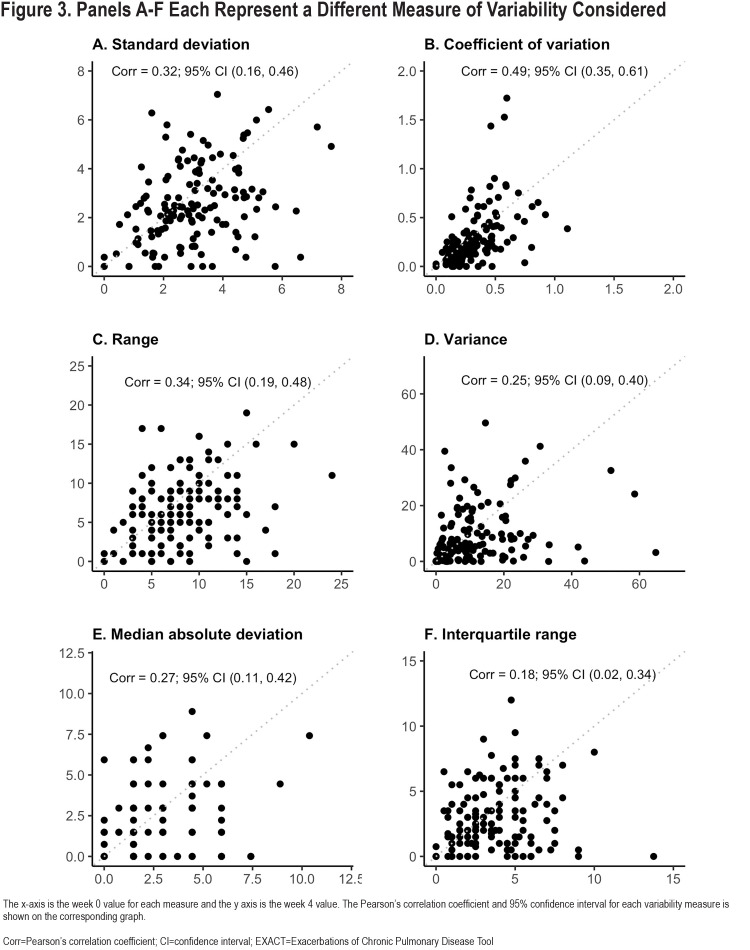
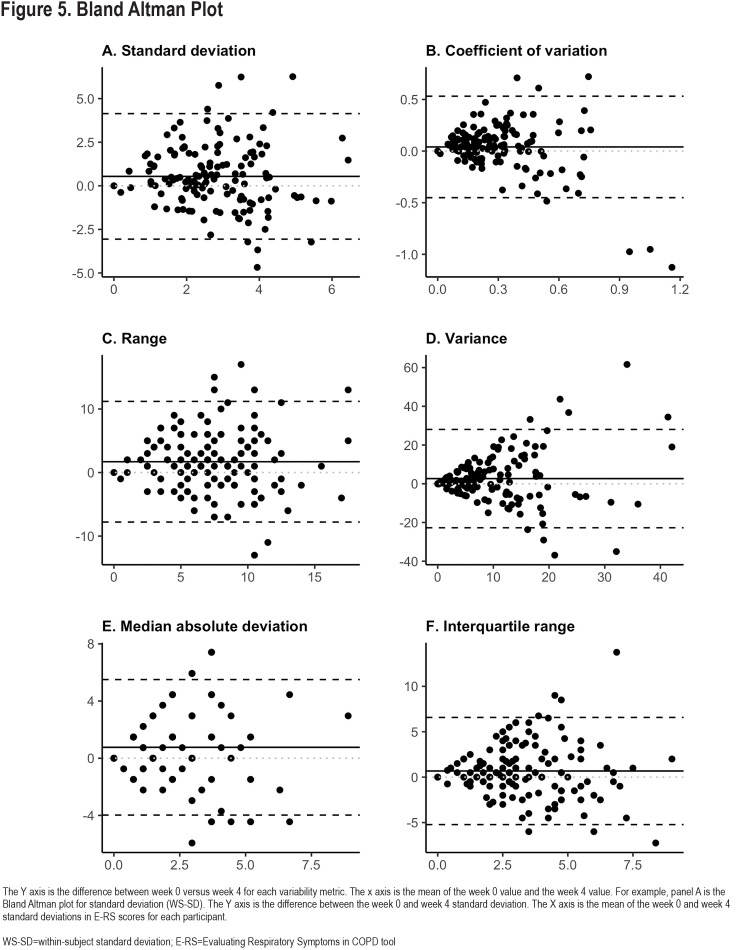
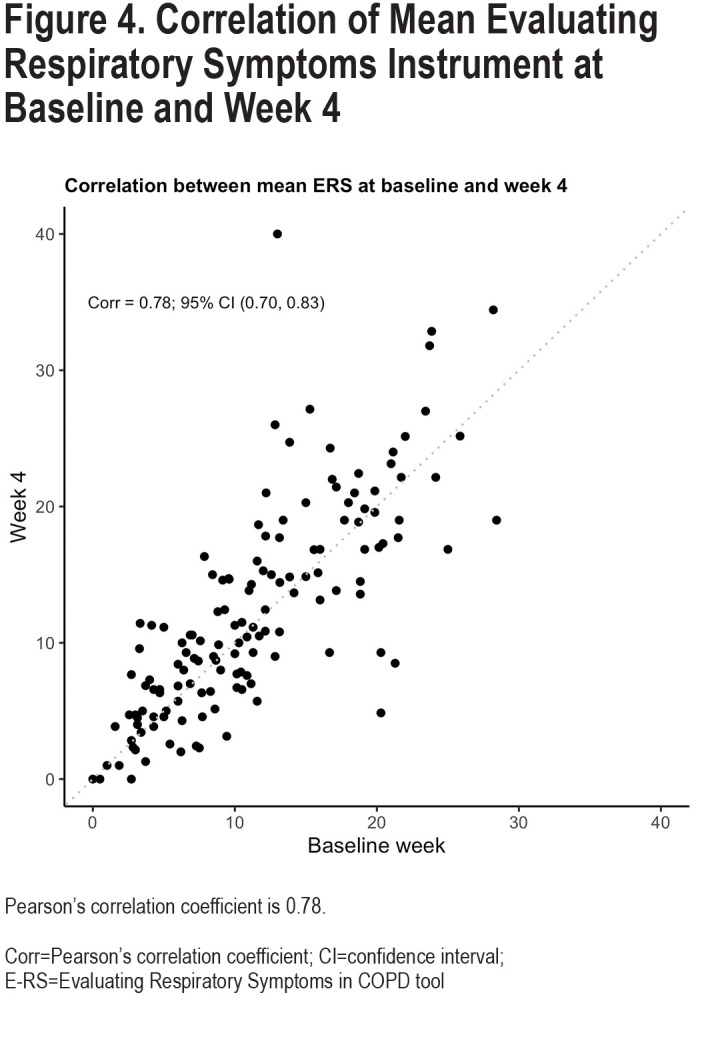
Reproducibility of the 6 different variability metrics between Week 0 and Week 4 were relatively low, with Pearson-correlation coefficients (r), ranging from 0.18–0.49 (Figure 3). By contrast, mean E-RS total scores for each participant were more constant [r=0.78; Cohen’s kappa=0.66 (95% CI: 0.53–0.78)] (Figure 4). Coefficient of variation (r=0.49, 95% confidence interval [CI] 0.35–0.61), WS-SD (r=0.32, 95% CI 0.16–0.46) and range (r=0.34, 95% CI 0.19–0.48) had the highest Pearson correlation coefficients. Bland Altmann plots were constructed for each of our variation measures and are shown in Figure 5.
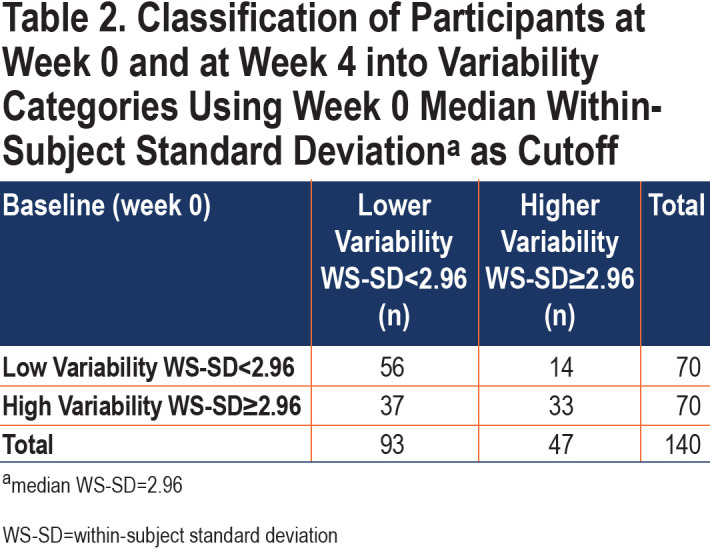
The median baseline (week 0) E-RS total WS-SD for all patients was 2.96. This value was used to dichotomize patients into lower variability versus higher variability groups for further study. There was poor agreement between Week 0 and Week 4 classifications, with a Cohen’s kappa of 0.27 (95% CI [0.12–0.42]). Between weeks 0 and 4, 36% of participants changed categories (Table 2) with the most common move from high variability at week 0 to low variability at week 4. Sensitivity analysis using a baseline period of 2 weeks rather than 1 demonstrated similar results.
We investigated overall trends in E-RS scores over the full 13-week study period, using mean E-RS total scores as a measure of overall symptom burden, and WS-SD as a measure of symptom variability. Mean WS-SD decreased by 11% (from 2.97 to 2.63) between Weeks 0 and 4 (p=0.002) (Figure E1 and E2 in the online supplement). This decrease attained statistical significance by Week 3 and was maintained throughout follow-up. When comparing Week 0 to Week 12, the mean WS-SD decreased 22%, to 2.23 (p<0.001). A large portion of the decrease occurred by Week 3, and almost no changes were detected between Weeks 6-12 (Table E2 in the online supplement).
Symptom Variability, Phenotypic Differences, and Exacerbations
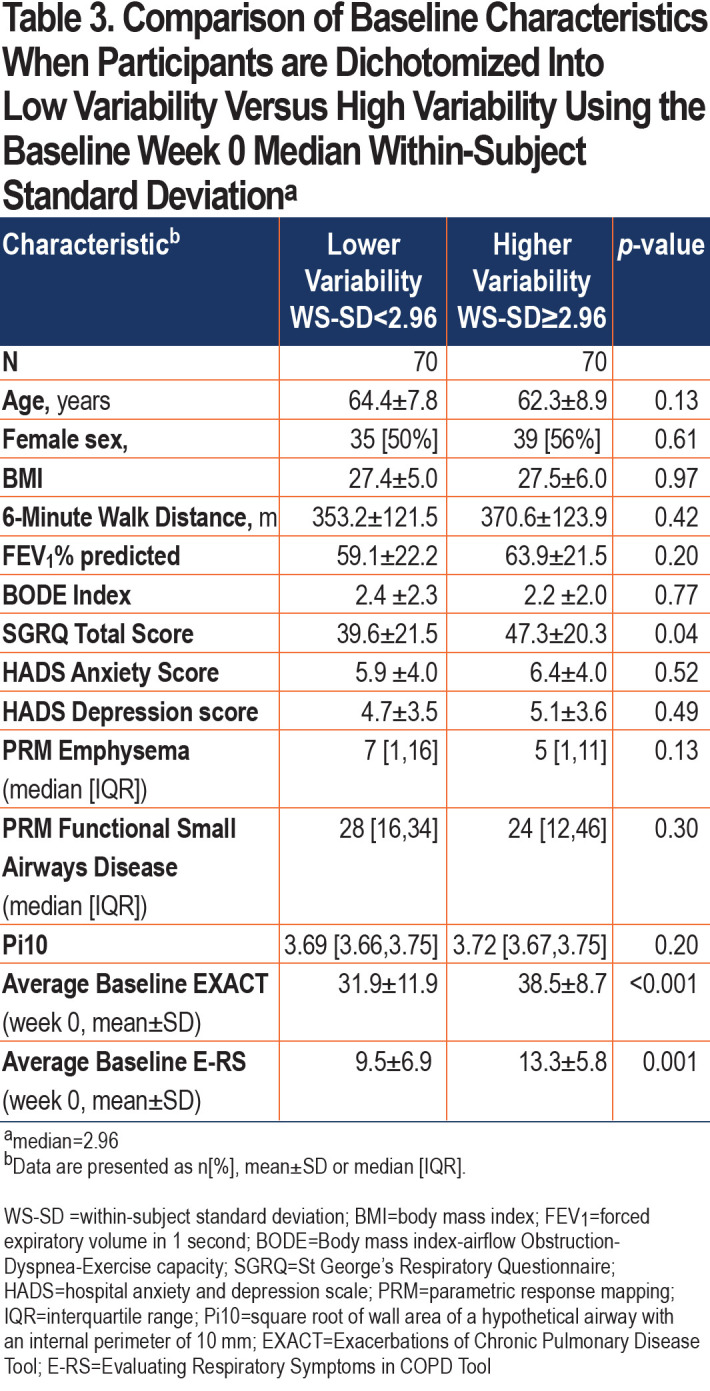
Patients in the high variability group had higher (worse) SGRQ scores (p=0.04) and higher (more severe symptoms) E-RS scores (p=0.001) during the baseline week (Table 3). Other phenotypic characteristics such as 6-minute walk distance, Body mass index-airway Obstruction-Dyspnea-Exercise tolerance (BODE) index, imaging characteristics, and comorbid anxiety and depression did not separate low versus high variability groups.
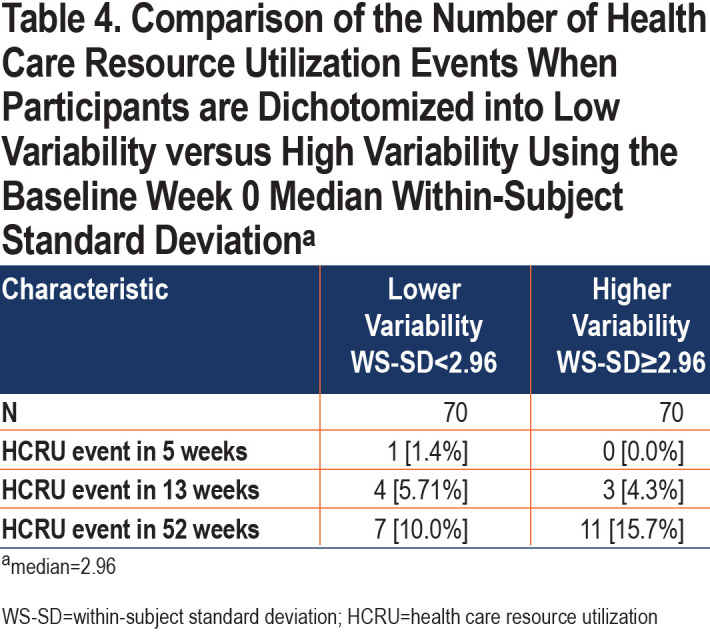
Additionally, we examined HCRU exacerbations in the participants included in our analysis. Only 1 participant experienced an HCRU exacerbation in the first 5 weeks of the study, 7 experienced an HCRU exacerbation in 13 weeks, and 18 in 52 weeks (Table 4). Participants were again divided into lower and higher variability based on an overall week 0 median WS-SD of 2.96. There were no differences in HCRU exacerbations between the low and high variability group at 13 weeks (5.7% versus 4.3%, p-value 1.0) and 52 weeks (10.0% versus 15.7%, p-value 0.45). In a sensitivity analysis, we also found that the mean baseline WS-SD was not different between those participants who experienced an HCRU versus those who did not (3.6 versus 3.0, p-value 0.44).
Higher baseline WS-SD was associated with an increased likelihood of an EXACT (symptom-defined) event (O =2.52; p=0.02) during the subsequent 4 weeks. EXACT events from 2 participants are illustrated in Figure E3in the online supplement. Even after adjusting for symptom severity (using mean baseline E-RS total score) and other potential confounders (sex, dyspnea score, 6-minute walk distance, and forced expiratory volume in 1 second [FEV1]), participants classified as having high baseline symptom variability had 2.75 greater odds of experiencing an EXACT event during the 4 weeks than individuals with low symptom variability (OR=2.75 [1.13–6.86], p=0.02).
Discussion
We used a novel approach for characterizing symptom variability in patients with COPD by using prospectively collected E-RS data from participants in the SPIROMICS Exacerbations sub-study. Our analyses demonstrate that: (1) the WS-SD of the E-RS total score performed similarly to other variability measures in that baseline values are only weakly associated with variability at week 4, (2) mean WS-SD scores decreased significantly throughout a 12-week follow-up period, primarily during the first half of follow-up, and (3) participants with higher baseline variability have increased symptom severity, although they do not demonstrate differences in other phenotypic markers compared to low variability participants. These findings provide novel insights into the patient experience in COPD.
Day-to-day symptom variability is itself variable over time, as evidenced by relatively low correlations between weeks 0 and 4 in 6 different E-RS score variability metrics. Coefficient of variation has the highest correlation between week 0 and week 4 values and could be used as a metric by which to compare the magnitude of symptom variability to variation in other measures. The Bland-Altman plots for all variability metrics have a similar shape, with better agreement among patients with overall lower variability compared to participants with larger differences between week 0 and week 4 values. The changes to symptom variation within patients over time calls into question one component of the traditional HCRU exacerbation definition, namely what constitutes a given patient’s typical day-to-day symptom variation and what aspect of worsening informs a patient’s decision to seek care. Importantly, the fluctuation in symptoms we show may have important implications when evaluating a response to therapy, especially in the absence of a control group as in n-of-1 experiments. The median E-RS total score WS-SD was 2.96 in our study. To contextualize these findings, thresholds for symptomatic improvement using the E-RS tool were developed with clinical trial data examining subgroups of patients who demonstrated improvement using established measures including the SGRQ and the Breathlessness, Cough and Sputum Scale as anchors. An overall decline in E-RS score by 2 points has been proposed as the threshold to define symptomatic improvement.15 With a median WS-SD of 2.96 in our study, we show that patients can exhibit day-to-day variation higher than proposed thresholds of symptomatic change meaningful to patients. This makes the longitudinal analysis of E-RS daily scores even more important, with persistent improvements in severity of 2 points or more needed to demonstrate improvement over time, taking into consideration day-to-day variability.
Interestingly, throughout this 5-week study period, E-RS total scores remained stable over time, while WS-SD decreased significantly, suggesting symptom severity overall is stable, while day-to-day variability is not. The stability of mean E-RS scores as a measure of symptom severity has been demonstrated in the past.24 Participants who were in the high variability group at week 0 were not always in the same variability group at week 4. These findings should be interpreted in the context of the fact that participants were only known to be stable and exacerbation free in the weeks prior to study entry. It is possible that an intervening change in therapy during a routine clinic visit or an HCRU event resulted in less variability with no effect on overall severity, though this is unlikely. It is also possibly that participant complacency or “settling on an average” occurs over time, to facilitate diary completion. The Hawthorne effect, where the knowledge that one is being observed leads to a change in behavior, could result in increased introspection and impact variability as the study progresses. Periodic reminders to patients to complete the diary thoughtfully and accurately could address this potential issue. It is noteworthy that even with the flattening of variability scores over time, mean symptom severity levels were stable and EXACT events were detected during the latter weeks of the study, with baseline variability a predictor of these events.
Our analysis suggests that individual symptom variability may be associated with increased morbidity. Patients with higher variability also had higher mean E-RS scores, i.e., more severe respiratory symptoms. Elevated SGRQ, a marker of exacerbation risk,25 was also found in the higher symptom variability group. Notably, we were unable to distinguish individuals with higher versus lower symptom variability using other phenotypic markers, suggesting that symptom variability may be a construct that is different from other physiological or imaging metrics.
While the small number of HCRU exacerbations limited our ability to determine an association between symptom variability and exacerbation using the traditional definition, we were able to explore an association between baseline day-to-day variation in symptoms and risk of developing periods of sustained symptom worsening (EXACT events). Should these findings be confirmed in larger samples, symptom variability could be a promising component of comprehensive patient assessment.
Our cohort had a higher rate of EXACT events compared to what has been previously reported in the literature.26,27 We hypothesize that the principal reason for this is due to differences in the patient population. The majority of longitudinal EXACT data have been reported in the context of placebo-controlled trials in patients meeting strict inclusion and exclusion criteria. Our patient population reflects a different opportunistic cohort with limited inclusion/exclusion criteria, perhaps closer to real-world data. Differences in approach to data collection also may influence the number of EXACT events. For example, in the FLAME randomized control trial,26 participants completed an electronic daily diary in addition to the daily EXACT. Diary responses in turn triggered the participant to respond to a clinical center, which may have led to more HCRU events relative to the number of unreported EXACT events.26
Our study has limitations, including a relatively small number of participants and, for WS-SD stability, a short study period of 5 weeks. Additionally, we did not have data regarding changes to individual treatment between week 0 and week 4 which may have affected symptom variability at week 4. A larger dataset over an extended period may allow for better characterization of longitudinal trends in variability. Requiring a high completion rate of the E-RS/EXACT diary may have resulted in selection bias in this natural history study, with only the most adherent participants included. We also did not have daily criteria measures to assist with the evaluation of stability, such as global assessments, alternative symptom diaries, or activity monitors.
In summary, ostensibly stable COPD individuals experience wide temporal variability in respiratory symptoms. Using common statistical techniques such as WS-SD to quantify day-to-day variability can lead to further insight into the association between symptom fluctuation, symptom severity, and future exacerbations. Determining the utility of the E-RS variability metric to quantify day-to-day symptom variability in COPD will require study of more individuals over a longer follow-up period and using additional modes of symptom measurement.
Abbreviations
Abbreviations: SubPopulations and InteRmediate Outcome Measures In COPD Study, SPIROMICS; Evaluating Respiratory Symptoms in COPD, E-RS; within-subject standard deviation, WS-SD; St George’s Respiratory Questionnaire, SGRQ; patient-reported outcome, PRO; Exacerbations in Chronic Pulmonary Disease Tool, EXACT; square root of the wall area of a hypothetical airway with an internal perimeter of 10 mm, Pi10; health care resource utilization, HCRU; interquartile range, IQR; modified Medical Research Council, mMRC; Pittsburgh Sleep Quality Index, PSQ; hospital anxiety and depression scale, HADS; parametric response mapping, PRM; Global initiative for chronic Obstructive Lung Disease, GOLD; confidence interval, CI; correlation, corr; Body mass index-airway Obstruction-Dyspnea-Exercise capacity, BODE
Funding Statement
The SubPopulations and InteRmediate Outcome Measures In COPD Study (SPIROMICS) was supported by contracts from the National Institutes of Health (NIH) / National Heart, Lung, and Blood Institute (NHLBI) (HHSN268200900013C, HHSN268200900014C, HHSN268200900015C, HHSN268200900016C, HHSN268200900017C, HHSN268200900018C, HHSN268200900019C, HHSN268200900020C), grants from the NIH/NHLBI (U01 HL137880 and U24 HL141762), and supplemented by contributions made through the Foundation for the NIH and the COPD Foundation from AstraZeneca/MedImmune, Bayer, Bellerophon Therapeutics, Boehringer-Ingelheim Pharmaceuticals, Inc., Chiesi Farmaceutici S.p.A., Forest Research Institute, Inc., GlaxoSmithKline, Grifols Therapeutics, Inc., Ikaria, Inc., Novartis Pharmaceuticals Corporation, Nycomed GmbH, ProterixBio, Regeneron Pharmaceuticals, Inc., Sanofi, Sunovion, Takeda Pharmaceutical Company, and Theravance Biopharma and Mylan. Dr. Krishnan is supported by the NIH T32 HL134629.
References
- 1.Vogelmeier CF,Criner GJ,Martinez FJ,et al. Global strategy for the diagnosis, management, and prevention of chronic obstructive lung disease, 2017 report. GOLD executive summary. Am J Respir Crit Care Med. 2017;195(5):557-582. doi: https://doi.org/10.1164/rccm.201701-0218PP [DOI] [PubMed] [Google Scholar]
- 2.Partridge MR,Karlsson N,Small IR. Patient insight into the impact of chronic obstructive pulmonary disease in the morning: an internet survey. Curr Med Res Opin. 2009;25(8):2043-2048. doi: https://doi.org/10.1185/03007990903103006 [DOI] [PubMed] [Google Scholar]
- 3.O'Hagan P,Chavannes NH. The impact of morning symptoms on daily activities in chronic obstructive pulmonary disease. Curr Med Res Opin. 2014;30(2):301-314. doi: https://doi.org/10.1185/03007995.2013.857648 [DOI] [PubMed] [Google Scholar]
- 4.Kessler R,Partridge MR,Miravitlles M,et al. Symptom variability in patients with severe COPD: a pan-European cross-sectional study. Eur Respir J. 2011;37(2):264-272. doi: https://doi.org/10.1183/09031936.00051110 [DOI] [PubMed] [Google Scholar]
- 5.Kuyucu T,Güçlü SZ,Saylan B,et al. A cross-sectional observational study to investigate daily symptom variability, effects of symptom on morning activities and therapeutic expectations of patients and physicians in COPD-SUNRISE study. Tuberk Toraks. 2011;59:328-339. doi: https://doi.org/10.5578/tt.3268 [DOI] [PubMed] [Google Scholar]
- 6.Kim YJ,Lee BK,Jung CY,et al. Patient's perception of symptoms related to morning activity in chronic obstructive pulmonary disease: the SYMBOL Study. Korean J Intern Med. 2012;27(4):426-435. doi: https://doi.org/10.3904/kjim.2012.27.4.426 [DOI] [PMC free article] [PubMed] [Google Scholar]
- 7.Roche N,Small M,Broomfield S,Higgins V,Pollard R. Real world COPD: association of morning symptoms with clinical and patient reported outcomes. COPD. 2013;10(6):679-686. doi: https://doi.org/10.3109/15412555.2013.844784 [DOI] [PubMed] [Google Scholar]
- 8.Miravitlles M,Worth H,Soler Cataluña JJ,et al. Observational study to characterise 24-hour COPD symptoms and their relationship with patient-reported outcomes: results from the ASSESS study. Respir Res. 2014;15:122. doi: https://doi.org/10.1186/s12931-014-0122-1 [DOI] [PMC free article] [PubMed] [Google Scholar]
- 9.McCarley C,Hanneman SK,Padhye N,Smolensky MH. A pilot home study of temporal variations of symptoms in chronic obstructive lung disease. Biol Res Nurs. 2007;9(1):8-20. doi: https://doi.org/10.1177/1099800407303501 [DOI] [PubMed] [Google Scholar]
- 10.Espinosa de los Monteros MJ,Peña C,Soto Hurtado EJ,Jareño J,Miravitlles M. Variability of respiratory symptoms in severe COPD. Arch Bronconeumol. 2012;48(1):3-7. doi: https://doi.org/10.1016/j.arbr.2011.07.006 [DOI] [PubMed] [Google Scholar]
- 11.Price D,Small M,Milligan G,Higgins V,Gil EG,Estruch J. Impact of night-time symptoms in COPD: a real-world study in five European countries. Int J Chron Obstruct Pulmon Dis. 2013;8:595-603. doi: https://doi.org/10.2147/COPD.S48570 [DOI] [PMC free article] [PubMed] [Google Scholar]
- 12.Miravitlles M,Izquierdo JL,Esquinas C,et al. The variability of respiratory symptoms and associated factors in COPD. Respir Med. 2017;129:165-172. doi: https://doi.org/10.1016/j.rmed.2017.06.017 [DOI] [PubMed] [Google Scholar]
- 13.Couper D,LaVange LM,Han M,et al. Design of the subpopulations and intermediate outcomes in COPD study (SPIROMICS). Thorax. 2014;69:491-494. doi: https://doi.org/10.1136/thoraxjnl-2013-203897 [DOI] [PMC free article] [PubMed] [Google Scholar]
- 14.Leidy NK,Sexton CC,Jones PW,et al. Measuring respiratory symptoms in clinical trials of COPD: reliability and validity of a daily diary. Thorax. 2014;69(5):443-449. doi: https://doi.org/10.1136/thoraxjnl-2013-204428 [DOI] [PMC free article] [PubMed] [Google Scholar]
- 15.Leidy NK,Murray LT,Monz BU,et al. Measuring respiratory symptoms of COPD: performance of the EXACT- Respiratory Symptoms Tool (E-RS) in three clinical trials. Respir Res. 2014;15:124. doi: https://doi.org/10.1186/s12931-014-0124-z [DOI] [PMC free article] [PubMed] [Google Scholar]
- 16.Nelsen LM,Lee LA,Wu W,et al. Reliability, validity and responsiveness of E-RS:COPD in patients with spirometric asthma-COPD overlap. Respir Res. 2019;20:107. doi: https://doi.org/10.1186/s12931-019-1070-6 [DOI] [PMC free article] [PubMed] [Google Scholar]
- 17.Bushnell DM,Wilson R,Gutzwiller FS,et al. Use of the evaluating respiratory symptomsTM in COPD as an outcome measure in clinical trials: A rapid systematic review. Chronic Obstr Pulm Dis. 2021;8(4):551-571. doi: https://doi.org/10.15326/jcopdf.2021.0235 [DOI] [PMC free article] [PubMed] [Google Scholar]
- 18.White SE. Summarizing data & presenting data in tables & graphs. In: White SE, eds. Basic & Clinical Biostatistics 5th Ed McGraw-Hill Education. 2020. http://accessmedicine.mhmedical.com/content.aspx?aid=1176051677
- 19.Ancy KM,Oromendia C,Ballman KV,et al. Quantifying symptom variability in COPD: exploratory analysis utilizing evaluating respiratory symptoms (e-Rs) in spiromics. Am J Respir Crit Care Med. 2017;195:A3658. https://www.atsjournals.org/doi/abs/10.1164/ajrccm-conference.2017.195.1_MeetingAbstracts.A3658 [Google Scholar]
- 20.Han MK,Quibrera PM,Carretta EE,et al. Frequency of exacerbations in patients with chronic obstructive pulmonary disease: an analysis of the SPIROMICS cohort. Lancet Respir Med. 2017;5(8):619-626. doi: https://doi.org/10.1016/S2213-2600(17)30207-2 [DOI] [PMC free article] [PubMed] [Google Scholar]
- 21.Leidy NK,Murray LT. Patient-reported outcome (PRO) measures for clinical trials of COPD: the EXACT and E-RS. COPD. 2013;10(3):393-398. doi: https://doi.org/10.3109/15412555.2013.795423 [DOI] [PubMed] [Google Scholar]
- 22.Leidy NK,Murray LT,Jones P,Sethi S. Performance of the EXAcerbations of chronic pulmonary disease tool patient-reported outcome measure in three clinical trials of chronic obstructive pulmonary disease. Ann Am Thorac Soc. 2014;11(3):316-325. doi: https://doi.org/10.1513/AnnalsATS.201309-305OC [DOI] [PubMed] [Google Scholar]
- 23.Leidy NK,Wilcox TK,Jones PW,et al. Standardizing measurement of chronic obstructive pulmonary disease exacerbations. Reliability and validity of a patient-reported diary. Am J Respir Crit Care Med. 2011;183(3):323-329. doi: https://doi.org/10.1164/rccm.201005-0762OC [DOI] [PubMed] [Google Scholar]
- 24.Bowler R,Allinder M,Jacobson S,et al. Real-world use of rescue inhaler sensors, electronic symptom questionnaires and physical activity monitors in COPD. BMJ Open Respir Res. 2019;6(1):e000350. doi: https://doi.org/10.1136/bmjresp-2018-000350 [DOI] [PMC free article] [PubMed] [Google Scholar]
- 25.Müllerova H,Gelhorn H,Wilson H,et al. St George's respiratory questionnaire score predicts outcomes in patients with COPD: analysis of individual patient data in the COPD biomarkers qualification consortium database. Chronic Obstr Pulm Dis. 2017;4(2):141-149. doi: https://doi.org/10.15326/jcopdf.4.2.2017.0131 [DOI] [PMC free article] [PubMed] [Google Scholar]
- 26.Frent SM,Chapman KR,Larbig M,et al. Capturing exacerbations of chronic obstructive pulmonary disease with EXACT. A Subanalysis of FLAME. Am J Respir Crit Care Med. 2019;199(1):43-51. doi: https://doi.org/10.1164/rccm.201801-0038OC [DOI] [PMC free article] [PubMed] [Google Scholar]
- 27.Jones PW,Lamarca R,Chuecos F,et al. Characterisation and impact of reported and unreported exacerbations: results from ATTAIN. Eur Respir J. 2014;44(5):1156-1165. doi: https://doi.org/10.1183/09031936.00038814 [DOI] [PubMed] [Google Scholar]
Associated Data
This section collects any data citations, data availability statements, or supplementary materials included in this article.
Supplementary Materials
This article contains supplemental material.


