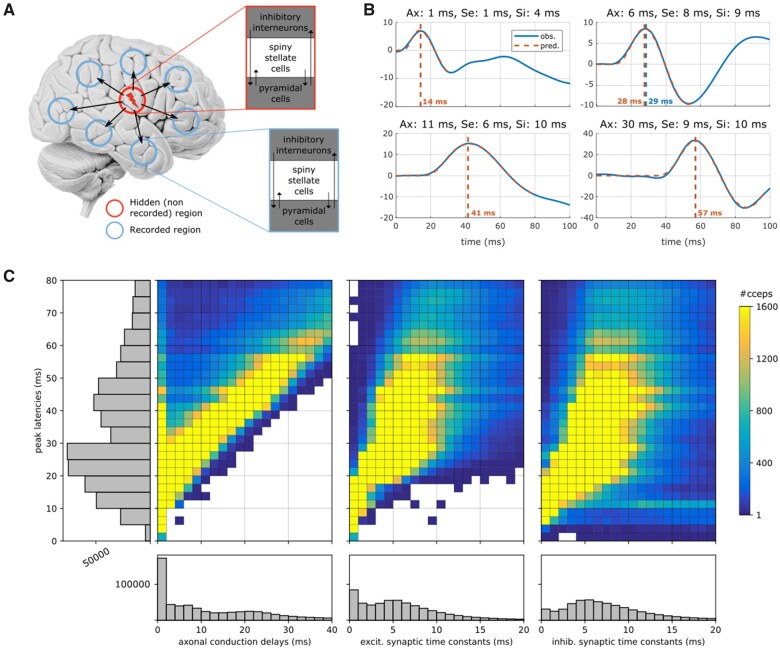
Figure 1.
Estimation of CCEPs neuronal parameters at the individual level. (A) Architecture of the generative model underlying the early N1 component of CCEPs. Each of the stimulation (red circle) and recording (blue circles) sites are modelled with local neural mass models. Following a transient bipolar stimulation and for a sufficient charge level (product of pulse intensity and duration), action potentials initiated in the stimulated region propagate via orthodromic projections to connected regions, where significant responses are recorded. (B) Model predictions (red) of CCEP observations (blue) for increasing N1 peak latencies (vertical line). Estimated axonal conduction delays (Ax), excitatory (Se) and inhibitory (Si) synaptic time constants are indicated on top of each panel. (C) Distribution of the estimated neuronal delays. The main panels (coloured 2D histograms) represent the joint distribution of the axonal conduction delays (left), excitatory (middle) and inhibitory (right) synaptic time constants (horizontal axes) according to the N1 peak latency (vertical axis). White colour indicates an absence of data. The side panels (grey 1D histograms) show the marginal distributions of the N1 peak latencies (vertical plot on the left) and of each neuronal parameter (horizontal plots at the bottom).

