

Key Points
Question
Do urine drug test (UDT) results correlate with overdose mortality rates?
Findings
In this cross-sectional study of 500 000 unique urine specimens collected from substance use disorder treatment practices, UDT results for 5 drug categories were correlated with overdose mortality rates at national, state, and county levels. Correlation was strongest for synthetic opioids and methamphetamine, and multivariate regression analysis using state-level data revealed that synthetic opioid and methamphetamine UDT positivity rates were significantly associated with overdose deaths.
Meaning
This study’s findings suggest that UDT is a valuable data source that is capable of informing real-time surveillance efforts.
Abstract
Importance
Drug overdose deaths in the US are currently the highest ever recorded; data collected from public health surveillance sources can help to identify emerging drug use patterns associated with overdose mortality rates, but the time lag in results often limits utility. Urine drug testing (UDT) is one potentially underused source that could augment surveillance efforts through timely data collection.
Objective
To evaluate the correlation between real-time UDT results from a proprietary national database and overdose mortality data from the National Vital Statistics System.
Design, Setting, and Participants
This retrospective cross-sectional study included 500 000 urine specimens submitted for UDT by substance use disorder (SUD) treatment health care practices and collected between January 1, 2013, and December 31, 2020. Real-time UDT data were obtained from the Millennium Health proprietary national database, and overdose mortality data were obtained from the National Vital Statistics System of the Centers for Disease Control and Prevention (CDC WONDER). Specimens were analyzed for specific drugs in 5 categories (cocaine, heroin, methamphetamine, synthetic opioids, and other opioids) using liquid chromatography–tandem mass spectrometry. Participants were adults aged 18 years and older who provided urine specimens at SUD treatment practices.
Exposures
Urine drug testing.
Main Outcomes and Measures
The primary outcome was the correlation between UDT positivity rates and overdose mortality rates at national, state, and county levels. Univariate and multivariate regression models were also used to evaluate the association between state- and county-level overdose mortality and standardized UDT positivity rates.
Results
Among 500 000 unique patient specimens collected from SUD treatment practices between 2013 and 2020, 288 534 specimens (57.7%) were from men, and the median age of the study population was 34 years (IQR, 17-51 years). On a national level, synthetic opioids and methamphetamine were highly correlated with overdose mortality (Spearman ρ = 0.96 for both). When synthetic opioids were coinvolved, methamphetamine (ρ = 0.98), heroin (ρ = 0.78), cocaine (ρ = 0.94), and other opioids (ρ = 0.83) were also highly correlated with overdose mortality. In the absence of synthetic opioids, all drug categories were highly correlated (ρ = 0.75 for other opioids, 0.81 for heroin, and 0.88 for methamphetamine), with the exception of cocaine (ρ = −0.37). Synthetic opioids (ρ = 0.77) and methamphetamine (ρ = 0.80) had the strongest state-level correlations over time, whereas other opioids had the lowest correlation for both total positivity (ρ = 0.31) and positivity in the absence of synthetic opioids (ρ = 0.23). In Ohio, county-level correlation was strongest for synthetic opioids (ρ = 0.71), followed by heroin (ρ = 0.69) and methamphetamine (ρ = 0.67). At the state level, the multivariate incidence rate ratio (IRR) for synthetic opioids was 1.16 (95% CI, 1.14-1.19; P < .001), and at the county level, the IRR was 1.13 (95% CI, 1.09-1.17; P < .001), suggesting that for every 1-SD increase in the UDT positivity rate, there were 16.2% and 12.8% increases, respectively, in monthly overdose deaths. Both methamphetamine (11.7% increase per 1-SD increase in UDT positivity rate; IRR, 1.12; 95% CI, 1.09-1.14; P < .001) and cocaine (5.1% increase per 1-SD increase in UDT positivity rate; IRR, 1.05; 95% CI, 1.03-1.07; P < .001) also had significant positive associations with mortality rates, but the effect sizes were smaller than that of synthetic opioids (IRR, 1.16).
Conclusions and Relevance
In this study, UDT results were highly correlated with mortality rates at national, state, and county levels. These findings suggest that real-time UDT surveillance can help to quickly identify changes in drug use patterns that might inform targeted harm reduction strategies designed to prevent overdose deaths.
This cross-sectional study evaluates the correlation between real-time urine drug test results from a proprietary national database and overdose mortality rates from the National Vital Statistics System among US adults between 2013 and 2020.
Introduction
Despite the enactment of essential multipronged public health strategies aimed at reducing drug overdose deaths,1,2,3 more people in the US died of drug overdoses in 2020 than in any previously recorded year,4 increasing 30% since 2019. Deaths involving synthetic opioids, stimulants, and prescription opioids increased between 2019 and 2020, whereas heroin-involved deaths decreased.4 The coinvolvement of synthetic opioids across all drug categories also increased, generating concerns about polysubstance use.5 These statistics suggest that additional measures are needed to reduce the harmful impact of substance use.
One priority identified by the US Department of Health and Human Services is the need to strengthen epidemiological efforts through data-based public health surveillance.6 Data sources include poison control centers, emergency departments, electronic health records, and crime laboratories7,8,9,10; data from some of these sources have been correlated with drug overdose mortality.10,11,12,13,14 For example, an increase in synthetic opioids identified in crime laboratory data was strongly correlated with drug overdose deaths in Ohio counties.10
Another data source that can potentially identify drug use patterns in communities is urine drug test (UDT) results. There are primarily 2 types of UDT technologies: immunoassay and mass spectrometry.15 Compared with immunoassay, mass spectrometry (eg, liquid chromatography–tandem mass spectrometry [LC-MS/MS]) is a more accurate method of detecting specific drugs and metabolites at quantitative levels.15 National UDT guidelines have established recommendations for the use of LC-MS/MS in the clinical setting.15,16,17,18
The objective of this cross-sectional study was to use the Millennium Health proprietary national database of real-time UDT results to evaluate the correlation between UDT results collected in a substance use disorder (SUD) treatment setting and overdose mortality data identified in the National Vital Statistics System of the Centers for Disease Control and Prevention (CDC WONDER).4 Although UDT data can help to track timely changes in substance use,19,20,21,22 no studies, to our knowledge, have evaluated the correlation between a national database of UDT results and overdose mortality rates. Establishing the association of specific UDT results with overdose mortality rates would provide a foundation to explore whether real-time drug use surveillance data can be used to inform emerging patterns in risk of drug-specific overdose mortality that might allow for more agile responses to harm reduction and fewer overdose deaths. We hypothesized that emerging patterns in opioid and stimulant drug use captured in aggregated UDT results would correlate with overdose deaths.
Methods
Data Source and Sample Selection
Urine Drug Testing
We conducted a retrospective cross-sectional study of UDT results collected from patients between January 1, 2013, and December 31, 2020. Drug testing was ordered by clinicians who specialized in SUD treatment and was based on medical necessity. Ordered UDT results were obtained from all 50 US states. Specimens were analyzed using LC-MS/MS. The LC-MS/MS assays used were laboratory developed, with performance characteristics determined by Millennium Health in San Diego, California. Millennium Health is certified by the Clinical Laboratory Improvement Amendments and accredited for high-complexity testing by the College of American Pathologists. The study protocol was approved by the Aspire Independent Review Board (Santee, California) with a waiver of informed consent because of the use of deidentified data. This study followed the Strengthening the Reporting of Observational Studies in Epidemiology (STROBE) reporting guideline for cross-sectional studies.
To align with the National Vital Statistics System (CDC WONDER) multiple cause of death (MCD) mortality files,23 we selected the following 5 drug categories for analysis (with tested analytes given in parentheses): cocaine (benzoylecgonine), heroin (6-monoacetylmorphine), methamphetamine (methamphetamine), synthetic opioids (fentanyl, N-desmethyl-tramadol, norfentanyl, O-desmethyl-tramadol, and tramadol), and other opioids (codeine, hydrocodone, hydromorphone, morphine, norhydrocodone, noroxycodone, oxycodone, and oxymorphone). If any parent drug or metabolite within a category was detected, the category was considered to have positivity for that specimen. A list of prescribed medications for each study participant was noted on the requisition form by the clinician ordering the UDT. We excluded patients with positive test results for cocaine, fentanyl, methamphetamine, tramadol, or other opioids that were reported by clinicians to be currently prescribed to patients.
A single specimen for each patient 18 years of age or older was selected based on the earliest specimen collection date to remove repeated measurements. A total of 500 000 unique patients from the Millennium Health proprietary UDT database were randomly selected with equal probability, and their data were used for subsequent analyses. Monthly, quarterly, and yearly total UDT positivity rates were calculated for each of the 5 drug categories. Drug positivity rates were further stratified by codetection of synthetic opioids and by the state or county of the patient’s residence.
Overdose Mortality Data
Drug overdose deaths were identified in the CDC WONDER MCD mortality files23 by using the International Statistical Classification of Diseases and Related Health Problems, Tenth Revision (ICD-10), underlying cause of death codes, including codes for unintentional death (X40–X44), suicide (X60–X64), homicide (X85), and death with undetermined intent (Y10–Y14). Stratification by drug involvement was defined using the following ICD-10 MCD codes: cocaine (T40.5), heroin (T40.1), methamphetamine (psychostimulants with abuse potential; T43.6), synthetic opioids (T40.4), and other opioids (T40.2). Overdose deaths from January 1, 2013, to December 31, 2019, were examined and stratified by state, MCD drug category, and synthetic opioid coinvolvement. Raw death rates were reported per 100 000 people. Yearly population estimates were used for both monthly and yearly mortality rates.24 Overdose deaths of fewer than 10 per period and/or region are masked in the CDC WONDER database.
Ohio resident county-level provisional overdose deaths (2013-2020) were collected from the Ohio Department of Public Health website on October 8, 2021.25 Stratification by coinvolvement of the 5 drug categories was performed, and monthly overdose deaths were summed quarterly for analysis. The Ohio Department of Public Health does not mask county overdose mortality estimates based on a low-threshold number of deaths. All overdose mortality rates are available in eTable 1 in the Supplement.
Race and ethnicity were not considered in the current analysis due to a lack of corresponding attributes in the UDT positivity data. Other demographic characteristics, such as sex and age, were also not considered.
Statistical Analysis
Correlation analyses were performed to understand the correlation between overdose mortality and drug-specific UDT measures at the national, state, and county levels. Univariate and multivariate regression models were used to assess the independent (univariate) and additive relative associations of each UDT rate with overall overdose mortality rates.
Correlation of UDT Positivity With Overdose Mortality Rates
Spearman ρ was used to estimate the correlation between corresponding UDT results and overdose mortality rates. Correlations were performed at the national, state, and county levels. States were required to have data for both overdose and UDT rates for all 7 years (2013-2019) for all 5 drug categories, and the mean number of UDT patient specimens for each state had to equal or exceed 100 for the same strata. This filtering ensured that only states with sufficient population size, mortality rate, and UDT sample volume were included. County-level analysis was based on Ohio counties that had data on both overdose and UDT rates for all 8 years (2013-2020) for all 5 drug categories, and the mean number of UDT patient specimens for each county had to equal or exceed 20 for the same strata.
Statistical Modeling of Overdose Deaths
Poisson regression analysis was used to model total overdose deaths at the state and county levels without stratification by drug class. Regression models included standardized (mean [SD], 0 [1]) total monthly UDT positivity rates for all 5 drug categories as continuous explanatory variables and total overdose deaths as the dependent variable. State-level models included the state as a categorical variable to account for state-level differences in mortality. County-level models also used all 5 drug rates calculated per quarter (32 total quarters) as continuous explanatory variables. County was added as a categorical covariate with a function similar to that of the state models. Both multivariate models (with UDT rates for all 5 drug categories included) and univariate models (with each UDT drug rate modeled separately) were evaluated. Population size (log transformed) was used as an offset variable in all models. Standard error estimates were robust (sandwich estimates) to account for mild distributional violations. Incidence rate ratios (IRRs) with 95% CIs were reported. Data were analyzed using R software, version 4.0.3 (R Foundation for Statistical Computing). Statistical significance was set at P < .05; all tests were 2-tailed.
Results
Urine Drug Test Characteristics
A total of 500 000 unique patient specimens were collected from SUD treatment practices; 288 534 specimens (57.7%) were from men, and 211 466 (42.3%) were from women, with a median age of 34 years (IQR, 17-51 years). A total of 261 998 specimens (52.4%) were from patients younger than 35 years (Table 1). Most referring health care practices were in the East North Central (116 716 practices [23.3%]), Pacific (96 948 practices [19.4%]), and South Atlantic (86 732 practices [17.3%]) US census regions. The UDT positivity rates ranged from 27 278 specimens (5.5%) for heroin to 105 966 specimens (21.2%) for other opioids. The number of specimens analyzed per year varied from 51 130 in 2017 to 89 503 in 2015.
Table 1. Characteristics of Urine Drug Test Specimens, 2013-2020.
| Characteristic | No. (%) | ||||||||
|---|---|---|---|---|---|---|---|---|---|
| Total 2013-2020a | 2013 | 2014 | 2015 | 2016 | 2017 | 2018 | 2019 | 2020 | |
| Unique patient specimens, No. | 500 000 | 57 977 | 70 046 | 89 503 | 66 328 | 51 130 | 51 846 | 58 452 | 54 718 |
| Sex | |||||||||
| Female | 211 466 (42.3) | 23 601 (40.7) | 28 512 (40.7) | 38 245 (42.7) | 28 865 (43.5) | 21 843 (42.7) | 22 221 (42.9) | 25 379 (43.4) | 22 800 (41.7) |
| Male | 288 534 (57.7) | 34 376 (59.3) | 41 534 (59.3) | 51 258 (57.3) | 37 463 (56.5) | 29 287 (57.3) | 29 625 (57.1) | 33 073 (56.6) | 31 918 (58.3) |
| Age, y | |||||||||
| Median (IQR) | 34 (17-51) | 31 (16-46) | 33 (18-48) | 33 (17-49) | 34 (17-51) | 34 (17-51) | 35 (17-53) | 35 (16-54) | 35 (16-54) |
| Range | |||||||||
| 18-24 | 79 196 (15.8) | 14 767 (25.5) | 14 850 (21.2) | 15 429 (17.2) | 10 168 (15.3) | 7028 (13.7) | 5967 (11.5) | 5696 (9.7) | 5291 (9.7) |
| 25-34 | 182 802 (36.6) | 19 581 (33.8) | 24 187 (34.5) | 33 301 (37.2) | 25 012 (37.7) | 19 315 (37.8) | 19 652 (37.9) | 21 622 (37.0) | 20 132 (36.8) |
| 35-44 | 118 601 (23.7) | 10 871 (18.8) | 13 728 (19.6) | 19 394 (21.7) | 15 456 (23.3) | 12 626 (24.7) | 13 796 (26.6) | 16 782 (28.7) | 15 948 (29.1) |
| 45-54 | 74 597 (14.9) | 8244 (14.2) | 11 113 (15.9) | 13 544 (15.1) | 9887 (14.9) | 7529 (14.7) | 7532 (14.5) | 8715 (14.9) | 8033 (14.7) |
| ≥55 | 44 804 (9.0) | 4514 (7.8) | 6168 (8.8) | 7835 (8.8) | 5805 (8.8) | 4632 (9.1) | 4899 (9.4) | 5637 (9.6) | 5314 (9.7) |
| US census regionb | |||||||||
| East North Central | 116 716 (23.3) | 9970 (17.2) | 9488 (13.5) | 19 693 (22.0) | 12 873 (19.4) | 9489 (18.6) | 16 285 (31.4) | 21 616 (37.0) | 17 302 (31.6) |
| East South Central | 41 180 (8.2) | 1741 (3.0) | 3096 (4.4) | 5892 (6.6) | 4971 (7.5) | 5541 (10.8) | 6604 (12.7) | 6425 (11.0) | 6910 (12.6) |
| Mid-Atlantic | 45 869 (9.2) | 9791 (16.9) | 15 193 (21.7) | 9647 (10.8) | 5152 (7.8) | 2509 (4.9) | 1409 (2.7) | 1511 (2.6) | 657 (1.2) |
| Mountain | 38 667 (7.7) | 6921 (11.9) | 4369 (6.2) | 3829 (4.3) | 3386 (5.1) | 3263 (6.4) | 2852 (5.5) | 4762 (8.1) | 9285 (17.0) |
| New England | 15 568 (3.1) | 4083 (7.0) | 2205 (3.1) | 3932 (4.4) | 1743 (2.6) | 1469 (2.9) | 777 (1.5) | 794 (1.4) | 565 (1.0) |
| Pacific | 96 948 (19.4) | 7448 (12.8) | 9514 (13.6) | 13 277 (14.8) | 14 855 (22.4) | 15 711 (30.7) | 14 924 (28.8) | 12 408 (21.2) | 8811 (16.1) |
| South Atlantic | 86 732 (17.3) | 15 237 (26.3) | 19 773 (28.2) | 19 819 (22.1) | 9897 (14.9) | 5989 (11.7) | 4784 (9.2) | 6051 (10.4) | 5182 (9.5) |
| West North Central | 40 483 (8.1) | 1765 (3.0) | 4742 (6.8) | 9884 (11.0) | 10 706 (16.1) | 4322 (8.5) | 2331 (4.5) | 3112 (5.3) | 3621 (6.6) |
| West South Central | 17 837 (3.6) | 1021 (1.8) | 1666 (2.4) | 3530 (3.9) | 2745 (4.1) | 2837 (5.5) | 1880 (3.6) | 1773 (3.0) | 2385 (4.4) |
| Nonprescribed or illicit drug positivity | |||||||||
| Cocaine | 48 853 (9.8) | 4602 (7.9) | 7678 (11.0) | 9168 (10.2) | 5975 (9.0) | 4889 (9.6) | 4808 (9.3) | 6344 (10.9) | 5389 (9.8) |
| Synthetic opioids | 41 267 (8.3) | 1241 (2.1) | 2591 (3.7) | 5287 (5.9) | 4789 (7.2) | 4337 (8.5) | 4940 (9.5) | 7633 (13.1) | 10 449 (19.1) |
| Heroin | 27 278 (5.5) | 2337 (4.0) | 4410 (6.3) | 6288 (7.0) | 3677 (5.5) | 2484 (4.9) | 2809 (5.4) | 2680 (4.6) | 2593 (4.7) |
| Methamphetamine | 55 327 (11.1) | 1259 (2.2) | 2690 (3.8) | 6263 (7.0) | 7626 (11.5) | 7664 (15.0) | 8463 (16.3) | 9897 (16.9) | 11 465 (21.0) |
| Other opioids | 105 966 (21.2) | 12 513 (21.6) | 17 662 (25.2) | 23 685 (26.5) | 14 706 (22.2) | 9878 (19.3) | 9150 (17.6) | 9569 (16.4) | 8803 (16.1) |
Specimens were tested between January 1, 2013, and December 31, 2020.
New England region includes Connecticut, Maine, Massachusetts, New Hampshire, Rhode Island, and Vermont. Mid-Atlantic region includes New Jersey, New York, and Pennsylvania. East North Central region includes Illinois, Indiana, Michigan, Ohio, and Wisconsin. West North Central region includes Iowa, Kansas, Minnesota, Missouri, Nebraska, North Dakota, and South Dakota. South Atlantic region includes Delaware, Florida, Georgia, Maryland, North Carolina, South Carolina, Virginia, and West Virginia. East South Central region includes Alabama, Kentucky, Mississippi, and Tennessee. West South Central region includes Arkansas, Louisiana, Oklahoma, and Texas. Mountain region includes Arizona, Colorado, Idaho, Montana, Nevada, New Mexico, Utah, and Wyoming. Pacific region includes Alaska, California, Hawaii, Oregon, and Washington.
Correlation at the National Level
Since 2013, overdose deaths associated with cocaine, heroin, methamphetamine, and other opioids increased when found in conjunction with synthetic opioids (Figure 1, dark blue line). In contrast, since 2016, overdose deaths associated with all of these drugs, with the exception of methamphetamine, decreased or remained stable when synthetic opioids were absent (Figure 1, light blue line). In general, UDT positivity rates aligned with overdose mortality data (Figure 1, light and dark orange lines). Overall, UDT positivity for total synthetic opioids increased from 2.1% in 2013 to 19.1% in 2020 (a 792.5% increase) (eTable 2 in the Supplement). This increase was, in part, associated with coinvolvement with other drugs and was greatest for co-occurrence with other opioids (from 1.1% in 2013 to 9.2% in 2020) and methamphetamine (from 0.1% in 2013 to 7.9% in 2020) over the study period. As observed with overdose deaths, UDT positivity in the absence of synthetic opioids decreased for all drug categories from 2013 to 2020 (7.7% to 4.7% for cocaine; 3.9% to 1.6% for heroin; 20.5% to 6.9% for other opioids) with the exception of methamphetamine (2.1% to 13.1%). Coinvolvement of synthetic opioids for all 4 drug categories increased between 2019 and 2020, with methamphetamine having the largest increase at 98.7% (from 4.0% to 7.9%) (eTable 2 in the Supplement).
Figure 1. Monthly US Overdose Mortality and Urine Drug Test (UDT) Positivity Rates Stratified by Codetection of Synthetic Opioids.
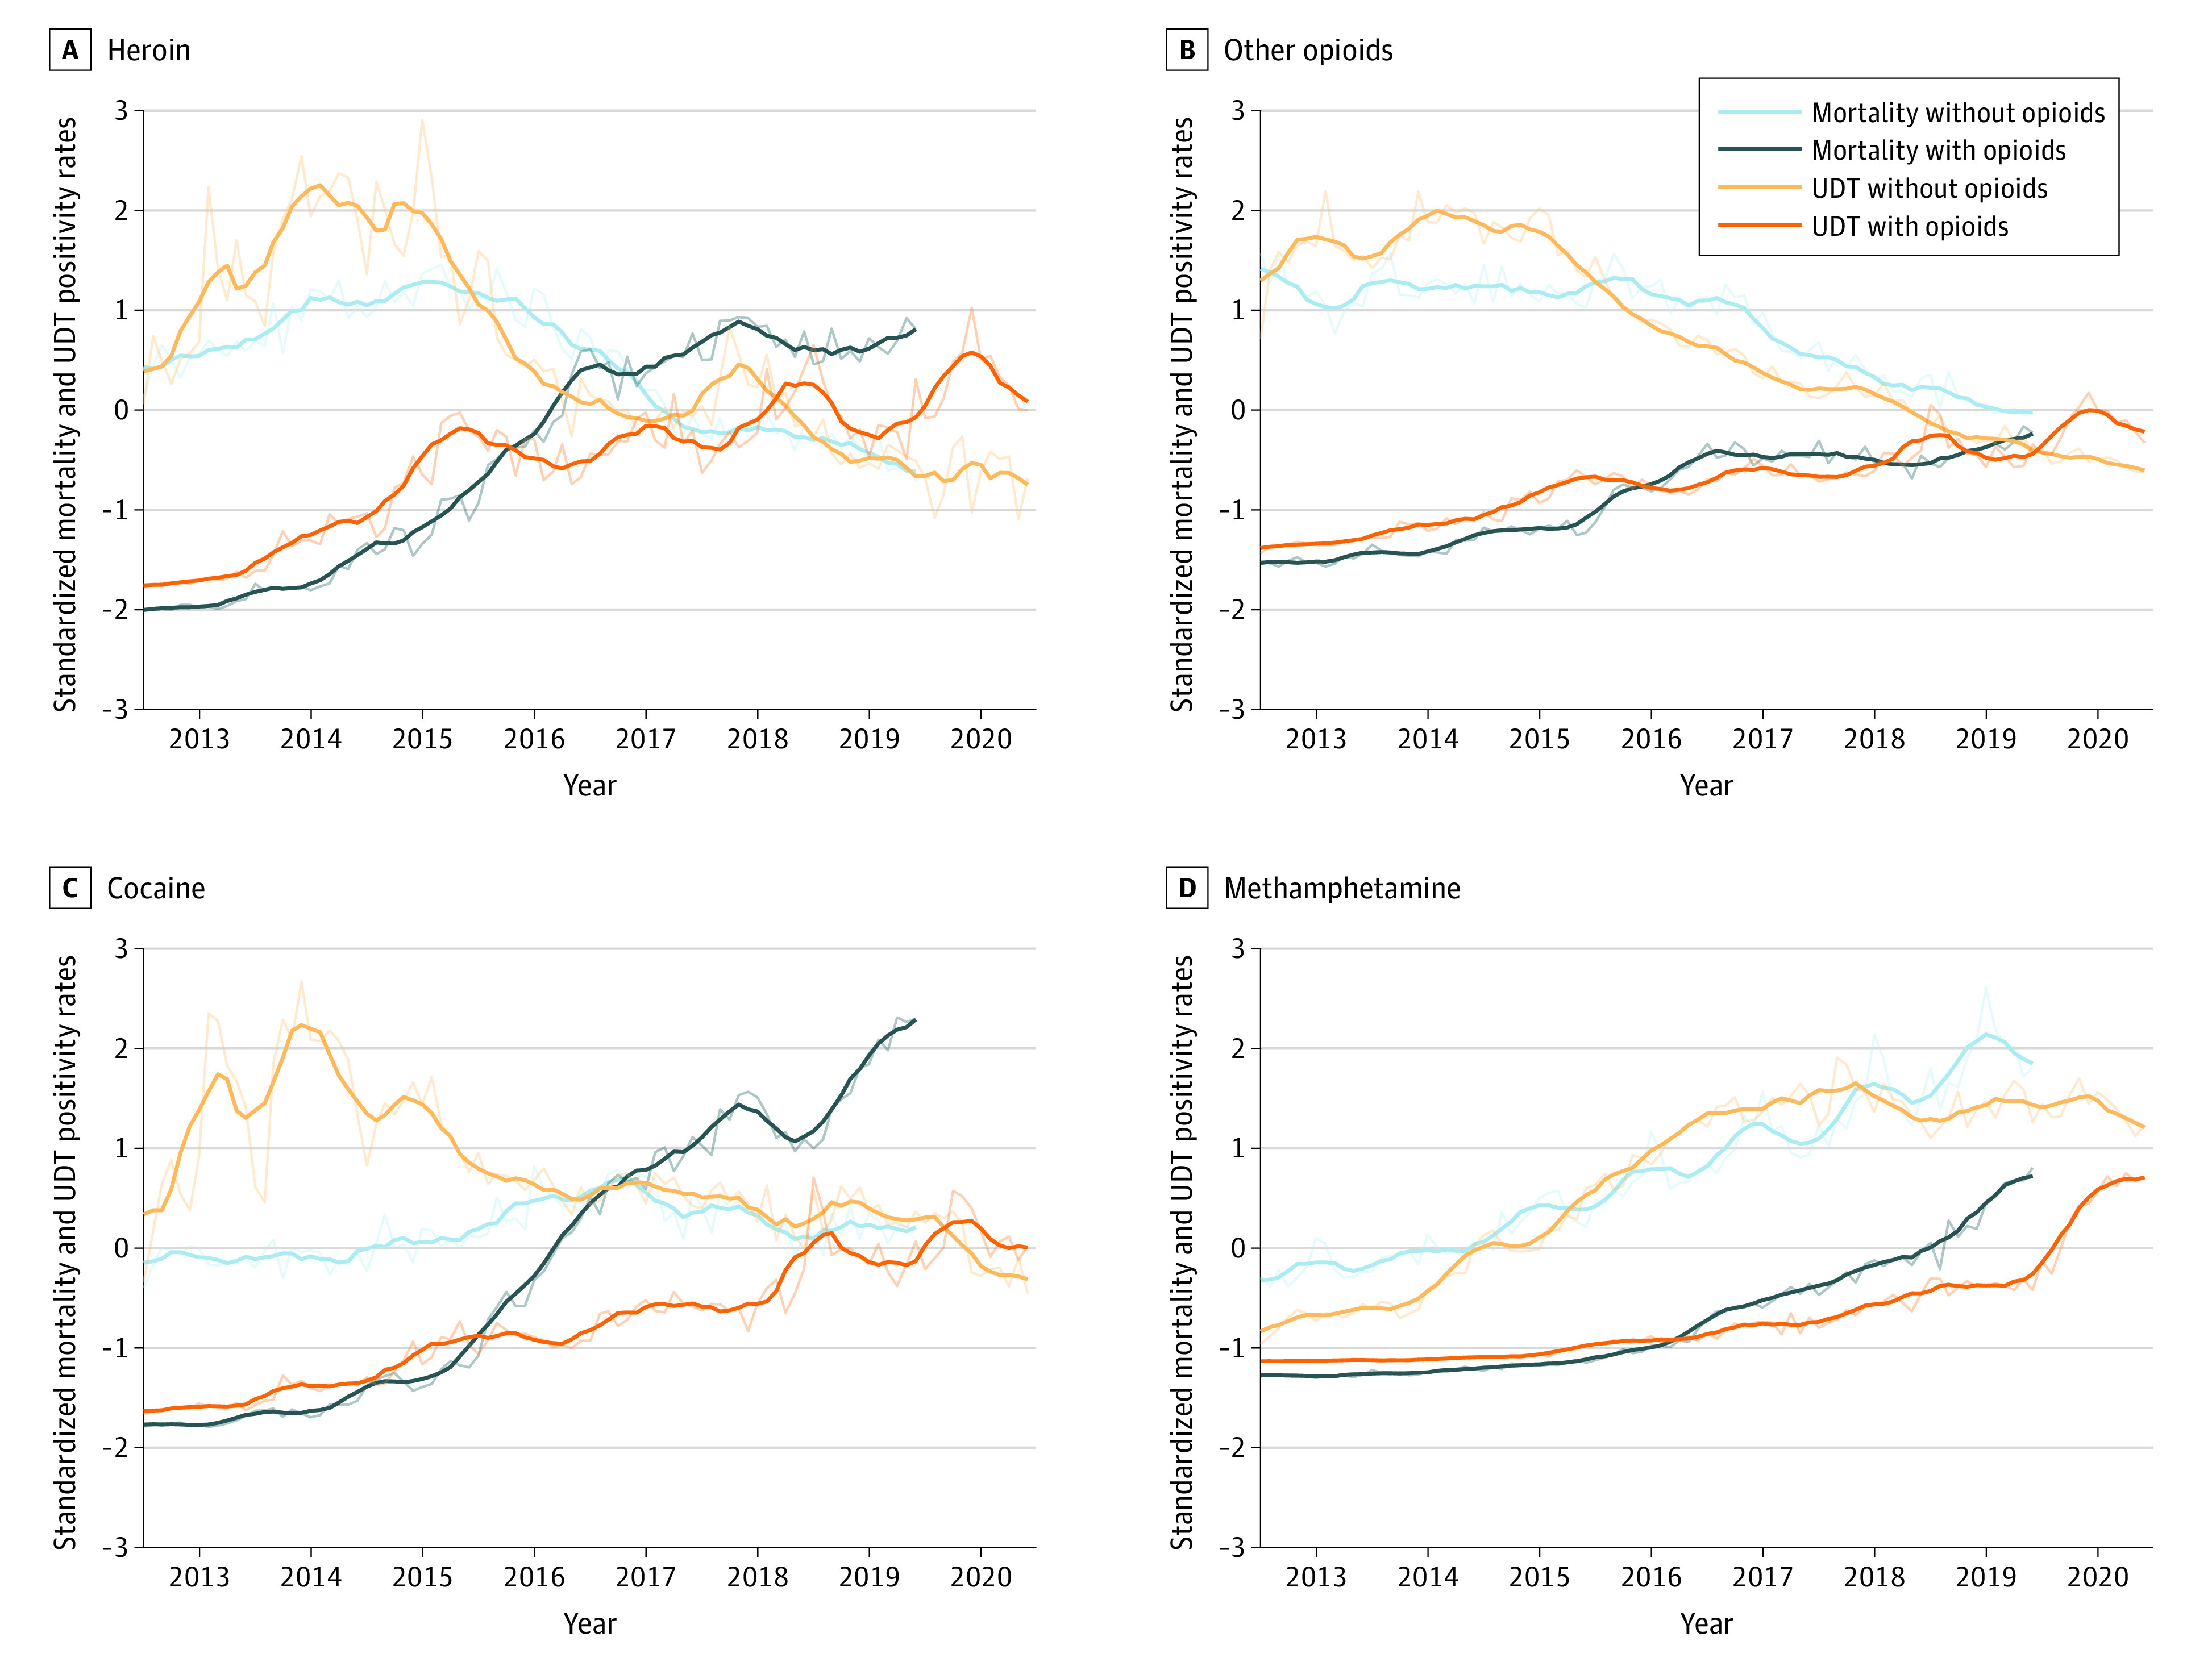
Mortality rates (with and without synthetic opioids) and UDT positivity rates (with and without synthetic opioids) were standardized (mean [SD], 0 [1]), and 6-month rolling mean is shown (dark lines; thinner lines repesent the actual monthly rates). Standardization was performed to place rates on a similar scale for visualization without distorting the association between detection and nondetection of synthetic opioids. Mortality data extend from 2013 to 2019, with UDT data including 2020.
National monthly UDT results for all 4 drug categories were consistent with these patterns. Overall, methamphetamine and synthetic opioids were highly correlated with overdose mortality rates (ρ = 0.96 for both), and all 4 drug categories were highly correlated with overdose mortality rates when synthetic opioids were coinvolved (Table 2). Spearman correlation coefficients in the presence of synthetic opioids over this period were 0.98 for methamphetamine, 0.94 for cocaine, 0.83 for other opioids, and 0.78 for heroin. In the absence of concurrent synthetic opioids, UDT correlations with overdose mortality rates persisted across all drug categories (ρ = 0.88 for methamphetamine, 0.81 for heroin, and 0.75 for other opioids) with the exception of cocaine (ρ = −0.37).
Table 2. Correlation of National, State, and Ohio County Overdose Mortality Rates With Corresponding Urine Drug Test Positivity Rates, 2013-2019.
| Level | Spearman ρ | ||||
|---|---|---|---|---|---|
| Synthetic opioids | Methamphetamine | Cocaine | Heroin | Other opioids | |
| National by moa | |||||
| Total | 0.96 | 0.96 | 0.01 | 0.05 | 0.05 |
| Without synthetic opioids | NA | 0.88 | –0.37 | 0.81 | 0.75 |
| With synthetic opioids | NA | 0.98 | 0.94 | 0.78 | 0.83 |
| Within state by y, medianb | 0.80 | 0.91 | 0.43 | 0.32 | 0.18 |
| Within county by y, medianc | 0.71 | 0.67 | 0.24 | 0.69 | 0.34 |
Abbreviation: NA, not applicable.
Monthly national mortality and urine drug test positivity rates stratified by drug category and synthetic opioid coinvolvement.
Yearly state-level mortality and urine drug test positivity rates stratified by drug category. Median correlation for all states is shown (complete list of state-level values is available in eTable 4 in the Supplement).
Yearly Ohio county-level mortality and urine drug test positivity rates stratified by drug category. Median correlation for all counties is shown (complete list of county-level values is available in eTable 5 in the Supplement).
Correlation at the State Level
After finding a correlation between national overdose mortality and specific UDT positivity rates, we examined the data at a more granular level using a subset of 24 states with sufficient power to explore these correlations. The correlation of UDT positivity rates with overdose mortality rates varied significantly between drug classes and the year being compared (Figure 2; eTable 3 in the Supplement). For example, Spearman correlation coefficients ranged from 0.04 for other opioids in 2013 to 0.85 for methamphetamine in 2016. The median correlation of UDT positivity rates with total overdose mortality rates from 2013 to 2019 was greatest for methamphetamine (ρ = 0.80), followed by synthetic opioids (ρ = 0.77), cocaine (ρ = 0.73), heroin (ρ = 0.54), and other opioids (ρ = 0.31). Stratified rates also revealed high median correlation with methamphetamine in the absence of synthetic opioids (ρ = 0.79) and cocaine in the presence of synthetic opioids (ρ = 0.81). Other opioids had the lowest correlation in the absence of synthetic opioids (ρ = 0.23).
Figure 2. State-Level Total Urine Drug Test (UDT) Positivity and Overdose Mortality Rates Across Years.
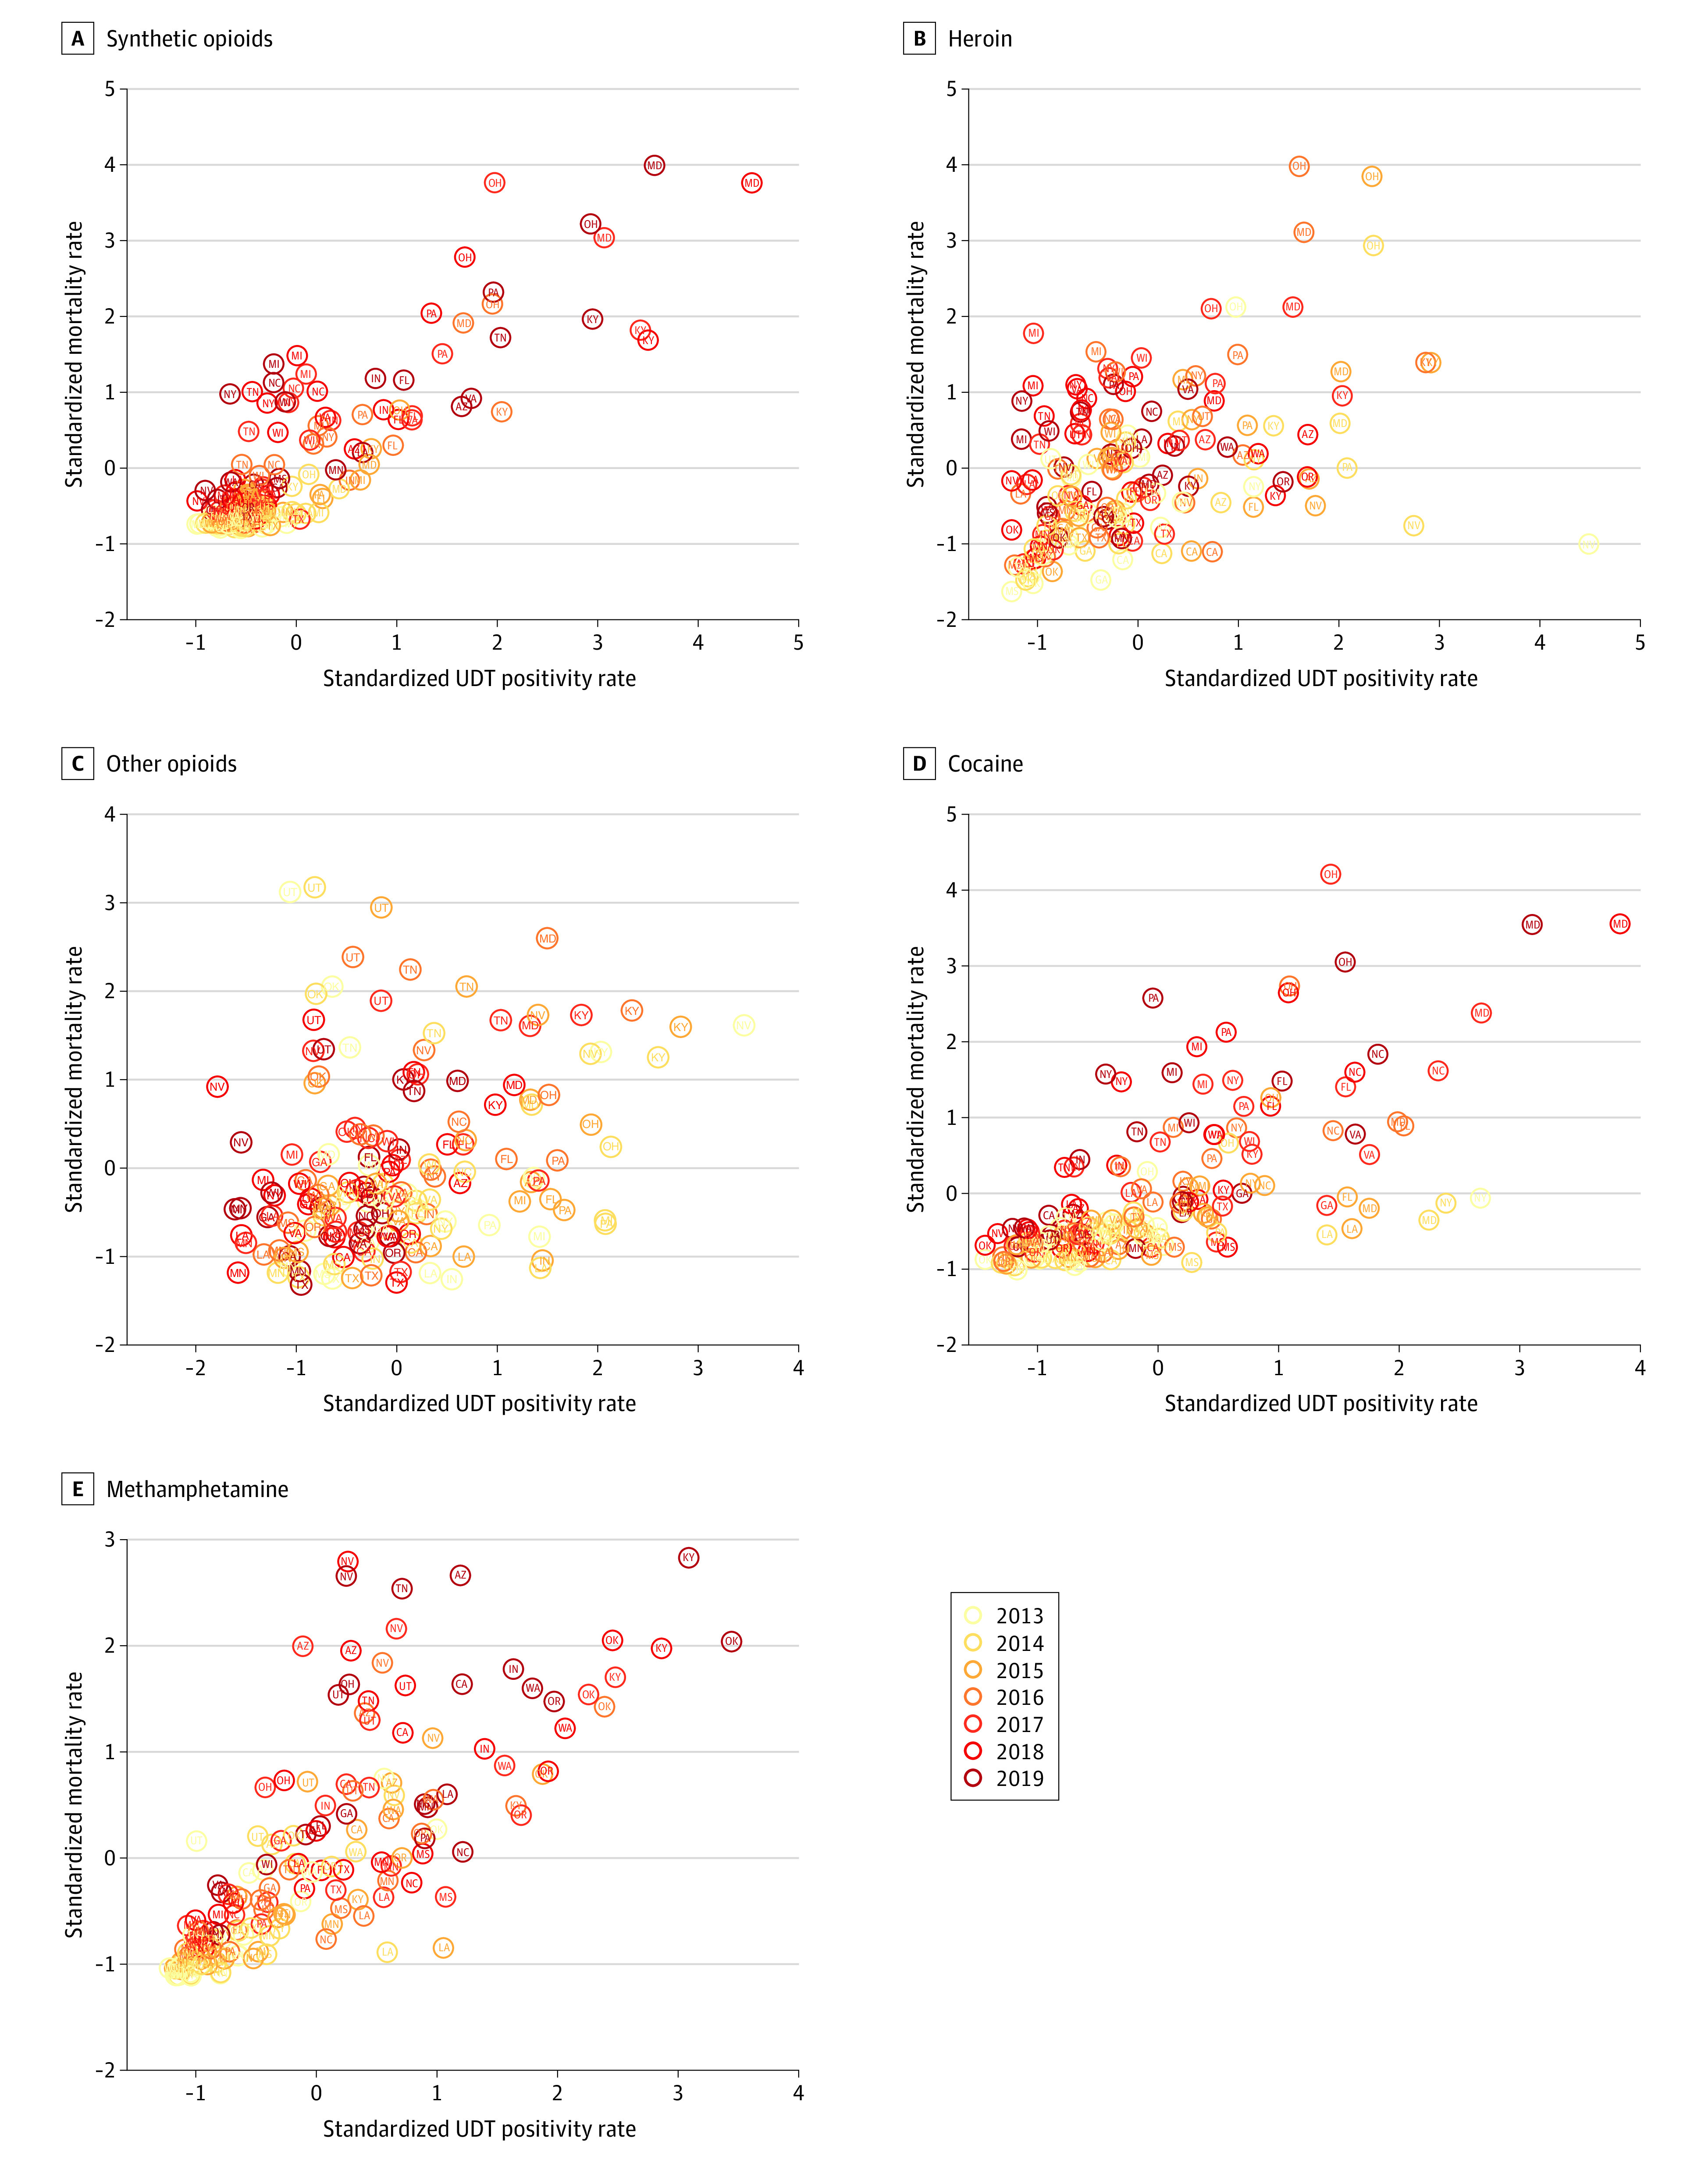
Scatterplots for state-level (n = 24) mortality and UDT positivity rates, stratified by drug category and year of collection. Each data point represents the mortality and UDT positivity rate for a given year and state. Mortality rates and UDT positivity rates were standardized (mean [SD], 0 [1]). Data were not stratified by synthetic opioid codetection. Spearman correlation coefficients are available in eTable 3 in the Supplement.
Within-state correlation of UDT positivity rates with overdose mortality rates was also evaluated across years rather than within years to assess whether rates were consistent over time within a given state (Table 2; eTable 4 in the Supplement). The correlations varied significantly by state and drug class. For example, the median yearly correlation for included states was highest for methamphetamine (ρ = 0.91), followed by synthetic opioids (ρ = 0.80), cocaine (ρ = 0.43), heroin (ρ = 0.32), and other opioids (ρ = 0.18).
Correlation at the Ohio County Level
We also evaluated the correlation of temporal patterns for 19 counties in Ohio to assess whether yearly UDT rates were correlated with overdose mortality rates at finer spatial resolution. Spearman correlation coefficients within counties and across years (2013-2020) for different drug categories are shown in Table 2 and eTable 5 in the Supplement. Synthetic opioids had the highest median correlation with overdose deaths across counties (ρ = 0.71), followed by heroin (ρ = 0.69), methamphetamine (ρ = 0.67), other opioids (ρ = 0.34), and cocaine (ρ = 0.24).
State- and County-Level Overdose Deaths
Poisson regression analysis was used to better understand the association between total state-level overdose deaths and UDT positivity rates collected monthly. The IRRs for both multivariate and univariate models (with each UDT rate modeled separately) are shown in Table 3. All UDT rates at the state level, with the exception of heroin, were found to be significant in the multivariate model, and the overall model fit was good (McFadden R2 = 0.62). The multivariate IRR for synthetic opioids was 1.16 (95% CI, 1.14-1.19; P < .001), suggesting that for every 1-SD increase in the UDT positivity rate, there was a 16.2% increase in monthly overdose deaths. Both methamphetamine (11.7% increase per 1-SD increase in UDT positivity rate; IRR, 1.12; 95% CI, 1.09-1.14; P < .001) and cocaine (5.1% increase per 1-SD increase in UDT positivity rate; IRR, 1.05; 95% CI, 1.03-1.07; P < .001) also had significant positive associations with mortality rates, but the effect sizes were smaller than that of synthetic opioids (IRR, 1.16). In contrast, other opioids had a significant negative association with mortality rates (IRR, 0.86; 95% CI, 0.84-0.88; P < .001). Univariate coefficients suggested a similar pattern, with the only major difference found for heroin, which had a significant negative association with mortality rates in the univariate model (IRR, 0.94; 95% CI, 0.92-0.96; P < .001) but no association with mortality rates in the multivariate model (IRR, 1.01; 95% CI, 0.99-1.03; P = .37).
Table 3. Poisson Regression Analysis of Correlation Between Overdose Mortality Rates and Urine Drug Test Positivity Rates.
| Analysis | Multivariatea | Univariatea,b | ||
|---|---|---|---|---|
| IRR (95% CI) | P value | IRR (95% CI) | P value | |
| US state levelc | ||||
| Heroin | 1.01 (0.99-1.03) | .37 | 0.94 (0.92-0.96) | <.001 |
| Other opioids | 0.86 (0.84-0.88) | <.001 | 0.87 (0.86-0.89) | <.001 |
| Synthetic opioids | 1.16 (1.14-1.19) | <.001 | 1.22 (1.20-1.24) | <.001 |
| Cocaine | 1.05 (1.03-1.07) | <.001 | 1.09 (1.06-1.12) | <.001 |
| Methamphetamine | 1.12 (1.09-1.14) | <.001 | 1.24 (1.20-1.27) | <.001 |
| Ohio county leveld | ||||
| Heroin | 0.98 (0.92-1.05) | .63 | 0.89 (0.85-0.94) | <.001 |
| Other opioids | 0.89 (0.83-0.95) | <.001 | 0.91 (0.88-0.95) | <.001 |
| Synthetic opioids | 1.13 (1.09-1.17) | <.001 | 1.15 (1.11-1.20) | <.001 |
| Cocaine | 1.07 (1.03-1.12) | .002 | 1.14 (1.09-1.20) | <.001 |
| Methamphetamine | 1.01 (0.96-1.07) | .63 | 1.16 (1.10-1.22) | <.001 |
Abbreviation: IRR, incidence rate ratio.
Multivariate and univariate models included the state or county as a fixed effect and the log of the yearly population as a model offset. Model coefficients for state and/or county are not shown.
The univariate models were restricted to a single urine drug test positivity rate per model and included state and/or county as discrete fixed effects.
The following 24 states were included in the analysis based on filtering criteria: Arizona, California, Florida, Georgia, Indiana, Kentucky, Louisiana, Maryland, Michigan, Minnesota, Mississippi, Nevada, New York, North Carolina, Ohio, Oklahoma, Oregon, Pennsylvania, Tennessee, Texas, Utah, Virginia, Washington, and Wisconsin. Multivariate McFadden R2 = 0.62.
The following 19 Ohio counties were included in the analysis based on filtering criteria: Allen, Butler, Clermont, Cuyahoga, Erie, Fairfield, Franklin, Fulton, Hamilton, Huron, Lorain, Lucas, Marion, Medina, Richland, Seneca, Summit, Warren, and Wood. Multivariate McFadden R2 = 0.27.
Regression models were also used to better understand the association between Ohio county-level total overdose mortality and standardized UDT positivity rates collected on a quarterly basis (2013-2020). Multivariate model fit was good (McFadden R2 = 0.27), although not as high as the state-level model (Table 3). Cocaine, synthetic opioids, and other opioids were found to be significantly associated with overdose deaths in the multivariate model. Synthetic opioids had the highest relative IRR of 1.13 (95% CI, 1.09-1.17; P < .001) in the multivariate model compared with 1.15 (95% CI, 1.11-1.20; P < .001) in the univariate model. As observed in the state-level model, other opioids had a significant negative association with overdose deaths (IRR, 0.89; 95% CI, 0.83-0.95; P < .001) and cocaine had a significant positive association with overdose deaths (IRR, 1.07; 95% CI, 1.03-1.12; P = .002) in the multivariate model. Notably, methamphetamine was not associated with overdose deaths in the multivariate model (IRR, 1.01; 95% CI, 0.96-1.07; P = .63), although it was significantly associated with overdose deaths in the univariate model and had the largest relative effect size, with an IRR of 1.16 (95% CI, 1.10-1.22; P < .001). As observed in the state-level regression model, heroin was not associated with overdose deaths in the multivariate model (IRR, 0.98; 95% CI, 0.92-1.05; P = .63) but had a significant negative association with overdose deaths in the univariate model (IRR, 0.89; 95% CI, 0.85-0.94; P < .001).
Discussion
This cross-sectional study found strong correlation between UDT data from SUD treatment practices and overdose mortality across 5 drug categories over a similar period at national, state, and county levels. At the national level, UDT positivity for synthetic opioids and methamphetamine were both highly correlated with overdose mortality rates. Given their potency and synthetic nature, fentanyl and methamphetamine can be inexpensively produced by drug trafficking organizations, contributing to substantial profits and widespread availability26,27 that have increased the involvement of these substances in overdose deaths, with fentanyl ranking first and methamphetamine ranking second for overdose deaths in 2020.4 In this study, correlation with overdose deaths was strongest for synthetic opioids and methamphetamine, which is likely explained by their availability and lethality as well as the finding that all drug categories were highly correlated with overdose deaths when synthetic opioids were coinvolved. In the absence of synthetic opioids, all drug categories, with the exception of cocaine at the national level, were highly correlated with overdose deaths.
Similar to the national findings, synthetic opioids and methamphetamine had the highest median state-level correlation with overdose deaths over time, likely because of the notable involvement of both drugs in current overdose mortality patterns. Other opioids had the lowest correlation for both total positivity and positivity in the absence of synthetic opioids. Deaths involving prescription opioids remained lower than peak rates in 2017,4 concurrent with a decrease in opioid prescribing practices and manufacturing.27 Many counterfeit tablets purported to be prescription-grade opioids are now being identified as containing illicitly manufactured fentanyl.27 These factors may have had implications for the correlation between UDT results and mortality rates for other opioids, especially in the absence of synthetic opioids.
The multivariate models used to assess the associations of each UDT rate with overall overdose deaths allowed a more holistic understanding of the association of UDT measures with mortality rates. For example, at a county level, we were able to observe that synthetic opioids and methamphetamine were positively associated with mortality rates, whereas heroin and other opioids were negatively associated. This observation makes sense given that mortality rates increased at a relatively consistent rate over the study period, similar to methamphetamine and synthetic opioid UDT rates. However, heroin and other opioid deaths that did not coinvolve synthetic opioids decreased or remained stable,4,5 which may explain the coefficients observed.
Some fluctuations were observed in the strength of the correlation within a given year. Not all synthetic opioids (eg, fentanyl analogues) were included in the analysis, although some have been associated with increases in drug overdose deaths in certain areas.28 Other factors that may have had implications for yearly correlation include UDT sample volume, external interventions (eg, naloxone distribution) in certain areas, and the emergence of the COVID-19 pandemic, which had wide-ranging consequences for public health and the opioid crisis. These factors may have also been associated with fluctuations in state- and county-level findings, particularly where variations existed in community-led interventions.
These UDT results were collected among a population seeking health care in an SUD treatment setting. Patients in this setting typically have higher rates of UDT positivity for illicit drugs than the general population, placing them at increased risk for overdose; this factor may have played a role in the strength of correlation.
Although UDT serves as a medically necessary tool for clinicians to detect potentially problematic illicit drug use and relapse that may lead to overdose events and deaths among patients during the treatment and recovery periods, secondary use of this information can help public health officials and community leaders develop real-time responses to the substance use crisis. Because of the long lag time between data availability for specific drugs and overdose deaths, timely UDT results that are both temporally and geospatially linked may provide a window into local and regional changes to inform reallocation of harm reduction strategies, such as distribution of naloxone or fentanyl test strips, in communities in which emerging patterns of increased rates of specific drug categories or co-occurrence of synthetic opioids and stimulants might be used to estimate an increasing risk of overdose deaths.
We were able to observe associations between the extent of UDT positivity rates and the community rates of drug-specific overdose mortality. Using state-level data, every 1-SD increase in synthetic opioid UDT positivity was associated with a 16.2% increase in overdose deaths. This finding supported our hypothesis that UDT results may provide early insights into emerging drug use patterns associated with overdose mortality rates. Extension of our findings to the development of predictive models incorporating UDT results will be important to assess whether secondary use of these data can inform agile responses at a community, state, or national level to reduce overdose deaths.
Limitations
This study has several limitations. Not all psychoactive substances (eg, methadone, benzodiazepines, and fentanyl analogues) that affect overdose mortality rates were included in this study. Additional social factors associated with health (eg, unemployment and poverty rates) were not included in the models, despite their known impact.10 Various interventional data, such as opioid prescribing rates and naloxone use, were also not included. Data from UDTs may be subject to selection bias that was not accounted for in these models and may impact UDT rates spatially and temporally. In addition, these UDT results were collected in SUD treatment practices, and findings may not reflect patterns in the general population. Patients included in the analysis may have had an incomplete or inaccurate medication list from the ordering clinician, which would result in possible inclusion of positive results associated with an unreported prescription medication. The COVID-19 pandemic may have affected UDT rates, and its consequences for these models is unknown. The Ohio 2020 mortality data are currently provisional and not estimated in the same way as CDC WONDER data. A recent study29 found that MCD designations on death certificates are incomplete and often erroneous, which could impact correlation and prediction studies.
Conclusions
This cross-sectional study found that UDT results were correlated with overdose mortality rates at national, state, and county levels, with synthetic opioids and methamphetamine having the strongest correlations with mortality rates. These findings suggest UDT is a valuable data source that is capable of informing real-time surveillance efforts to alert communities about changes in the drug environment that might be associated with drug overdose deaths.
eTable 1. National-, State-, and County-Level Overdose Mortality Estimates Used in the Current Study
eTable 2. Yearly US Urine Drug Test Positivity Rates Stratified by Presence of Synthetic Opioids
eTable 3. Spearman Correlation for Yearly State-Level Overdose Mortality Rates With Corresponding Urine Drug Test Positivity Rates
eTable 4. Spearman Correlation for Yearly Urine Drug Test Positivity Rate vs Overdose Mortality Rate for Select States
eTable 5. Spearman Correlation for Yearly Urine Drug Test Positivity Rate vs Mortality Rate for Select Ohio Counties
References
- 1.NIH HEAL Initiative . HEALing Communities Study. US Department of Health and Human Services; 2021. Accessed September 14, 2021. https://healingcommunitiesstudy.org/
- 2.Federal Office of Rural Health Policy. Rural Communities Opioid Response Program (RCORP). Health Resources & Services Administration; 2021. Accessed September 14, 2021. https://www.hrsa.gov/rural-health/rcorp
- 3.Coady JA. Preventing overdose and death. Substance Abuse and Mental Health Services Administration. August 31, 2021. Accessed September 14, 2021. https://www.samhsa.gov/blog/preventing-overdose-death
- 4.Ahmad FB, Rossen LM, Sutton P. Provisional drug overdose death counts. National Center for Health Statistics; 2021. Accessed September 13, 2021. https://www.cdc.gov/nchs/nvss/vsrr/drug-overdose-data.htm
- 5.Mattson CL, Tanz LJ, Quinn K, Kariisa M, Patel P, Davis NL. Trends and geographic patterns in drug and synthetic opioid overdose deaths—United States, 2013-2019. MMWR Morb Mortal Wkly Rep. 2021;70(6):202-207. doi: 10.15585/mmwr.mm7006a4 [DOI] [PMC free article] [PubMed] [Google Scholar]
- 6.US Department of Health & Human Services. Overdose prevention strategy. US Department of Health & Human Services; 2021. Accessed September 13, 2021. https://www.hhs.gov/opioids/about-the-epidemic/hhs-response/index.html
- 7.Rege SV, Smith M, Borek HA, Holstege CP. Opioid exposures reported to U.S. poison centers. Subst Use Misuse. 2021;56(8):1169-1181. doi: 10.1080/10826084.2021.1914101 [DOI] [PubMed] [Google Scholar]
- 8.Emergency Department Drug Surveillance (EDDS) System. EDDS update. Center for Substance Abuse Research; October 2020. Accessed September 14, 2020. https://cesar.umd.edu/sites/cesar.umd.edu/files/pubs/EDDS-Update-Factsheet-10-27-2020-REV4.pdf
- 9.Dezman Z, Schwartz B, Billing A, et al. Notes from the field: high prevalence of fentanyl detected by the Maryland Emergency Department Drug Surveillance System—Baltimore, Maryland, 2019. MMWR Morb Mortal Wkly Rep. 2020;69(23):724-726. doi: 10.15585/mmwr.mm6923a3 [DOI] [PMC free article] [PubMed] [Google Scholar]
- 10.Rosenblum D, Unick J, Ciccarone D. The rapidly changing US illicit drug market and the potential for an improved early warning system: evidence from Ohio drug crime labs. Drug Alcohol Depend. 2020;208:107779. doi: 10.1016/j.drugalcdep.2019.107779 [DOI] [PMC free article] [PubMed] [Google Scholar]
- 11.Kline D, Pan Y, Hepler SA. Spatiotemporal trends in opioid overdose deaths by race for counties in Ohio. Epidemiology. 2021;32(2):295-302. doi: 10.1097/EDE.0000000000001299 [DOI] [PMC free article] [PubMed] [Google Scholar]
- 12.Kerry R, Yoo E, Ingram B. Spatial analysis of drug poisoning deaths in the American west: a comparison study using profile regression to adjust for collinearity and spatial correlation. Drug Alcohol Depend. 2019;204:107598. doi: 10.1016/j.drugalcdep.2019.107598 [DOI] [PubMed] [Google Scholar]
- 13.Iwanicki JL, Severtson SG, Margolin Z, Dasgupta N, Green JL, Dart RC. Consistency between opioid-related mortality trends derived from poison center and National Vital Statistics System, United States, 2006-2016. Am J Public Health. 2018;108(12):1639-1645. doi: 10.2105/AJPH.2018.304728 [DOI] [PMC free article] [PubMed] [Google Scholar]
- 14.Lin D, Liu S, Ruhm CJ. Opioid deaths and local healthcare intensity: a longitudinal analysis of the U.S. population, 2003-2014. Am J Prev Med. 2020;58(1):50-58. doi: 10.1016/j.amepre.2019.09.008 [DOI] [PubMed] [Google Scholar]
- 15.Center for Substance Abuse Treatment . Clinical Drug Testing in Primary Care . Substance Abuse and Mental Health Services Administration; 2012. Technical Assistance Publication Series TAP 32. HHS publication (SMA) 12-4668. Accessed September 13, 2021. https://store.samhsa.gov/sites/default/files/d7/priv/sma12-4668.pdf [Google Scholar]
- 16.Chou R, Fanciullo GJ, Fine PG, et al. ; American Pain Society–American Academy of Pain Medicine Opioids Guidelines Panel . Clinical guidelines for the use of chronic opioid therapy in chronic noncancer pain. J Pain. 2009;10(2):113-130. doi: 10.1016/j.jpain.2008.10.008 [DOI] [PMC free article] [PubMed] [Google Scholar]
- 17.Manchikanti L, Kaye AM, Knezevic NN, et al. Responsible, safe, and effective prescription of opioids for chronic non-cancer pain: American Society of Interventional Pain Physicians (ASIPP) guidelines. Pain Physician. 2017;20(2S):S3-S92. doi: 10.36076/ppj.2017.s92 [DOI] [PubMed] [Google Scholar]
- 18.Jarvis M, Williams J, Hurford M, et al. Appropriate use of drug testing in clinical addiction medicine. J Addict Med. 2017;11(3):163-173. doi: 10.1097/ADM.0000000000000323 [DOI] [PubMed] [Google Scholar]
- 19.Wainwright JJ, Mikre M, Whitley P, et al. Analysis of drug test results before and after the US declaration of a national emergency concerning the COVID-19 outbreak. JAMA. 2020;324(16):1674-1677. doi: 10.1001/jama.2020.17694 [DOI] [PMC free article] [PubMed] [Google Scholar]
- 20.LaRue L, Twillman RK, Dawson E, et al. Rate of fentanyl positivity among urine drug test results positive for cocaine or methamphetamine. JAMA Netw Open. 2019;2(4):e192851. doi: 10.1001/jamanetworkopen.2019.2851 [DOI] [PMC free article] [PubMed] [Google Scholar]
- 21.Twillman RK, Dawson E, LaRue L, Guevara MG, Whitley P, Huskey A. Evaluation of trends of near-real-time urine drug test results for methamphetamine, cocaine, heroin, and fentanyl. JAMA Netw Open. 2020;3(1):e1918514. doi: 10.1001/jamanetworkopen.2019.18514 [DOI] [PMC free article] [PubMed] [Google Scholar]
- 22.Stanton JD, Whitley P, LaRue L, Bundy WL, Dawson E, Huskey A. Fentanyl analog positivity among near-real-time urine drug test results in patients seeking health care. Drug Alcohol Depend. 2020;217:108264. doi: 10.1016/j.drugalcdep.2020.108264 [DOI] [PubMed] [Google Scholar]
- 23.CDC WONDER . Centers for Disease Control and Prevention. Accessed October 12, 2021. https://wonder.cdc.gov/
- 24.National Center for Health Statistics. Monthly provisional counts of deaths by select causes, 2020-2021. Centers for Disease Control and Prevention. February 3, 2021. Accessed October 12, 2021. https://data.cdc.gov/NCHS/Monthly-Provisional-Counts-of-Deaths-by-Select-Cau/9dzk-mvmi
- 25.Ohio Public Health Information Warehouse. Mortality. Ohio Department of Health; 2021. Accessed October 12, 2021. https://publicapps.odh.ohio.gov/EDW/DataBrowser/Browse/Mortality
- 26.United States Drug Enforcement Administration. Facts about fentanyl. US Department of Justice; 2021. Accessed November 16, 2021. https://www.dea.gov/resources/facts-about-fentanyl
- 27.United States Drug Enforcement Administration. 2020 Drug Enforcement Administration (NDTA) National Drug Threat Assessment. US Department of Justice; March 2021. Accessed October 12, 2021. https://www.dea.gov/sites/default/files/2021-02/DIR-008-21%202020%20National%20Drug%20Threat%20Assessment_WEB.pdf
- 28.O’Donnell J, Gladden RM, Mattson CL, Kariisa M. Notes from the field: overdose deaths with carfentanil and other fentanyl analogs detected—10 states, July 2016-June 2017. MMWR Morb Mortal Wkly Rep. 2018;67(27):767-768. doi: 10.15585/mmwr.mm6727a4 [DOI] [PMC free article] [PubMed] [Google Scholar]
- 29.Boslett AJ, Denham A, Hill EL. Using contributing causes of death improves prediction of opioid involvement in unclassified drug overdoses in US death records. Addiction. 2020;115(7):1308-1317. doi: 10.1111/add.14943 [DOI] [PMC free article] [PubMed] [Google Scholar]
Associated Data
This section collects any data citations, data availability statements, or supplementary materials included in this article.
Supplementary Materials
eTable 1. National-, State-, and County-Level Overdose Mortality Estimates Used in the Current Study
eTable 2. Yearly US Urine Drug Test Positivity Rates Stratified by Presence of Synthetic Opioids
eTable 3. Spearman Correlation for Yearly State-Level Overdose Mortality Rates With Corresponding Urine Drug Test Positivity Rates
eTable 4. Spearman Correlation for Yearly Urine Drug Test Positivity Rate vs Overdose Mortality Rate for Select States
eTable 5. Spearman Correlation for Yearly Urine Drug Test Positivity Rate vs Mortality Rate for Select Ohio Counties