Abstract
Purpose
Diabetes Mellitus (DM) is a systemic disease that can effect tissues and their physiological functions at molecular and biochemical levels. Diabetic osteoporosis is one of the chronic diseases of bone metabolism effected by and characterized by augmented risk of osteoporotic fractures and destroying of bone microarchitecture. It was aimed to investigate the alterations in femoral bone structure that may take place as a complication of DM by using the antioxidant properties of eugenol and quercetin, which are phenolic compounds, in streptozotocin nicotinamide (STZ-NA) induced rats as an experimental type 2 DM (T2 DM) model.
Methods
The antioxidant effect of eugenol and quercetin in case of DM development was determined by GSH ELISA kit. The effect of DM on alterations in bone structure was analyzed by micro CT. BMD, Tb.Bv/Tb.Tv, Tb.N, Tb.Th, Ct.Th, Tb.Sp and SMI data were calculated with the software CTAn.
Results
Serum GSH levels, Tb.Th and Tb.Bv/Tb.Tv values statistically decreased, and SMI values statistically increased in diabetic group compared with controls. Serum GSH levels in eugenol group were higher than diabetic group, and Tb.Bv/Tb.Tv values in eugenol group were lower than controls. Quercetin group had higher serum GSH levels and Tb.Th values compared with diabetic group, while SMI values were lower in quercetin group compared with diabetic group.
Conclusion
Eugenol and quercetin were revealed to have antioxidant, antidiabetic and osteoprotective effects on the repair of bone structure in experimental STZ-NA T2 DM model.
Keywords: Diabetes mellitus, Antioxidant, Bone loss, Micro CT
Introduction
DM is characterized by hyperglycemia and affects most of the systems in the organism. While its complications like retinopathy, nephropathy and neuropathy are well defined, their effects on the muscle, joint and bone systems are often overlooked. Diabetic osteoporosis is one of the chronic diseases of bone metabolism that is induced by DM and that is characterized by augmented risk of osteoporotic fractures and destroying of bone microarchitecture. The worldwide incidence of diabetic osteoporosis is rising with the prevalence of DM. Hyperglycemia negatively affects bone metabolism by worsening the critical balance of osteoblastogenesis and osteoclastogenesis [1].
Musculoskeletal changes are common in DM patients. It has almost been 80 years that skeletal involvement in DM was first mentioned. It emerged with radiological imaging results of delay in bone development and atrophy in bone structure in children diagnosed with Type 1 (T1) DM. Despite a systematic analysis in women diagnosed with T2 DM in 2007, there has been no important increment in fractures of vertebra and/or distal forearm, and the risk of hip fracture increased 1.7 times. Clinical studies and animal models report that reduced bone resistance in DM may contribute to fracture risk, but this is a controversial issue [2, 3].
There have been a number of studies reporting the effects on the biomechanical features of bone caused by insulinopenia and hyperglycemia in DM induced by streptozotocin (STZ) injection. Continuous decrease or loss in insulin production causes the decrease in structural strength of femoral bones in rats. The effects of DMon bones, which are established by insulin resistance and hyperglycemia resulting from spontaneous or high fat diet (HFD), on bone in T2 DM and T1 DM rat models have been suggested to be almost the same [4]. A study related with diabetic rat bones reported that there was a diminishing in number and volume of trabecular bone, besides in bone microarchitecture and mineralization with an increased in trabecular separation in lumbar spine (L2) and femur [1]. In a study conducted in a T2 DM mouse model, the loss of cortical and trabecular bone mass and related to the increase of osteoclastic activity parallel to the progression of DM, thinning and loss of trabecular structure were observed [5]. Because of the challenges of human research, animal models provide useful and necessary research tools to understand the molecular basis of DM, the pathogenesis of complications, and the use of therapeutic agents in DM. Rodent models for T2 DM are preferred as they share many similarities with human DM. Combination of STZ with appropriate nicotinamide (NA) doses in adult rats has been shown to result in the onset of a novel diabetic syndrome associated with mild and stable hyperglycemia and diminished pancreatic insulin stores (approximately 40% of normal) [6]. In studies on bone in STZ-NA induced DM in Wistar and other rat strains, it was reported that the bone loses its mechanical resistance with a decrease in cortical and trabecular bone volume [7].
Antioxidants have osteoprotective effects to reduce diabetic bone loss. Hyperglycemia and free fatty acid cause oxidative stress. This issue affects the antioxidant defense mechanism by increasing the production of reactive oxygen species and decreasing antioxidant enzyme levels, which causes further increase in oxidative stress. Oxidative stress is a crucial factor in the pathophysiology of diabetic complications. It has been reported that quercetin, a flavonoid having antioxidant properties, provides regeneration in pancreatic islets and induces insulin release in STZ-induced diabetic rats, and it has been demonstrated in experimental studies that quercetin has beneficial antidiabetic effects [8]. Quercetin has been found to increase glucose uptake in cells by increasing the AMPK pathway and GLUT4 translocation in L6 muscle cells and H4IIE rat hepatoma cells [9]. Natural antidiabetic herbal sources may provide an alternative to new pharmaceuticals having low toxicity and adverse effects. Eugenol as a phenolic compound can be obtained from clove, cinnamon and several other herbs. Eugenol was reported to have potent analgesic, antiinflammatory, antihypertensive, neuroprotective and antibacterial properties. In diabetic animal models, eugenol decreases blood glucose level by inhibiting α-glucosidase, increasing glucose uptake, decreasing glucose production in liver through gluconeogenesis, and blocking pancreatic enzyme activities [10].
T2 DM effects bone microstructure by inducing deteriorated bone cell function and matrix formation through augmented osteoblast apoptosis, decreased osteoblast differentiation, and increased osteoclast induced bone resorption [11]. Micro computed tomography (micro CT) is considered as the gold standard in estimating bone loss like bone volume/tissue volume (Tv/Bv), trabecular number (Tb.N), trabecular separation (Tb.Sp), trabecular thickness (Tb.Th) and cortical thickness (Ct.Th) and for measuring bone microarchitecture parameters. Micro CT provides a separate evaluation of cortical and trabecular bone compartments.
The diagnosis of some T2 DM patients can only be achieved when complications due to hyperglycemia such as foot ulcer, visual impairment, kidney failure and infection occur. Neuropathy is a common complication of DM. It is known that some complications such as neuropathy and bone loss occur in rats 21 days after induction of DM [12, 13]. Diabetic peripheral neuropathy potentially contributes to bone disease. In addition to bone mineral density (BMD) and fracture, other measures for bone quality such as microarchitecture and trabecular bone score may be associated with neuropathy in both T1 DM and T2 DM [14]. The mechanisms by which osteoblast dysfunction in DM are not fully understood, but oxidative stress caused by insulin deficiency, poor glycemic control, and hyperglycemia possibly contribute to this issue. Oxidative stress induces osteoblast death by inhibiting osteoblast differentiation [13].
As we could reach the literature, the effects of eugenol and quercetin as phenolic compounds on bone structure have not been investigated in the experimental T2 DM model of STZ-NA in Sprague Dawley rats. In the present study, it was aimed to analyze the osteoprotective effects of eugenol and quercetin on the bone microarchitecture of rat femurs obtained from the STZ-NA induced DM model.
Materials and Methods
Experimental Animals Used in the Study
Animal rights are protected in this study in line with the principles of the Guide for the Care and Use of Laboratory Animals (www.nap.edu/catalog/5140.html). Ethics committee approval was obtained with the decision of Istanbul University (IU) Animal Experiments Local Ethics Committee, numbered 2016/26. 37 adult male Sprague Dawley rats aged between 10–12 weeks, weighting 250–280 g, obtained from IU Aziz Sancar Experimental Medicine Research Institute (ASDETAE) were used. Animal experiments and care have been done in ASDETAE. During the experiment period, rats were fed with standard rat diet and tap water ad-libitum and maintained under optimum laboratory conditions (23 ± 2 ºC, 55 ± 5% humidity, 12 h light/dark period).
Experimental Groups
The animals were brought to the experimental environment 48 h prior to adaptation and divided into 4 groups by random sampling. Since it was known that some of the animals die in DM models designed with chemical agents and some of them do not develop DM, the number of animals in diabetic groups was determined as 10. In rats with experimental T2 DM, mortality was observed at a rate of 20–25% during the experiment. Experimental T2 DM was established by applying STZ (Streptozocin-Sigma, S0130) and NA (Nicotinamide-Sigma, 72,340) to 30 rats and divided into 3 groups (n = 10). 7 rats were included in the study as a healthy control. Antioxidant application was initiated 21 days after T2 DM was formed and eugenol (Eugenol-Sigma, E51791) and quercetin (Quercetin-Sigma, Q4951) were administered orally (gavage) once a day for 28 days.
Designing Experimental T2 DM Disease Model
In order to induce DM, 120 mg/kg NA, freshly prepared and dissolved in 0.2 mL saline (SF), was administered intraperitoneally (i.p.) to rats fasted for 12 h (water given freely) by taking into account their body weight. After 20 min, freshly prepared 65 mg/kg STZ dissolved in 0.2 mL volume SF (protected from light) was administered with single dose i.p. route injection by using 26 gauge insulin injector [15]. The rats were allowed to take feed and water after STZ-NA administration. In the control group without DM, the same amount of SF was injected intraperitoneally. 48 h after STZ-NA administration, blood glucose levels were analyzed with a glucometer (Accu-Chek Performa Nano) in the blood drawned from the tail vein of rats, and the rats with blood glucose levels above 200 mg/dL were accepted as DM and were included in the study. Both blood glucose levels and weights of the rats were routinely measured until the treatment stage and also during the treatment on the same day and at the same time (09:00—10:00) weekly, and the data obtained were recorded and evaluated statistically.
Application of Antioxidant Substance
21 days after the DM disease model was designed, the application of antioxidant substances was initiated and continued for 28 days [12, 13]. According to procedure, 20 mg/kg eugenol [16] and 50 mg/kg quercetin [17] was administered to the eugenol group and the quercetion of diabetic rats once a day via gavage respectively. Eugenol and quercetin were dissolved in a mixture of SF and ethyl alchohol (3:1) and prepared by considering weekly weight changes. The healthy control group and the diabetic control group were given a volume of 0.3 mL solvent liquid by gavage daily for 28 days. Those given to the treatment and control groups were prepared daily and were administered at the same time every day (09:30—10:00) starting from the 21st day until the end of the experiment.
Determination of GSH Levels from Serum Samples with ELISA Kit
By the end of the experiment on 49th day, the rats were sedated using 40 mg/kg ketamine (Ketalar, Pfizer) and 4 mg/kg xylazine (Rompun, Bayer) by i.p. way. Intracardiac blood samples (~ 5 mL) from anesthetized rats were taken into test tubes free of anti-coagulant and kept at room temperature for 15–20 min, and then centrifuged at 3000 rpm for 10 min. The serum of the samples remaining in the upper part of the tube was taken and stored at -20 ºC. Ready to use commercial Glutathione (GSH) ELISA kit (Rat, GSH ELISA kit, Shanghai Sunred Biological Technology Co., Ltd) was used to study rat serum samples stored at -20ºC. Absorbance was calculated from a standard curve by measuring at 450 nm with an ELISA reader (spectrophotometer-PerkinElmer).
Taking Femur Samples
After intracardiac blood collection under general anesthesia, right femurs of rats were removed and stripped from their soft tissue. The removed femurs were placed in 15 mL falcon tubes in 10% formaldehyde solution.
Scanning and Analysis of Femurs with Micro Computed Tomography (Micro CT)
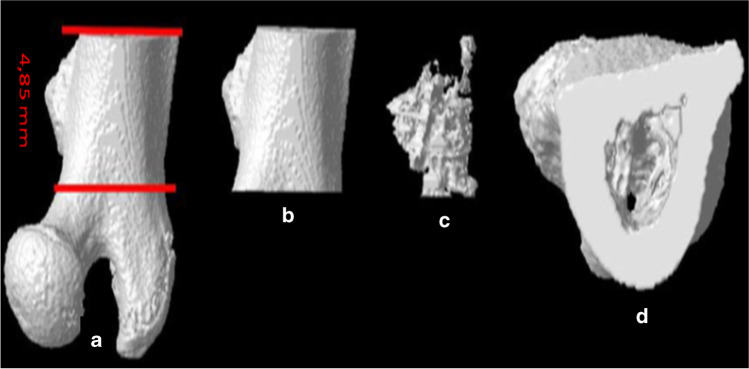
The prepared femur samples were scanned with SkyScan 1174v2 (Kontich-Belgium) micro CT in IU 3D Medical and Industrial Design Laboratory (TETLab). Reconstruction of the scan images with NRecon (Ver. 1.6.10.2) provided by the manufacturer and analysis of various parameters with CTAn (Ver. 1.16.4.1 +) were performed (Fig. 1). Femur specimens fixed using gauze in 15 ml falcon tubes containing 10% formaldehyde were placed on the rotating polystyrene support of the micro CT device and X-ray tube 50 kVp voltages, 800 μA current, and 40 W power values were scanned for each sample with a 1 mm aluminum filter. The scanning values were optimized and the 4000 ms integration time was set as 61 μm pixels at 512 × 652 resolutions. The scans were completed with 1.0 rotation and 360 degrees vertical rotation. Each sample was scanned for approximately 35 min. BMD calibrations were first applied to the data set. BMD analyzes were performed using a calcium density of 0.25 g/mm3 and 0.75 g/mm3 CaHA calibration bar (phantom).
Fig. 1.
Transection of femur for micro CT analysis (a) Transection from the femur, (b) The whole part of the section (c) The trabecular part of the section, (d) Section view from above: Cortical and trabecular part
Analysis of Images with Micro CT
363 raw images were obtained from each sample and recorded in TIFF format and approximately 626 horizontal sections were obtained by reconstructing with NRecon (Ver. 1.6.10.2) program. The images obtained as a result of the reconstruction were recorded in BMP format. These sections were transferred to the CTAn (Ver. 1.16.4.1 +) program, which allows densitometric and morphometric measurements that is used for creating quantitative parameters and visual models. For the purpose to determine the boundaries of the area to be measured, semi-automatically circular relevant area ROI (Region of Interest) is drawn on the horizontal plane on the sections. A threshold value was determined in the histogram to distinguish between the voxels of the sample to be examined and the voxels of the surrounding air. The threshold value was determined on the histogram where the black voxel is denoted with zero (0) and represents the minimum intensity, while the white voxel is denoted with 255 and shows the maximum intensity. With the determined ROIs and threshold value data, cortical and trabecular volumetric ratios were calculated separately. The data of the samples were transferred to the CTVol (Ver. 2.3.2.0) program and the three-dimensional modeling images of the samples were obtained and shown below. BMD (g/cm3) as well as trabecular bone volume/trabecular tissue volume Tb.Bv/Tb.Tv (%), trabecular number Tb.N (mm−1), trabecular thickness Tb.Th (mm), cortical thickness Ct. Th (mm), trabecular separation Tb.Sp (mm) and structure model index SMI data were calculated with the software CTAn (Ver. 1.16.4.1 +).
Statistical Analysis
The data obtained were evaluated with IBM SPSS for windows 21.0 statistics package program. The data of control and experimental groups are given as arithmetic mean ± standard deviation (SD). In the statistical evaluation of the data, the test of conformity to normal distribution (Shapiro–Wilk) was first applied. One-way analysis of variance (One-Way ANOVA), one of the parametric test methods, was used in the analysis of normally distributed data, and non-parametric tests (Kruskal–Wallis) were used in the analysis of data that did not show normal distribution. In paired group comparisons, t test was used in independent groups if it was suitable for normal distribution, and Mann–Whitney U tests were used if non-parametric. Tukey method was used as Post Hoc test for variables where variance homogeneity could not be denied, and Tamhane's methods were used as Post Hoc test for variables without variance homogeneity. In the evaluation of all results, p < 0.05 value was considered statistically significant.
Results
Weight Measurements
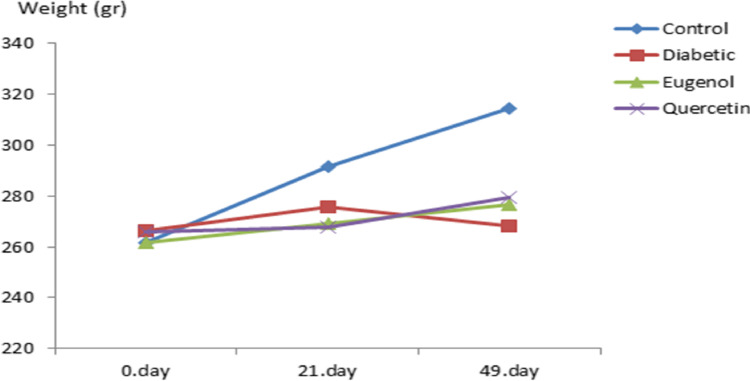
There is statistical significance as a result of variance analysis in repeated measurements of weight values (Fig. 2) according to time (the beginning of the experiment, day 0, 21 days after the beginning of the antioxidant substance administration and the end of the experiment, 49th day) and groups of weight changes measured in control and experimental groups (p < 0.001).
Fig. 2.
Weight follow up of control and experimental groups
Blood Glucose Measurements
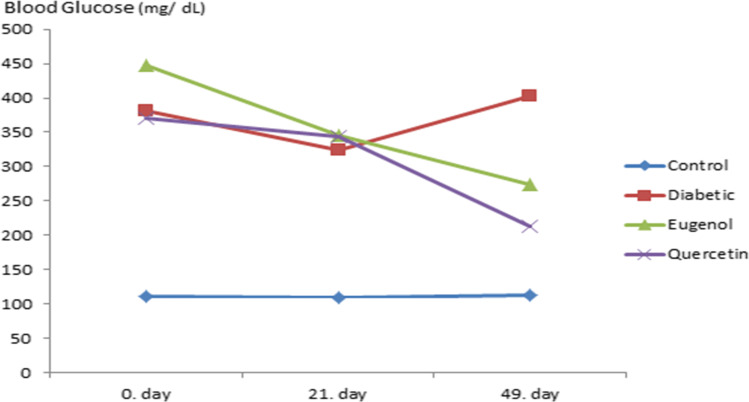
There is statistical significance as a result of variance analysis in repeated measurements of blood glucose values (Fig. 3) according to time (the beginning of the experiment, day 0, 21 days after the beginning of the antioxidant substance administration and the end of the experiment, 49th day) and groups of blood glucose changes measured in control and experimental groups (p < 0.001).
Fig. 3.
Blood glucose follow up of control and experimental groups
Measurement of GSH Levels
The results of statistical evaluation of GSH levels obtained by ELISA method in rat sera in control and experimental groups with mean and standard deviation values are given in Fig. 4.
Fig. 4.
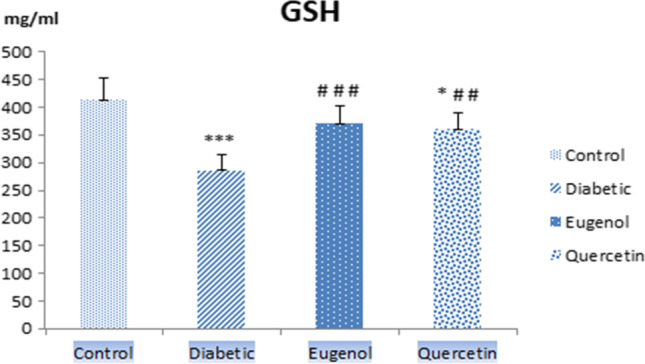
Serum GSH levels of control, diabetic, eugenol and quercetin groups. Data were expressed as mean ± standard deviation (SD) (n = 7). *p < 0.05, ***p < 0.001 vs control, ##p < 0.01, ###p < 0.001 vs diabetic
When serum GSH levels were evaluated, diabetic group values decreased compared to control group and were found to be statistically significant (p < 0.001). The alteration in the levels of quercetin group was found to be significant with control group (p < 0.05). Serum GSH level of the group treated with eugenol (p < 0.001) and quercetin (p < 0.01) increased compared to the diabetic group and these levels were found to be statistically significant.
Scanning and Analysis of Femurs with Micro CT
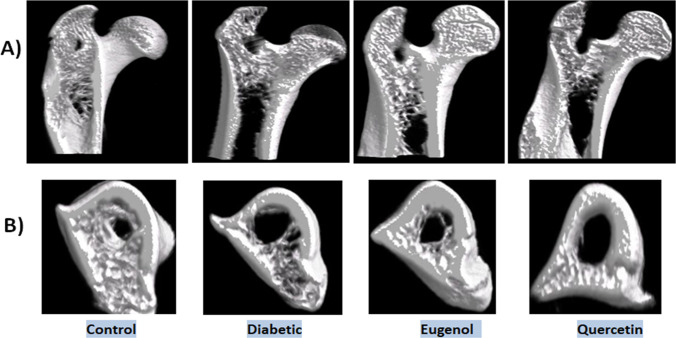
The bone structure images obtained by micro CT from the right femurs of the rats in control and experimental groups are given in Fig. 5.
Fig. 5.
Micro CT images of the 4.85 mm section of the rat femur in the control and experimental groups (A) Micro CT images of the rat femoral head in the control and experimental groups (B)
When the micro CT images of control and experimental groups are examined in Fig. 5, deformations are seen in the trabecular bone, especially in the diabetic group, compared to control group. It was observed that the deformation in the trabecular bone structure is less in the treatment groups where eugenol and quercetin are applied as antioxidants compared to diabetic group.
BMD, Tb.Bv/Tb.Tv, Tb.N, Tb.Th, Ct.Th, Tb.Sp, and SMI data are given that graphs of those found to be significant as a result of statistical analysis of (p < 0.05). BMD, Ct.Th, Tb.N, and Tb.Sp values were not statistically significant (p > 0.05).
When femur Tb.Th values (Fig. 6) were evaluated, diabetic group values decreased compared to control group and were found to be statistically significant (p < 0.01). Femur Tb.Th values also increased in the quercetin group compared to diabetic group and was statistically significant (p < 0.05).
Fig. 6.
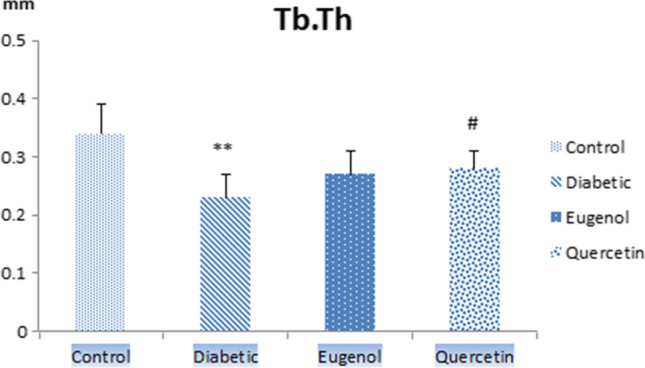
Femur Tb.Th values of control, diabetic, eugenol and quercetin groups. Data were expressed as mean ± standard deviation (SD) (n = 7). **p < 0.01 vs control group, #p < 0.05 diabetic group
When femur SMI values (Fig. 7) were evaluated, diabetic group had higher values compared to control group and were found to be statistically significant (p < 0.01). Femur SMI values were lower in quercetin group also compared to diabetic group and this value was found to be statistically significant (p < 0.01).
Fig. 7.
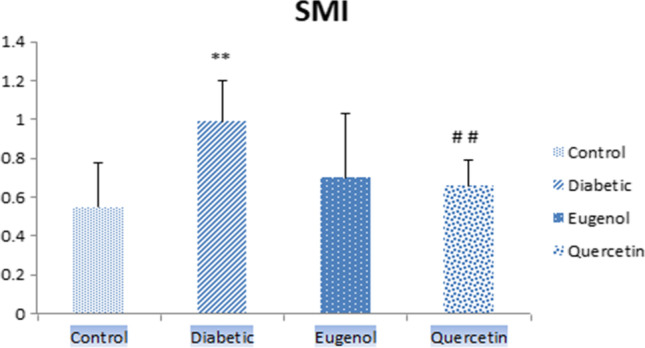
Femur SMI values of control, diabetic, eugenol and quercetin groups. Data were expressed as mean ± standard deviation (SD) (n = 7). **p < 0.01 vs control group ##p < 0.01 vs diabetic group
When femur Tb.BV/Tb.Tv values (Fig. 8) were evaluated, diabetic group values were lower compared to control group and it was found to be statistically significant (p < 0.001). The eugenol and quercetin groups were also found to be statistically significant compared to the control (p < 0.05).
Fig. 8.
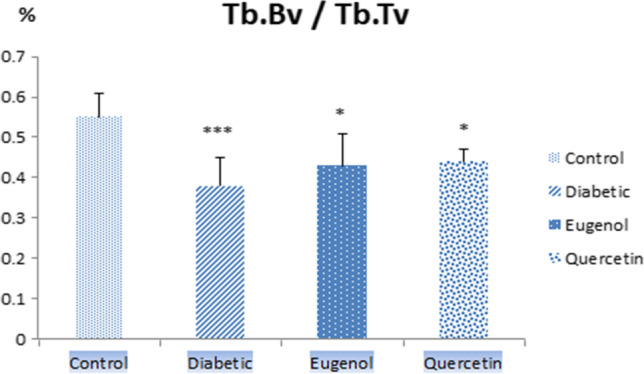
Tb.Bv/Tb.Tv values of control, diabetic, eugenol and quercetin groups. Data were expressed as mean ± standard deviation (SD) (n = 7). *p < 0.05, ***p < 0.001 vs control group
Discussion
Considering the increasing prevalence of DM, the importance of treatments to prevent complications that reduce the patients’ life quality ascends gradually. Invention of new drugs and improving the current treatment procedures are necessary to reduce mortality and morbidity associated with DM and its complications.
Improving evidence of experimental and clinical studies points out that oxidative stress has a crucial effect in the pathogenesis and progression of diabetic tissue damage. Although the inhibition of oxidative stress by antioxidants resulting from hyperglycemia cannot be completely reversed after the complications of DM are fully revealed, it has been proven to prevent the clinical onset of complications by therapy that slows the progression of the disease or preventive treatment before the occurrence of tissue damage.
In this study, 21 days after the STZ-NA induced T2 DM model was designed, a statistically significant difference was found according to the weight values of the rats in the diabetic group at the beginning and end of the experiment (p < 0.05). During the development of diabetic neuropathy, there was no significant weight loss in rats, and a moderate course was observed in their weight between 21 and 49 days due to the nature of T2 DM. Statistically significant differences were observed in the weight values between the beginning of the experiment and 21 days and after of 49 days in the eugenol group (p < 0.01).
T2 DM is characterized by high blood glucose levels due to hyperglycemia. When the statistical significance of blood glucose values in the present study were evaluated by time in the groups; significant differences were found between the beginning of the experiment and after 21 days (p < 0.05) and the end of the experiment (p < 0.01) in the eugenol group. Similarly, in quercetin group, statistically significant differences were found between the beginning of the experiment and the end of the experiment (p < 0.001) and between the 21 days and the end of the experiment (p < 0.01).
Coskun et al. reported that quercetin treatment preserved most beta cells in an experimental STZ-induced DM model in rats. They suggested that quercetin exerted a protective effect by reducing lipid peroxidation and increasing antioxidant enzyme activity [18]. It has been reported that quercetin treatment might prevent the development of late complications in various tissues due to chronic hyperglycemia [19].
There are many studies on the effects of quercetin, which belongs to the flavonoid group of phenolic compounds, in DM. Hypoglycemic and antidiabetic effects of quercetin (50 mg/kg) were observed in a study conducted in rats with STZ-NA induced experimental diabetic [17].The reason why eugenol, another group of phenolic compounds, belonging to phenolic acids, was chosen to the present study as a second antioxidant was that there had not been much research on its effects in DM and its effect in the STZ-NA model had not been studied before. It has been found that feeding db/db mice with clove extracts (eugenol) clearly lowers blood glucose and HbA1c levels [20]. In a hyperglycemia study induced by HFD in C57BL/6 J mice, eugenol was administered orally at 20 and 40 mg/kg separately for 15 weeks, plasma glucose and insulin levels diminished 31% and 63%, respectively, compared to the HFD control. It was revealed that the inhibition of glucose production by eugenol had a therapeutic significance for T2 DM [16].
GSH inhibits free radicals by taking place in detoxification reactions and supports the maintenance of normal cell organization and metabolism by sustaining redox homeostasis. It is reported that GSH levels in diabetic patients are significantly lower than healthy controls. The decrease in GSH levels in DM shows that its consumption by the body against oxidative stress increases [21, 22]. It has been revealed that eugenol treatment in diabetic rats significantly lowered MDA, which is an end products in lipid peroxidation pathogenesis, levels and enhanced levels of GSH, the non-enzymatic antioxidant. Due to these findings, it is proposed that eugenol is useful, as a protective phenolic acid for oxidative stress in HFD/STZ-induced DM, at least partially, by impairing lipid peroxidation and increasing free radical scavenging activity [10].
A decrease in GSH levels due to DM has been revealed as a result of studies in blood and tissue studies. GSH levels were analyzed by ELISA method in the control and experimental groups (diabetic, eugenol and quercetin) in rat sera. When serum GSH levels were evaluated, levels in diabetic group decreased compared to control group and were found to be statistically significant (p < 0.01). The GSH level of eugenol and quercetin group increased compared to diabetic group and this value was found to be statistically significant (p < 0.001). When we evaluated the GSH results, the decreased GSH levels in diabetic group were analyzed to be higher due to the antioxidant roles of eugenol and quercetin compared to control group.
T1 DM is usually associated with a decrease in BMD, but alteration of BMD is not evident in T2 DM osteoporosis. Compared to T1 DM osteoporosis, osteoporosis pathogenesis of T2 DM is more complex and the incidence of T2 DM is higher than the one of T1 DM. STZ-NA T2 DM experimental animal model was used in the present study due to the lack of research on the effect of bone structure in DM and morphometry in the STZ-NA T2 DM model.
Ma et al. performed micro CT analyzes on rat femurs obtained from the DM model induced by STZ and HFD. They reported that DM was related with deformations in trabecular bone microarchitecture at femurs. In addition, they had reported reduction of values of Bv/Tv, Tb.N and Tb.Th, on the other hand, increase of trabecular spaces (Tb.Sp) (p < 0.05) and SMI (p < 0.05). These results indicated that bone fragility was significantly increased in diabetic rats and there was a significant decrease in structural strength and rigidity in bone [1]. In the femur analysis results of Perez Castrillon et al.'s obesity-related DM model with micro CT; they found no change in BMD values compared to control group. Similarly, they did not report a statistically significant alteration in values of Tb.Sp, Tb.N and Ct.Th. They showed that Bv/Tv and SMI values decreased in the diabetic group [23]. They showed that in the micro CT analysis of ZDF rat tibiae showing similarity with T2 DM, the values of BMD, Tb.N, Tb.Sp and Tb.Th results did not alter significantly compared to control and that the values of Bv/Tv, Tb.Th and Ct.Th decreased in diabetic group compared to the control group [24]. Kanter et al. reported that plasma calcium and magnesium levels and Bv/Tv, Tb.N, Tb.Th values increased as a result of 15 mg/kg quercetin administration to Wistar Albino rats for 4 weeks in the STZ-induced DM model [25]. Liang et al. showed that while the antioxidant properties of quercetin on the bone structure of STZ-induced Sprague–Dawley rats increased BMD, Tb.N, Tb.Th, Bv/Tv and Cr.Th values, Tb.Sp and SMI values decreased [26]. It presented that quercetin ameliorated bone microarchitecture by recovering the decrease in Bv/Tv and Tb.N and the increase in Tb.Sp and SMI in trabecular bone by micro CT analysis [27].
In this study, when the femur Tb.Th values were evaluated, the diabetic group values decreased compared to control group and were found to be statistically significant (p < 0.01). Tb.Th values also increased in quercetin group compared to the diabetic group and this value was found to be statistically significant (p < 0.05). When femur SMI values were evaluated, diabetic group values increased compared to control group and were found to be statistically significant (p < 0.01). Femur SMI values also decreased in quercetin group compared to diabetic group and was found to be statistically significant (p < 0.01). When femur Tb.Bv/Tb.Tv values were evaluated, diabetic group values decreased compared to control group and were found to be statistically significant (p < 0.001). Femur Tb.Bv/Tb.Tv values in the eugenol and quercetin groups were also found to be statistically significant compared to control (p < 0.05). The femur micro CT analysis findings were found to be consistent with the results of the studies conducted by Ma, Perez Castrillon, Kanter and Liang et al. [1, 23, 25, 26].
In a study conducted in STZ-induced mice, there was a decrease in the cortical structure and trabecular microarchitecture of diabetic bone compared to control. It has been reported that as the duration of DM increases, insulin deficiency can affect bone structure [4]. In diabetic mice, quercetin has been shown to reduce bone loss against osteopenia through its antioxidant effect [26]. The protective properties of eugenol against experimentally induced alveolar bone loss have been reported. Eugenol has osteoprotective effects due to its capacity to suppress local and systemic inflammatory signaling pathways and its ability to enhance osteoclastogenesis modulating factors [28].
When the femur Tb.Th and Tb.Bv/Tb.Tv and SMI values were evaluated together, the difference in the diabetic group compared to control group was found to be statistically significant. Quercetin was determined to be statistically significant in all of these values due to its antioxidant role. On the other hand, eugenol showed its antioxidant effect in Tb.Bv/Tb.Tv values.
Hua et al. showed that rats in the DM group experienced severe bone loss compared to the control group, whereas the bone mass of the diabetic rats in the resveratrol treatment group increased significantly and their Tb.Th values were lower in the diabetic group compared to the control and resveratrol groups [29]. Zeitoun et al. reported that while Zucker diabetic fatty rat femurs showed a significantly lower trabecular bone volume (Tb.BV) and trabecular thickness (Tb.Th) than the control group, they showed higher SMI values [30].
It was found that DM in STZ-induced female Wistar rats decreased cortical bone mineralization, but didn’t affect the cortical tissue mineralization density (Ct.TMD) in male Fischer 344 and Sprague Dawley rats. In the long term DM model created in STZ-induced mice, they reported that DM not only affects bone composition and microarchitecture, but also impairs the relationship between strength and structure, decreases tissue level rigidity and increases bone fragility [4]. Evidence has been demonstrated that oral administration of quercetin can partially reverse osteopenia in animal models, possibly through its antioxidant, antiinflammatory, inducing osteogenesis, inhibiting osteoclasts and estrogen-like effect [31].
BMD, Ct.Th, Tb.N and Tb.Sp values were not statistically significant (p > 0.05). Diabetic rats weigh less than control rats and this difference may result in a reduction in bone size and structural strength as an indirect result of mechanical adaptation. We consider that this might be the underlying cause of the results. Since BMD in T2 DM is a controversial issue, no significance was found in the present study.
Bone loss and fractures are poorly recognized complications of DM and are primarily due to impaired bone formation by osteoblasts. The mechanisms that lead to osteoblast dysfunction in DM have not been fully understood. Nevertheless, oxidative stress caused by insulin deficiency, poor glycemic control, and hyperglycemia probably contributes to osteoblast dysfunction [26]. Since the effects of eugenol and quercetin with antioxidant properties on both the STZ-NA T2 DM model and the bone complications of DM have not been investigated, they were used in this study. These two antioxidant substances were found to have positive effects on the rat femur in Tb.Th, Tb.Bv/Tb.Tv and SMI parameters compared to the control and diabetic groups.
Limitations of the study; the data we collected for analysis was limited due to the number of experimental animals. Also, biomechanical testing has not been performed. We consider that more robust evidence is needed to determine how molecular mechanisms function in an in-vitro model related with the direct effects of eugenol and quercetin on osteoblasts and osteoclasts.
Although there are studies on the effects of DM on the skeleton, biochemical, radiologic and histologic imaging techniques give out conflicting findings. The reason for this may be due to the duration and treatment of DM in different studies, the complex physiopathology of DM, the diversity of the bone regions examined, and the differences in the techniques used for investigate bone microarchitecture.
Conclusion
We think that understanding the effects of hyperglycemia induced oxidative stress related complications on bone in T2 DM would contribute to the development of clinical tests that provide earlier clinical intervention and prevention, and their use in diagnosis and treatment. In the experimental STZ-NA T2 DM model, it was found that eugenol and quercetin have antioxidant, antidiabetic and osteoprotective effects on the change of bone structure. We postulate that eugenol and quercetin might be therapeutic agents to prevent and treat bone loss in the increasing population of DM worldwide.
Acknowledgements
This study was supported by the Scientific Research Projects Unit of Istanbul University with the project number 22448. The authors report no conflict of interest.
Declarations
Competing Interests
The authors declare that they have no confict of interest.
Footnotes
Publisher's note
Springer Nature remains neutral with regard to jurisdictional claims in published maps and institutional affiliations.
Contributor Information
Aycan Baş, Email: aycanbas@gmail.com.
Işıl Albeniz, Email: ialbeniz@istanbul.edu.tr.
References
- 1.Ma R, Wang L, Zhao B, Liu C, Liu H, et al. Diabetes Perturbs Bone Microarchitecture and Bone Strength through Regulation of Sema3A/IGF-1/β-Catenin in Rats. Cell Physiol Biochem. 2017;41(1):55–66. doi: 10.1159/000455936. [DOI] [PubMed] [Google Scholar]
- 2.Schwartz AV. Diabetes Mellitus: Does it Affect Bone? Calcif Tissue Int. 2003;73(6):515–519. doi: 10.1007/s00223-003-0023-7. [DOI] [PubMed] [Google Scholar]
- 3.Brandi ML. Bone health and diabetes Medicographia. 2010;32:364–369. [Google Scholar]
- 4.Nyman JS, Even JL, Jo CH, Herbert EG, Murry MR, et al. Increasing duration of type 1 diabetes perturbs the strength-structure relationship and increases brittleness of bone. Bone. 2011;48(4):733–740. doi: 10.1016/j.bone.2010.12.016. [DOI] [PMC free article] [PubMed] [Google Scholar]
- 5.Kawashima Y, Fritton JC, Yakar S, Epstein S, Schaffler MB, et al. Type 2 Diabetic Mice Demonstrate Slender Long Bones with Increased Fragility Secondary to Increased Osteoclastogenesis. Bone. 2009;44(4):648–655. doi: 10.1016/j.bone.2008.12.012. [DOI] [PMC free article] [PubMed] [Google Scholar]
- 6.Masiello P, Broca C, Gross R, Roye M, Manteghetti M, et al. Experimental NIDDM: development of a new model in adult rats administered streptozotocin and nicotinamide. Diabetes. 1998;47(2):224–229. doi: 10.2337/diab.47.2.224. [DOI] [PubMed] [Google Scholar]
- 7.Glorie L, Behets GJ, Baerts L, De Meester I, D'Haese PC, et al. DPP IV inhibitor treatment attenuates bone loss and improves mechanical bone strength in male diabetic rats. Am J Physiol Endocrinol Metab. 2014;307(5):E447–455. doi: 10.1152/ajpendo.00217.2014. [DOI] [PubMed] [Google Scholar]
- 8.Vessal M, Hemmati M, Vasei M. Antidiabetic effects of quercetin in streptozocin-induced diabetic rats. Comp Biochem Physiol C Toxicol Pharmacol. 2003;135C(3):357–364. doi: 10.1016/S1532-0456(03)00140-6. [DOI] [PubMed] [Google Scholar]
- 9.Eid HM, Nachar A, Thong F, Sweeney G, Haddad PS. The molecular basis of the antidiabetic action of quercetin in cultured skeletal muscle cells and hepatocytes. Phcog Mag. 2015;11(41):74–81. doi: 10.4103/0973-1296.149708. [DOI] [PMC free article] [PubMed] [Google Scholar]
- 10.Al-Trad B, Alkhateeb H, Alsmadi W, Al-Zoubi M. Eugenol ameliorates insulin resistance, oxidative stress and inflammation in high fat-diet/streptozotocin-induced diabetic rat. Life Sci. 2019;216:183–188. doi: 10.1016/j.lfs.2018.11.034. [DOI] [PubMed] [Google Scholar]
- 11.Vianna AGD, Sanches CP, Barreto FC. Effects of type 2 diabetes therapies on bone metabolism. Diabetol Metab Syndr. 2017;9:75. doi: 10.1186/s13098-017-0274-5. [DOI] [PMC free article] [PubMed] [Google Scholar]
- 12.Usuki S, Ito Y, Morikawa K, Kise M, Ariga T, et al. Effect of pre-germinated brown rice intake on diabetic neuropathy in streptozotocin-induced diabetic rats. Nutr Metab (Lond) 2007;4:25. doi: 10.1186/1743-7075-4-25. [DOI] [PMC free article] [PubMed] [Google Scholar]
- 13.Kalyanaraman H, Schwaerzer G, Ramdani G, Castillo F, Scott BT, et al. Protein Kinase G Activation Reverses Oxidative Stress and Restores Osteoblast Function and Bone Formation in Male Mice With Type 1 Diabetes. Diabetes. 2018;67(4):607–623. doi: 10.2337/db17-0965. [DOI] [PMC free article] [PubMed] [Google Scholar]
- 14.Rubin MR. Skeletal fragility in diabetes. Ann NY Acad Sci. 2017;1402(1):18–30. doi: 10.1111/nyas.13463. [DOI] [PubMed] [Google Scholar]
- 15.Szkudelski T. Streptozotocin-nicotinamide-induced diabetes in the rat. Characteristics of the experimental model. Exp Biol Med (Maywood). 2012;237(5):481–490. doi: 10.1258/ebm.2012.011372. [DOI] [PubMed] [Google Scholar]
- 16.Jeong KJ, Kim do Y, Quan HY, Jo HK, Kim GW, , et al. Effects of eugenol on hepatic glucose production and AMPK signaling pathway in hepatocytes and C57BL/6J mice. Fitoterapia. 2014;93:150–162. doi: 10.1016/j.fitote.2013.12.023. [DOI] [PubMed] [Google Scholar]
- 17.Torres-Piedra M, Ortiz-Andrade R, Villalobos-Molina R, Singh N, Medina-Franco JL, et al. A comparative study of flavonoid analogues on streptozotocin-nicotinamide induced diabetic rats: quercetin as a potential antidiabetic agent acting via 11beta-hydroxysteroid dehydrogenase type 1 inhibition. Eur J Med Chem. 2010;45(6):2606–2612. doi: 10.1016/j.ejmech.2010.02.049. [DOI] [PubMed] [Google Scholar]
- 18.Coskun O, Kanter M, Korkmaz A, Oter S. Quercetin, a flavonoid antioxidant, prevents and protects streptozotocin-induced oxidative stress and beta-cell damage in rat pancreas. Pharmacol Res. 2005;51(2):117–123. doi: 10.1016/j.phrs.2004.06.002. [DOI] [PubMed] [Google Scholar]
- 19.Dias AS, Porawski M, Alonso M, Marroni N, Collado PS, et al. Quercetin decreases oxidative stress, NF-kappaB activation, and iNOS overexpression in liver of streptozotocin-induced diabetic rats. J Nutr. 2005;135(10):2299–2304. doi: 10.1093/jn/135.10.2299. [DOI] [PubMed] [Google Scholar]
- 20.Sanae F, Kamiyama O, Ikeda-Obatake K, Higashi Y, Asano N, et al. Effects of eugenol-reduced clove extract on glycogen phosphorylase b and the development of diabetes in db/db mice. Food Funct. 2014;5(2):214–219. doi: 10.1039/C3FO60514K. [DOI] [PubMed] [Google Scholar]
- 21.Dokumacioglu E, Iskender H, Sen TM, Ince I, Dokumacioglu A, et al. The effects of hesperidin and quercetin on serum tumor necrosis factor-alpha and interleukin-6 levels in streptozotocin-induced diabetes model. Phcog Mag. 2018;14:167–173. doi: 10.4103/pm.pm_41_17. [DOI] [PMC free article] [PubMed] [Google Scholar]
- 22.Soliman GZA. Blood lipid peroxidation (superoxide dismutase, malondialdehyde, glutathione) levels in Egyptian type 2 diabetic patients. Singapore Med J. 2008;49(2):129–136. [PubMed] [Google Scholar]
- 23.Perez Castrillon JL, Riancho Moral JA, De Luis D, Caeiro Rey JR, Guede Rodríguez D, et al. Structural study using micro-CT of the femur of Goto-Kakizaki rats, experimental model for non-overweight type 2 diabetes. Rev Osteoporos Metab Miner. 2011;3(2):95–100. [Google Scholar]
- 24.Pereira M, Gohin S, Lund N, Hvid A, Smitham PJ, et al. Sclerostin does not play a major role in the pathogenesis of skeletal complications in type 2 diabetes mellitus. Osteoporos Int. 2017;28(1):309–320. doi: 10.1007/s00198-016-3718-0. [DOI] [PMC free article] [PubMed] [Google Scholar]
- 25.Kanter M, Altan MF, Donmez S, Ocakci A, Kartal ME. The effects of quercetin on bone minerals, biomechanical behavior, and structure in streptozotocin-induced diabetic rats. Cell Biochem Funct. 2007;25(6):747–752. doi: 10.1002/cbf.1397. [DOI] [PubMed] [Google Scholar]
- 26.Liang W, Luo Z, Ge S, Li M, Du J, et al. Oral administration of quercetin inhibits bone loss in rat model of diabetic osteopenia. Eur J Pharmacol. 2011;670(1):317–324. doi: 10.1016/j.ejphar.2011.08.014. [DOI] [PubMed] [Google Scholar]
- 27.Niu YB, Yang YY, Xiao X, Sun Y, Zhou YM, et al. Quercetin prevents bone loss in hindlimb suspension mice via stanniocalcin 1-mediated inhibition of osteoclastogenesis. Acta Pharmacol Sin. 2020;41(11):1476–1486. doi: 10.1038/s41401-020-00509-z. [DOI] [PMC free article] [PubMed] [Google Scholar]
- 28.Abuohashish HM, Khairy DA, Abdelsalam MM, Alsayyah A, Ahmed MM, et al. In-vivo assessment of the osteo-protective effects of eugenol in alveolar bone tissues. Biomed Pharmacother. 2018;97:1303–1310. doi: 10.1016/j.biopha.2017.11.068. [DOI] [PubMed] [Google Scholar]
- 29.Hua Y, Bi R, Li Z, Li Y. Resveratrol treatment promotes titanium implant osseointegration in diabetes mellitus rats. J Orthop Res. 2020;38(10):2113–2119. doi: 10.1002/jor.24651. [DOI] [PubMed] [Google Scholar]
- 30.Zeitoun D, Caliaperoumal G, Bensidhoum M, Constans JM, Anagnostou F, Bousson V. Microcomputed tomography of the femur of diabetic rats: alterations of trabecular and cortical bone microarchitecture and vasculature-a feasibility study. Eur Radiol Exp. 2019;3(1):17. doi: 10.1186/s41747-019-0094-5. [DOI] [PMC free article] [PubMed] [Google Scholar]
- 31.Huang YY, Wang ZH, Deng LH, Wang H, Zheng Q. Oral Administration of Quercetin or Its Derivatives Inhibit Bone Loss in Animal Model of Osteoporosis. Oxid Med Cell Longev. 2020;Vol.2020, Article ID 6080597, 21 pages. 10.1155/2020/6080597 [DOI] [PMC free article] [PubMed]


