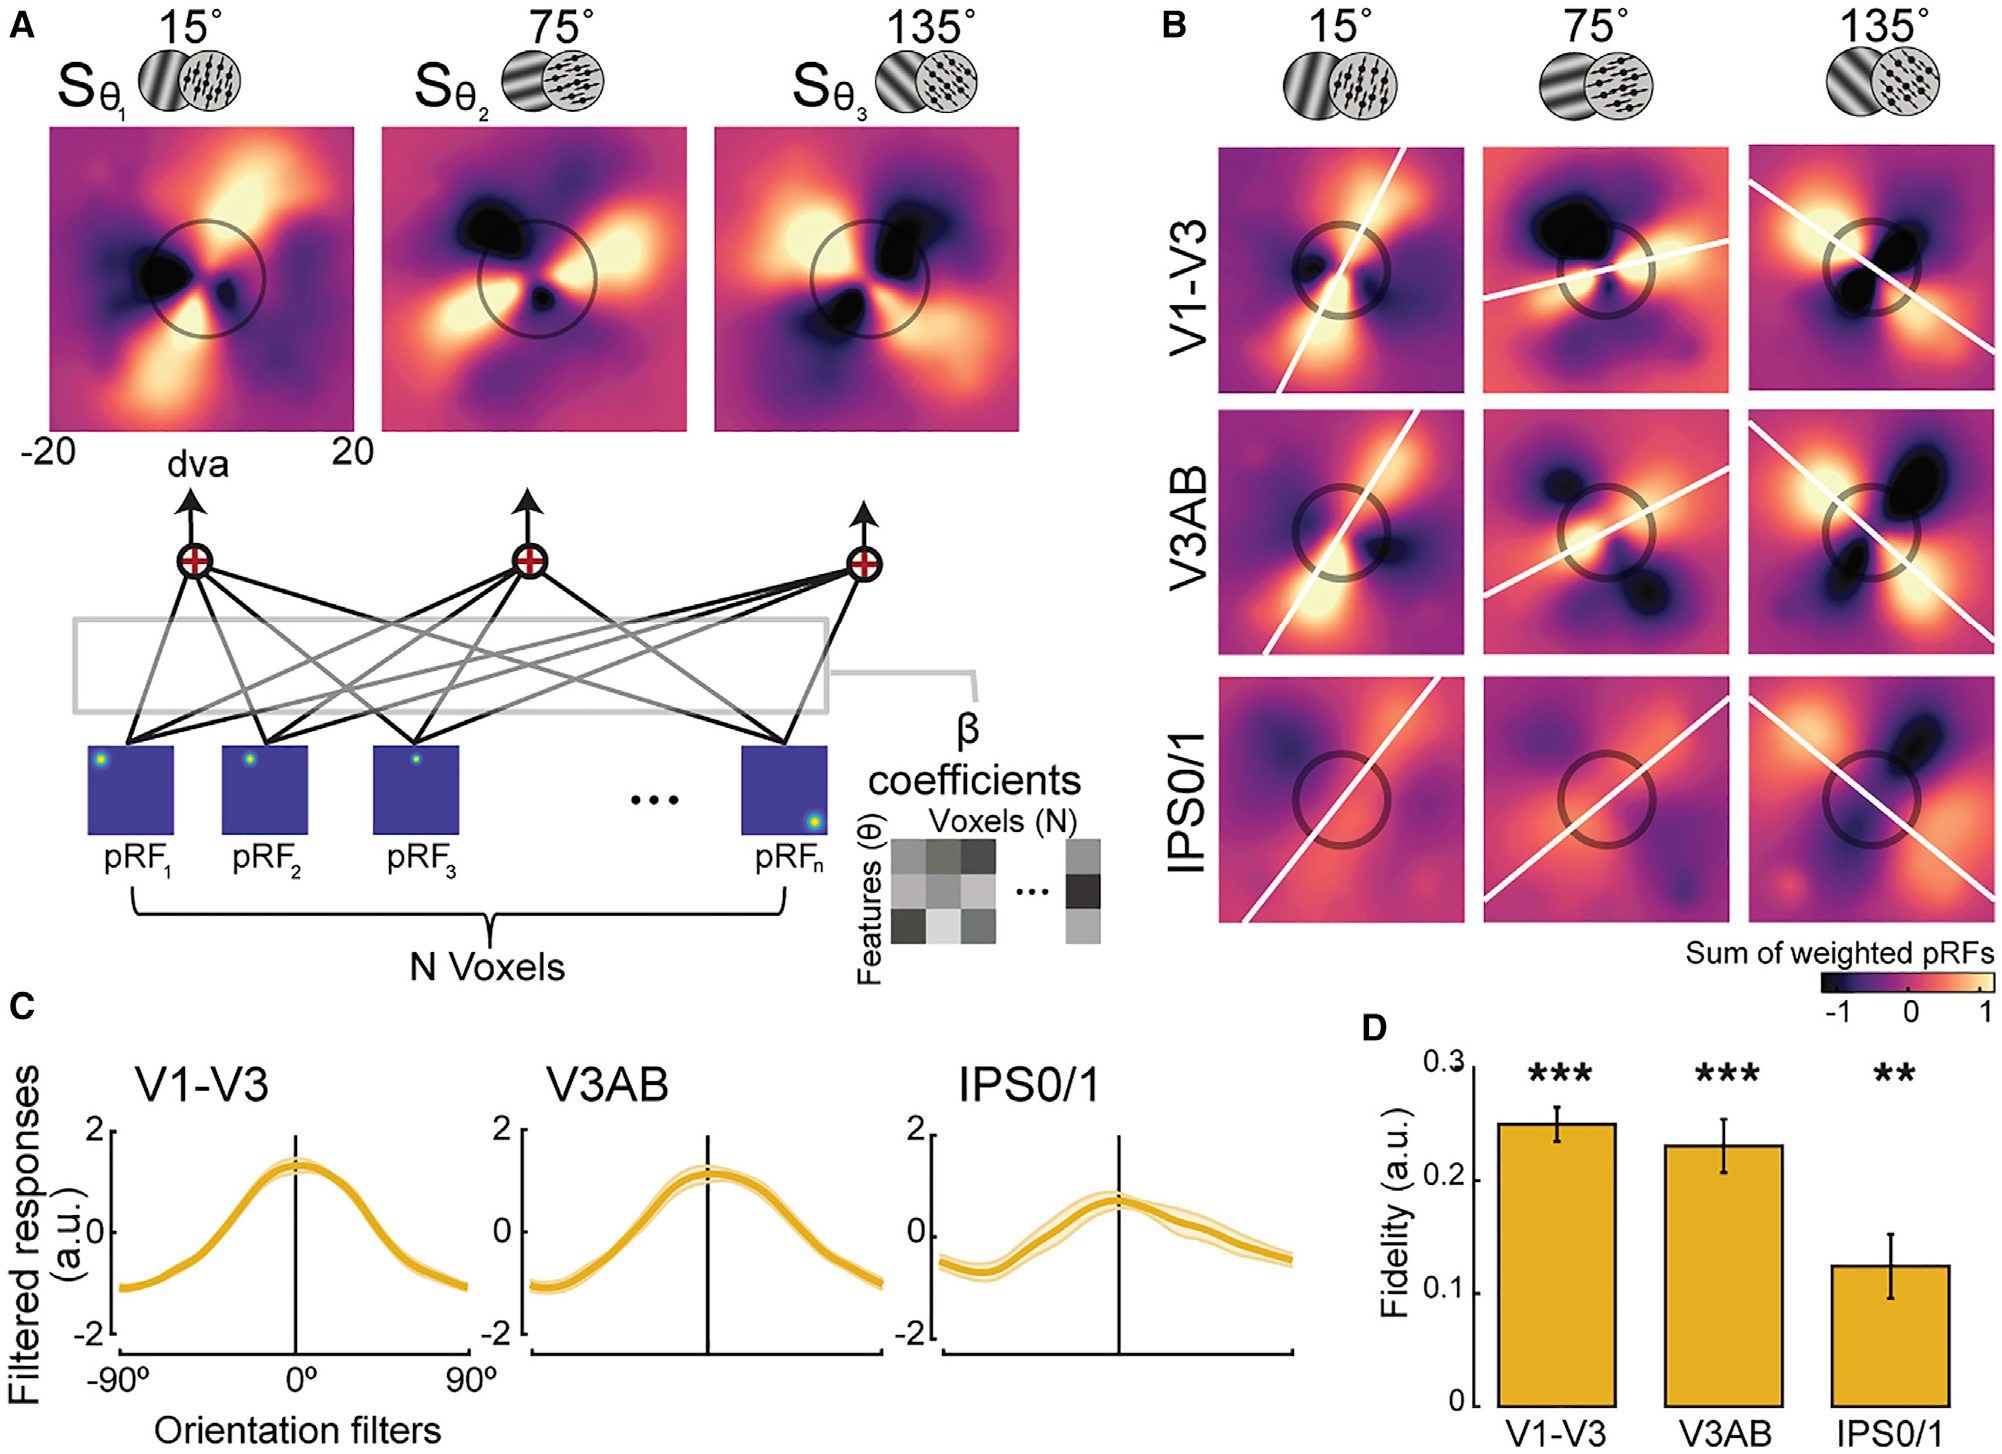
Figure 3. Unveiling the recoded formats of working memory representations for orientation and motion direction.

(A) Spatial reconstruction analysis schematics. Voxel activity for each feature condition (orientation/direction; θ) was projected onto visual field space (dva, degrees of visual angle) by computing the sum (S) of voxels’ pRFs weighted by their response amplitudes during the memory delay (β) (see Equation 1; STAR Methods for details).
(B) Population reconstruction maps. Lines across visual space matching the remembered angles of the stimuli emerged from the amplitudes of topographic voxel activity. Best fitting lines (white lines) and the size of the stimulus presented during the encoding epoch (black circles) are shown. See Figure S2 for other ROIs. (C and D) To quantify the amount of remembered information consistent with the true feature, we computed filtered responses and associated fidelity values from the maps in (B). Filtered responses represent the sum of pixel values within the area of a line-shaped mask oriented −90° to 90° (0° represents the true feature), and fidelity values are the result of projecting the filtered responses to 0° (STAR Methods). Higher fidelity values indicate stronger representation. **p < 0.01, ***p < 0.001, corrected (p values in Table S1). Error bars represent ±1 SEM.
