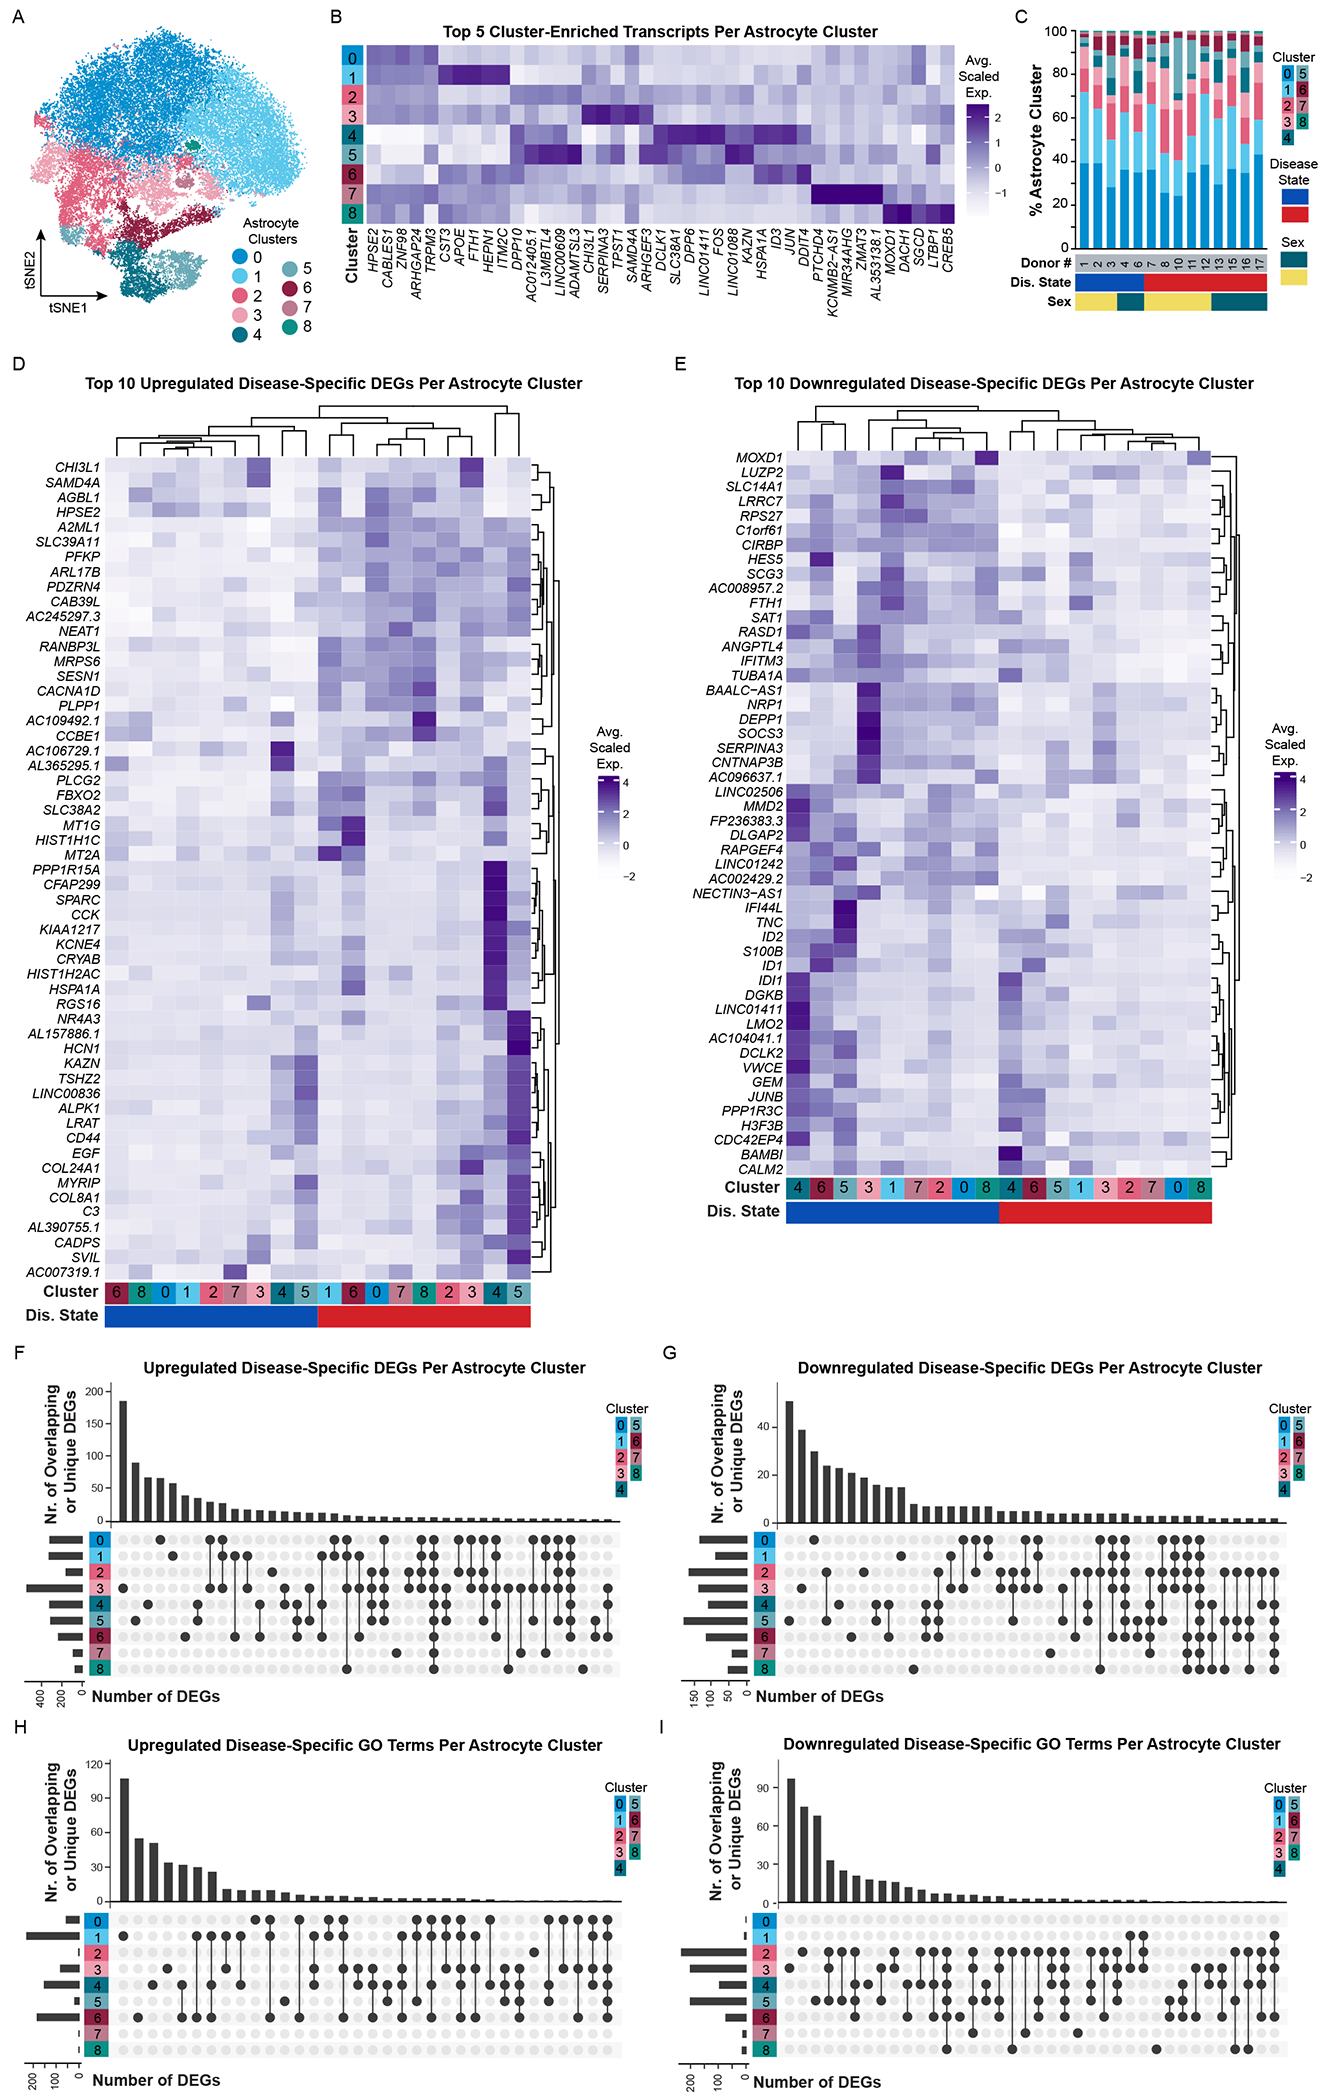
Figure 4. Astrocytes are heterogeneous and have both common and cluster-specific transcriptomic changes in Alzheimer’s disease.

(A) tSNE plot of astrocyte nuclei (N = 41,071) and (B) corresponding average scaled expression heatmap of top 5 enriched/unique transcripts per cluster. (C) Proportion of astrocyte clusters identified in each donor. Additional donor metavariables highlighted include disease state (blue, NS donors; red, AD donors) and sex (green, female; yellow, male). Average scaled expression of the top 10 (D) upregulated and (E) downregulated disease-specific differentially expressed genes (DEGs) split by cluster. (F-I) UpSetR plots highlighting upregulated and downregulated DEGs or GO terms that are unique to or shared between clusters. Abbreviations: AD, Alzheimer’s disease; D#, donor number; DEG, differentially expressed gene; Dis., disease; F, female; GO, gene ontology; M, male; NS, non-symptomatic. See also Figure S11.
