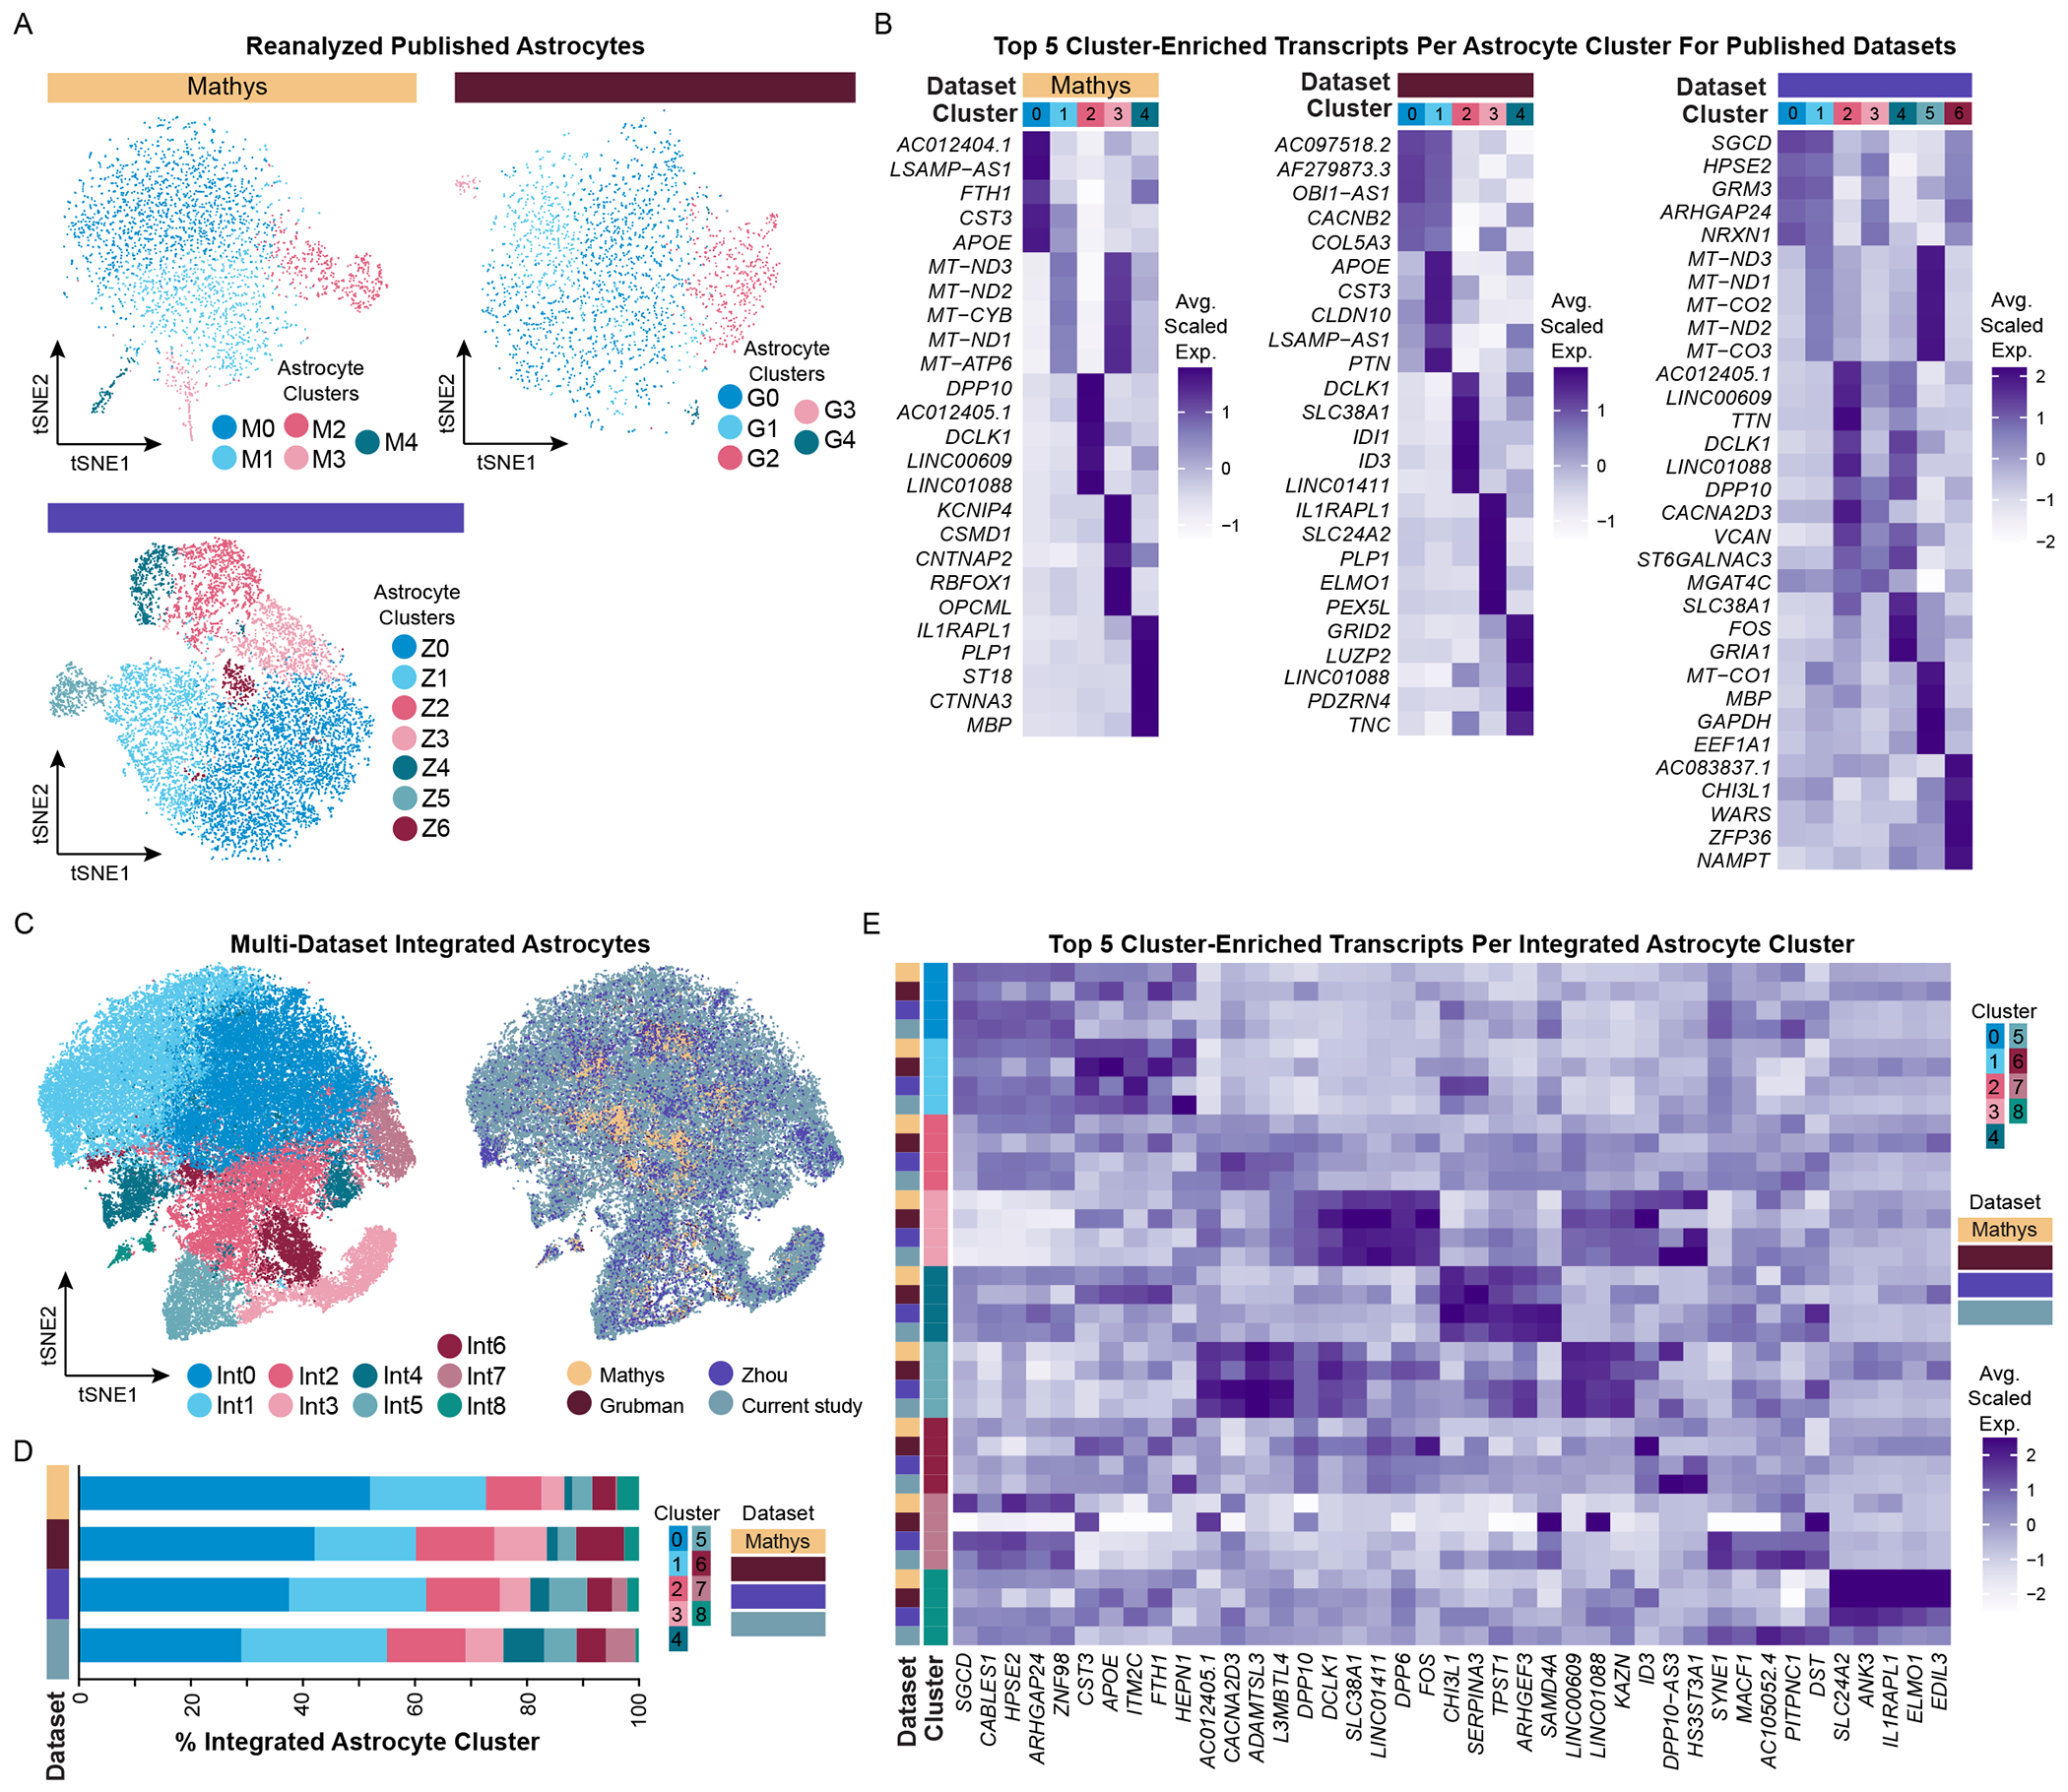
Figure 7. Integrating astrocyte snRNA-seq datasets allows for improved resolution of unique astrocyte subpopulations.

(A) tSNE plots of reanalyzed astrocytes from published snRNA-seq AD datasets (Mathys, N = 3,079; Grubman, N = 2,330; Zhou, N = 10,538) and (B) their corresponding average scaled expression heatmap of the top 5 cluster-enriched/unique transcripts. (C) tSNE plots of integrated astrocytes (N = 57,018) as visualized by cluster (left) and by dataset (right). Mathys data are in yellow, Grubman data are in dark red, Zhou data are in violet, and the current study’s data are in steel blue. (D) Proportion of integrated astrocyte clusters identified in the integrated dataset. (E) Average scaled expression heatmap of top 5 integrated astrocyte cluster-enriched/unique transcripts by cluster and by dataset. See also Figures S1, S3, S6–S8, S13.
