

Abstract
Purpose:
Our understanding of the immunopathology of resectable NSCLC is still limited. Here, we explore immune programs that inform of tumor immunity and response to neoadjuvant chemotherapy and chemoimmunotherapy in localized NSCLC.
Experimental design:
Targeted immune gene sequencing using the HTG Precision Immuno-Oncology panel was performed in localized NSCLCs from three cohorts based on treatment: naïve (n=190), neoadjuvant chemotherapy (n=38) and neoadjuvant chemoimmunotherapy (n=21). Tumor immune microenvironment (TIME) phenotypes based on the location of CD8+ T cells (inflamed, cold, excluded), tumoral PD-L1 expression (<1% and ≥1%), and tumor infiltrating lymphocytes (TILs). Immune programs and signatures were statistically analyzed based on tumoral PD-L1 expression, immune phenotypes, pathological response and were cross-compared across the three cohorts.
Results:
PD-L1 positive tumors exhibited increased signature scores for various lymphoid and myeloid cell subsets (p<0.05). TIME phenotypes exhibited disparate frequencies by stage, PD-L1 expression, and mutational burden. Inflamed and PD-L1+/TILs+ NSCLCs displayed overall significantly heightened levels of immune signatures, with the excluded group representing an intermediate state. A cytotoxic T cell signature was associated with favorable survival in neoadjuvant chemotherapy-treated NSCLCs (p<0.05). Pathological response to chemoimmunotherapy was positively associated with higher expression of genes involved in immune activation, chemotaxis, as well as T and NK cells (p<0.05 for all). Among the three cohorts, chemoimmunotherapy-treated NSCLCs exhibited highest scores for various immune cell subsets including T effector and B cells (p<0.05).
Conclusions:
Our findings highlight immune gene programs that may underlie host tumor immunity and response to neoadjuvant chemotherapy and chemoimmunotherapy in resectable NSCLC.
Keywords: Early-stage NSCLC, immunopathology, immune gene profiling, neoadjuvant chemotherapy, neoadjuvant chemoimmunotherapy
INTRODUCTION
While non-small cell lung cancer (NSCLC) remains the leading cause of cancer-related mortality, death rates due to this ominous cancer have declined in the past few years1. Enhanced early screening and diagnosis have increased the numbers of early-stage non-small cell lung cancers (NSCLCs)2,3. Also, new approaches using stereotactic body radiation for inoperable early-stage lung cancer 4 and immune checkpoint inhibitors (ICI) in the adjuvant setting are increasingly being established for clinical management of stage II to IIIA NSCLC with ≥ 1% tumoral PD-L1 expression5. Improved treatment of early-stage NSCLC heavily relies on understanding the molecular and immune biology of the malignancy. Indeed, recent emerging evidence points to reprogramming of the immune contexture in early stages in the pathogenesis of NSCLC6–8 thus providing rationale for immunotherapeutic strategies such as immune checkpoint inhibitors (ICI) in the resectable disease setting9,10.
Immunosuppression mediated by the PD-1/PD-L1 checkpoint pathway has been shown to underlie immune evasion by NSCLC11. Clinical studies have shown that ICIs targeting the PD-(L)1 axis mount an anti-tumor immune response that leads to favorable, and in some cases durable responses, in cancer patients, including those with advanced/unresectable NSCLC8,9. Of note, NSCLC patients exhibit variable responses to ICIs targeting PD-1 or PD-L113,14. Expression of PD-L1 protein by immunohistochemistry (IHC) is used to guide immunotherapeutic strategies in NSCLC15. Previous clinical trials14 showed that high tumoral and immune PD-L1 expression predict overall favorable response to ICI. Yet, a significant fraction of patients with PD-L1 positive (≥1%) tumors do not respond to ICIs14 and, conversely, other studies have demonstrated responses in patients whose NSCLCs are PD-L1 negative (<1%)16, thus highlighting the need for more reliable biomarkers to predict response to ICI.
Recent reports17–23 demonstrated promising results using neoadjuvant ICI for treatment of resectable NSCLC. For instance, the phase II clinical trial by Provencio et al. (NADIM study) showed that chemoimmunotherapy (combination of nivolumab and platinum-based chemotherapy) elicited major pathological response (MPR) in the majority of resected patients17. More recently, a phase III clinical trial by Forde et al showed that neoadjuvant chemoimmunotherapy resulted in higher MPR rate (36.8%) compared with chemotherapy alone (8.6%)24. While these results are encouraging, the mechanisms by which neoadjuvant ICI in combination with chemotherapy elicit MPR in early-stage NSCLC are still largely unknown25.
To fill this void, we interrogated three cohorts with localized NSCLC that underwent upfront surgery or neoadjuvant chemotherapy, as currently established standard of care in this setting, and compared with patients that received neoadjuvant chemoimmunotherapy (platinum-based therapy plus anti-PD-1). Our results show that an augmented immune response is often observed in treatment-naïve patients with high tumor PD-L1 expression, while PD-L1 negative tumors exhibit heterogeneous host immune expression programs. We also find that chemoimmunotherapy elicits immune gene expression programs and phenotypes that are distinct from or absent in treatment-naïve or chemotherapy only-treated patient, thus highlighting potential markers and targets for immunotherapeutic response in early-stage NSCLC.
MATERIALS AND METHODS
Patient cohorts.
Patients with resectable NSCLC were classified based on preoperative treatment. A cohort of 190 treatment-naïve patients that underwent upfront surgery and a set of 38 patients that received neoadjuvant platinum-based chemotherapy followed by surgery were evaluated and treated at The University of Texas MD Anderson Cancer Center (Houston, Texas). The third cohort included patients who were enrolled in a multi-institutional clinical trial (NADIM clinical trial, NCT03081689, primary institution: Hospital Puerta de Hierro, Madrid, Spain) and treated with neoadjuvant chemotherapy plus anti-PD-1 (nivolumab) (chemoimmunotherapy cohort)17. Our study and analyses were approved by the relevant institutional review boards and were conducted according to the principles of the Helsinki Declaration. Informed wrriten consent was obtained from each subject or subject’s guardian. Detailed clinicopathological information including demographics, smoking history, pathologic tumor-node-metastasis stage, as well as overall and recurrence-free survival for all cases are summarized in Table 1. Mutational status of key driver genes, including KRAS, EGFR, STK11, and TP53, as well as somatic mutation burden (TMB) were previously characterized26 by whole-exome sequencing and were available for a subset of the cases (Table 1). Pathologic response to therapy was assessed by estimating the percentage of viable tumor cells (VTCs), necrosis and fibrosis. Pathologic response to neoadjuvant therapies was performed following a standardized approach to assess the percentage of viable tumor cells, necrosis and stroma (including inflammation and fibrosis) – all amounting to 100% of analyzed cells. Pathologic response was categorized into incomplete pathological response (i.e., no major pathologic response; >10% VTCs), major pathological response (MPR, ≤10% VTCs), and pathologic complete response (pCR, no remaining VTCs)27,28. For cases with MPR or pCR after neoadjuvant chemotherapy or chemoimmunotherapy, the tumor bed was histopathologically identified and subsequently interrogated by targeted immune gene profiling.
Table 1.
Clinicopathological characteristics of the three cohorts: Treatment-naïve (n=190) and neoadjuvant chemotherapy cohort (n=38) from MD Anderson, and the neoadjuvant chemoimmunotherapy cohort from NADIM trial (n=21) (NCT03081689).
| Clinicopathological variables | Treatment-naïve (MD Anderson) (n=190) | % | Neoadjuvant Chemotherapy (MD Anderson) (n=38) | % | Neoadjuvant Chemoimmunotherapy (NADIM trial) (n=21) | % |
|---|---|---|---|---|---|---|
|
| ||||||
| Age median (range) | 67 (41 – 86) | 62 (43 – 81) | 64 (41 – 76) | |||
| Sex | ||||||
| Female | 80 | 42.1 | 17 | 44.7 | 5 | 23.8 |
| Male | 110 | 57.9 | 21 | 55.3 | 16 | 76.2 |
| Smoking Status | ||||||
| Current | 83 | 43.7 | 23 | 60.5 | 8 | 38.1 |
| Former | 92 | 48.4 | 15 | 39.5 | 13 | 61.9 |
| Never | 15 | 7.9 | 0 | 0.0 | 0 | 0.0 |
| Histology | ||||||
| LUAD | 107 | 56.3 | 20 | 52.6 | 11 | 52.4 |
| LUSC | 83 | 43.7 | 18 | 47.4 | 10 | 47.6 |
| TNM stage | ||||||
| I | 73 | 38.4 | 1 | 2.6 | 0 | 0.0 |
| II | 49 | 25.8 | 7 | 18.4 | 0 | 0.0 |
| III | 68 | 35.8 | 30 | 79.0 | 21 | 100.0 |
| PD-L1 (IHC) | ||||||
| <1% | 80 | 42.1 | 4 | 10.5 | 8 | 38.1 |
| ≥1% | 38 | 20 | 7 | 18.4 | 9 | 42.9 |
| NA | 72 | 37.9 | 27 | 71.1 | 4 | 19.0 |
| Recurrence | ||||||
| Yes | 91 | 47.9 | 21 | 55.3 | 5 | 23.8 |
| No | 99 | 52.1 | 17 | 44.7 | 16 | 76.2 |
| Survival | ||||||
| Alive | 56 | 29.5 | 8 | 21.1 | 19 | 90.5 |
| Death | 134 | 70.5 | 30 | 78.9 | 2 | 9.5 |
LUAD, lung adenocarcinoma; LUSC, lung squamous cell carcinoma; IHC, immunohistochemistry; NA, not available.
Immunohistochemistry analysis.
Immunohistochemistry (IHC) and digital image analysis were previously performed29 for a subset of NSCLCs (n=177). This included analysis of densities of tumor-associated immune cells (TAICs): CD4+ (helper T), CD8+ (cytotoxic T), CD45RO+ (memory T) and FOXP3+ (regulatory T) (Supplementary Table 1). Briefly, tissue sections (4μm) were stained using a Leica Bond Max automated stainer (Leica Biosystems Nussloch GmbH). Sections were then deparaffinized and rehydrated according to the manufacturer’s protocol. Antigen retrieval was performed for 20 minutes with Bond Solution #2 (Leica Biosystems, equivalent EDTA, pH 9.0) or Bond Solution # 1 (Leica Biosystems, equivalent Citrate Buffer, pH6). Primary antibodies were incubated for 15 minutes at room temperature and detected using the Bond Polymer Refine Detection kit (Leica Biosystems) with DAB as chromogen. Tissue slides were counterstained with hematoxylin, dehydrated, and coverslipped.
Membrane PD-L1 was evaluated by a pathologist (LS) as percentage of tumor cells with positive expression based on the International Association for the Study of Lung Cancer (IASLC) guidelines30. Pathological evaluation was done for each sample to confirm the presence of tumor and adjacent normal un-involved tissue. For those cases in which the presence of both compartments was confirmed, the invasive margin was delineated (red line in Figure 2A). Subsequently, and using immunohistochemistry analysis, CD8+ T cell densities were separately evaluated within (tumoral) and surrounding (peritumoral or adjacent normal tissue) tumors in whole sections using digital image analysis as previously described by our group29. Based on this compartment classification (tumoral vs peritumoral) we categorized tumors into three tumor immune microenvironments (TIME) patterns similar to what was performed by previous studies in NSCLC 31: 1) inflamed, ≥ 1000 CD8+ T cells/mm2 within the tumor compartment and a peritumoral CD8+ / tumoral CD8+ ratio < 2.75, denoting homogeneous infiltration across both compartments; 2) cold, < 1000 CD8+ T cells/mm2 within the tumor compartment and ratio < 2.75, denoting lack of infiltration across both compartments; and 3) excluded, with a peritumoral CD8+ / tumoral CD8+ ratio > 2.75, lacking CD8+ T cells in the tumor area and exhibiting CD8+ T cell infiltrates that reside at the periphery of the tumor. Tumors were also categorized into four groups based on their PD-L1 immunohistochemical expression (<1% and ≥1%) and TILs (tumor infiltrating lymphocytes) infiltration status using CD3+ T cell densities (<median = TILs− and ≥median = TILs+): 1) PD-L1−/TILs−; 2) PD-L1−/TILs+; 3) PD-L1+/TILs−; and 4) PD-L1 +/TILs+.
Multiplex immunofluorescence analysis.
Multiplex immunofluorescence (mIF) was available for a subset of patients in the neoadjuvant chemoimmunotherapy cohort (n=27) and were previously reported17. Briefly, mIF staining was performed in four micron histological tumor sections using the Opal 7-Color fIHC Kit (PerkinElmer, Waltham, MA). Slides were scanned by a Vectra multispectral microscope (PerkinElmer). The immunofluorescence (IF) markers CD3, CD8, FOXP3, and pancytokeratin AE1/AE3 were then analyzed and reported as number of cells per mm square (cells/mm2).
Targeted RNA sequencing of immune genes.
The HTG EdgeSeq Precision Immuno-Oncology panel (HTG Molecular, Tucson, AZ) was employed to examine immune-centric expression programs in samples from all three cohorts. This panel comprised 1,392 genes with a focus on tumor-immune interaction. We then used the available HTG EdgeSeq Reveal software (HTG Molecular) to in silico deconvolute the immune gene expression data into gene signatures that characterize distinct cell populations and phenotypes (Supplementary Table 2)32. Furthermore, gene programs that predict immune cell infiltration and functional states were compiled (Supplementary Table 3) and interrogated in the three cohorts. For validation, we studied publicly available bulk and transcriptome sequencing data of 481 stage I to III LUADs from the cancer genome atlas (TCGA) cohort. LUADs samples were ranked by their expression of CD274, with upper quartile of tumors constituting those with relatively high expression (PD-L1 positive).
Statistical analysis.
Targeted immune gene expression data were first median-normalized and then log2 transformed for further analysis. Scores of previously curated immune gene signatures were calculated by computing average expression of genes within each signature. To test association between continuous and categorical variables, Mann Whitney U test and Kruskal-Wallis were applied for categorical variables with two levels or more than two levels, respectively. To test association between two continuous variables, the Spearman’s rank correlation test was applied. For survival analysis, we used Cox proportional-hazards model. Benjamini & Hochberg’s method was used for multiple testing correction of p-values.
Data availability statement.
Raw data were generated in the HTG Molecular Diagnostics core facility (Tuscon, AZ). Processed data are available from the authors and derived data supporting the findings of this study are available from the corresponding author upon request.
RESULTS
Immune expression programs are associated with PD-L1 positivity in treatment-naïve NSCLC.
We performed targeted immune gene sequencing using the HTG EdgeSeq Precision Immuno-Oncology platform32 of 190 treatment-naïve early-stage NSCLCs (Table 1) and compared immune expression programs and phenotypes between PD-L1 positive and negative tumors. We first compared protein immunohistochemical expression levels of CD4+, CD8+, FOXP3+, CD45RO+, and CD68+ cell densities with corresponding immune cell scores derived by targeted gene sequencing (n=177 patients). We found significant correlation between all four immune cell densities with the corresponding gene scores (r=0.58, r=0.67, r=0.35, r=0.32, r=0.22 respectively, p<0.0001 for all) and the same pattern (Supplementary Figure 1A). PD-L1 protein expression in tumor cells by IHC significantly and highly correlated with CD274 expression (r=0.55, p<0.0001) (Supplementary Figure 1B). Additionally, CD8 T and CD8 memory effector T cell immune gene programs were significantly and highly positively correlated with previous published gene signatures denoting cytotoxic T lymphocytes (CTLs)33 (p<0.0001; r=0.7761) and cytotoxicity34 p<0.0001; r=0.8037) (Supplementary Figure 2). These data point to the robustness of the targeted immune sequencing approach to quantify immune subsets in the TIME of early-stage NSCLC.
Relative to PD-L1 negative (<1% tumoral PD-L1) lung adenocarcinomas (LUADs), PD-L1 positive (≥1%) LUADs displayed elevated expression of genes associated with antigen presentation such (e.g., HLA-DRA and CD86) (Figure 1A), various immune programs such as interferon gamma signaling35, and immune cytolytic activity36 as well as immune subsets such as cytotoxic T lymphocytes (CTLs)33, T effector cells37,38. Additionally, PD-L1 positive tumors showed increased signature scores for immunoregulatory mediators such as neutrophils39 (Figure 1B). These findings were validated when we studied localized LUADs from the TCGA cohort. PD-L1 high LUADs from the TCGA cohort similarly exhibited relatively higher expression of genes implicated in antigen presentation process and several immune programs implicated in host anti-tumor responses (e.g., interferon gamma, immune cytolytic activity, M1 macrophages, T effector cells) (Supplementary Figure 3A–B). PD-L1 positive LUADs also showed elevated immune cell scores for B (p=0.0005), CD4 T (p=0.0029) cells, regulatory T, and effector memory CD8 T cells (all p<0.05) (Figure 1C). Of note, we observed heterogeneous expression of these immune gene programs in PD-L1 negative LUADs, with a subset of tumors exhibiting elevated inflammation-associated signatures. In close alignment with previous studies26,40, LUADs harboring EGFR or STK11 mutations more frequently exhibited negative tumoral PD-L1 expression concomitant with reduced expression of various immune cell scores (Supplementary Figure 4A). Among lung squamous cell carcinomas (LUSCs), PD-L1 positive tumors only showed increased abundance of macrophages and M1 macrophages signatures and decreased scores for plasma cells relative to those that were negative for PD-L1, perhaps suggesting distinct immune biology programs associated with PD-L1 between both subtypes of NSCLC (Supplementary Figures 4B–D). Of note, tumoral PD-L1 in both LUADs and LUSCs was not significantly associated with recurrence (Supplementary Figure 5A). Notable, non-recurrent LUADs, compared with their recurrent counterparts, exhibited increased abundance of specific immune subsets such as B and plasma cells as well as M1 macrophages (all p<0.05) (Supplementary Figure 5B). Our findings suggest immune genes and programs that further inform of the immunopathology of early-stage NSCLC.
Figure 1. Immune expression programs differentially expressed in PD-L1 positive and negative treatment-naïve LUADs.

A) Heat map showing DEGs between PD-L1 positive (≥1%) and PD-L1 negative (<1%) treatment-naïve LUADs. DEGS were selected based on a statistical threshold of adjusted p<0.05. Columns denote samples which were annotated with clinicopathological and molecular features, and rows represent DEGs (red, relatively higher expression; blue, relatively lower expression). B) Differential expression of functional gene signatures (red, higher expression; blue, relatively lower expression; adjusted p<0.05) between PD-L1 positive and negative LUADs. C) Violin plots for cellular signatures scores in PD-L1 positive (≥1%, orange) and PD-L1 negative (<1%, blue) tumors. P-values were calculated based on the Mann Whitney test, black lines represent the median, and gray lines correspond to 95% confidence interval (CI). LUADs, lung adenocarcinomas; DEGs, differently expressed genes.
Gene expression programs associated with immunologically inflamed, cold, and excluded TIME phenotypes.
We next categorized treatment-naïve NSCLCs into distinct TIME phenotypes (inflamed, cold, and excluded) based on cell density and spatial distribution of CD8+ T cells by IHC (Figure 2A). The fraction of LUADs harboring an excluded phenotype increased with pathologic stage (p=0.0273) (Figure 2B). In accordance with our previous findings above, PD-L1 positive LUADs displayed increased frequency of the inflamed TIME phenotype (66.7%) compared with PD-L1 negative tumors (38.1%) (p=0.0207) (Figure 2B). In addition, LUADs with relatively higher TMB displayed more frequently an inflamed phenotype (58.6%) (p<0.0001) (Figure 2B). Notably, 9 out of 13 EGFR mutant LUADs were classified as a cold tumor (Supplementary Figure 6A) in close agreement with previous studies26,40. We found a trend for reduced survival in the excluded group albeit not reaching statistical significance (Supplementary Figure 6B).
Figure 2. Gene expression programs associated with immunologically inflamed, cold, and excluded TIME phenotypes in treatment-naïve LUADs.

A) Scatter plot showing distribution of LUADs based on tumoral cell densities of CD8+ T cells (y-axis) and peritumoral/tumoral ratios for CD8+ T cells (x-axis). LUADs were classified into inflamed (red rectangle), cold (blue rectangle), and excluded (yellow rectangle) phenotypes (top), along with representative images for the three different phenotype patterns at the bottom (P, peritumoral; T, tumor area). LUADs were also color coded by PD-L1 expression (orange, (≥1%; blue, <1%). B) Frequencies of TIME phenotypes in LUAD by pathological stage, tumoral PD-L1 expression, as well as somatic mutational burden (TMB; TMB high, ≥ median (171); TMB low, < median). P-values were calculated based on the Fisher’s exact test. C) Violin plots depicting cellular signature scores across the three TIME phenotypes. P-values were calculated based on the Kruskal-Wallis test, black lines represent median levels, and gray lines correspond to 95% confidence interval (CI). D) Heat map showing 94 DEGs (adjusted p<0.05) between the three TIME phenotypes. Rows represent single genes and columns denote samples (red, relatively higher expression; blue, relatively lower expression).
We next performed in silico deconvolution to identify differences in the abundance of immune cell types across the three TIME phenotypes. Inflamed LUADs exhibited significantly higher signature scores for CD8 T cells (p<0.0001) including effector memory T cells (p<0.0001) (Figure 2C), consistent with the CD8+ IHC analysis. Inflamed LUADs also showed increased abundance of B cell populations (naïve B cells and B cells, both p<0.0001). Additionally, macrophage and M1 macrophage subsets were significantly lower in cold LUADs (p=0.0008, and p=0.0003, respectively). Similarly, we found by IHC analysis significantly decreased CD68+ cell densities in the cold group (p<0.0001; Supplementary Figure 7). Of note, signature scores for M2 macrophages were significantly increased in LUADs with an excluded phenotype (p=0.0219) (Figure 2C). We identified 94 differentially expressed genes (DEG) among treatment-naïve LUADs across the three phenotypes. Inflamed LUADs showed increased expression of genes that were consistent with elevated immune cell infiltration (e.g., CD3E, CD3G CD8A, CD8B), cytolytic activity (GZMA, GZMB, GZMK, NKG7), immune cell chemotaxis (CXCL9, CXCL10, CXCL13), and antigen presentation (TAP1, TAP2). In sharp contrast, LUADs with a cold phenotype exhibited the lowest levels for these immune profiles, concomitant with increased expression of tumor promoting factors (MTOR, FGFR3, IL6R). Excluded LUADs displayed immune profiles that were in an intermediate state between inflamed and cold phenotypes (Figure 2D).
We also performed similar analysis of tumors that we categorized into four groups based on PD-L1 expression and TILs (CD3+ T cell) infiltration (Supplementary Figure 8A). We found increased frequencies of PD-L1+/TILs+ tumors in cases with an inflamed or excluded TIME phenotype and in those with higher tumor mutation burden (Supplementary Figure 8B). Conversely, fractions of PD-L1+/TILs+ tumors were markedly reduced and of PD-L1−/TILs− greatly increased in the cold TIME group (Supplementary Figure 8B). We found that PD-L1+/TILs+ tumors when compared to their PD-L1−/TILs− counterparts overall exhibited increased signature scores for various immune populations, programs, and genes – echoing our findings when comparing inflamed and cold tumors (Supplementary Figure 8C–D). Also, among PD-L1 negative tumors, those that were TILs+ displayed higher CD4 T cell signatures including memory, effector memory and regulatory cell subsets compared with their TILs− counterparts (Supplementary Figure 8C). We also interrogated expression levels of various immune checkpoints (PDCD1, CD274, CTLA4, HAVCR2, ICOSLG, TIGIT and LAG3) across the TIME phenotypes and PD-L1/TILs groups. We found increased expression of CTLA4, TIGIT and LAG3 in the inflamed group, and elevated levels of HAVCR2 and ICOSLG in the excluded phenotype (Supplementary Figure 9A). We did not find significant differences in the expression of these immune checkpoints among the four subgroups based on PD-L1 expression and TILs, while significant differences were observed based on PD-L1 status (<1% vs ≥1%) with positive tumors exhibiting increase expression of CD274, CTLA4, HAVCR2 and TIGIT (p<0.05 for all) (Supplementary Figure 9B–C).
Immune expression changes linked with pathological response after neoadjuvant chemotherapy in early-stage NSCLC.
We next sought to interrogate immune programs in early-stage NSCLCs treated with neoadjuvant chemotherapy. We studied immune genes that were associated with pathologic response. Among LUADs, we found that immune genes implicated in innate immune responses (CD14, TLR4, MAF) and those pertinent to B cell biology (CD79A, JCHAIN, CXCL12, BLNK) were significantly and positively associated with pathologic response (lower % VTCs) (p<0.01). In contrast, LUADs with relatively lower or no response to neoadjuvant chemotherapy displayed upregulation of genes implicated in DNA replication, cell cycle, and inhibition of apoptosis (e.g., MCM6, FOXM1, FOXA1) consistent with increased %VTCs (Figure 3A). In accordance, percentage of VTCs was significantly correlated with the identified DEGs (r=0.84, p<0.001) and with an epithelial cell gene signature (r=0.62, p=0.0065) (Figure 3B). Also, LUADs with a relatively higher signature score for cytotoxic T lymphocytes33 displayed significantly improved overall survival (OS; p=0.0055) (Figure 3C). Of note, recurrent LUADs showed significantly upregulated expression of the adenosine pathway (p=0.0085) (Figure 3D), an immune program previously shown by our group and others to be associated with tumor immune evasion and lack of response to ICI34,41. Recurrent LUADs in this cohort also showed a tendency for increased abundance of macrophages (p=0.0811), M2 macrophages (p=0.0557), and CD4 memory T cells (p=0.0557) (Supplementary Figure 10). In LUSCs, %VTCs was positively correlated with a NK cell exhaustion signature34 (r=0.61, p=0.022), and inversely correlated with abundance of M2 macrophages (r=−0.61, p=0.0187) (Supplementary Figure 11A–B).
Figure 3. Immune expression changes linked with pathological response after neoadjuvant chemotherapy in early-stage NSCLC.

A) Heat map showing 29 DEGs (un-adjusted p<0.01) that are associated with the percent of viable tumor cells in early-stage NSCLCs treated with neoadjuvant chemotherapy. Columns denote NSCLCs that are annotated with clinicopathological and molecular features and rows represent DEGs (red, relatively higher expression; blue, relatively lower expression). B) Scatter plot showing statistically positive correlation of the identified DEGs (left) and an epithelial cell signature (right) with percent viable tumor cells. Correlation was statistically assessed using Spearman correlation. C) Analysis of the association of signature score for cytotoxic T lymphocytes with overall survival (OS) using Kaplan-Meier method for estimation of survival probability and of a D) Adenosine signature with recurrence (p-value was calculated based on the Mann Whitney test, black lines represent the median, and gray lines correspond to 95% confidence interval (CI).
Chemoimmunotherapy elicits pronounced immune-wide expression changes in resectable NSCLC.
Comparison of NSCLC patients achieving pCR/MPR with incomplete response to neoadjuvant chemoimmunotherapy revealed that the former group overall displayed higher immune scores (i.e., abundance) for various cell subsets such as B cells (p=0.0110) and CD8 T cells (p=0.0293) (Figure 4A) indicative of elevated immune infiltration associated with response. On the other hand, NSCLCs that did not respond to neoadjuvant chemoimmunotherapy exhibited elevated fractions of T-helper type 1 cells as well as of epithelial cells (p=0.0011) (Figure 4A) consistent with increased percentage of VTCs. Of note, we also performed orthogonal confirmation of CD8 T and regulatory T cell signatures using multiplex immunofluorescence (mIF). CD3+CD8+ and CD3+FOXP3+CD8− cell densities by mIF closely and positively correlated with RNA-seq-derived CD8 T and regulatory T cell signatures, respectively (Supplementary Figure 12A–B). CD3+CD8+ cell densities by mIF and the CD8 T cell signature were both concordantly and significantly increased between chemoimmunotherapy -treated patients with MPR/pCR and those with no MPR (Supplementary Figure 12A, right) whereas there were no statistically significant changes in both CD3+FOXP3+CD8− cell densities and the regulatory T cell signature between both patient groups (Supplementary Figure 12B, right).
Figure 4. Chemoimmunotherapy elicits pronounced immune-wide expression changes in resectable NSCLC.

A) Violin plots for cellular signatures scores in patients with (% of viable tumor cells ≤10%, orange) and without pCR / MPR (>10% of viable tumor cells, blue). P-values were calculated based on the Mann Whitney test; black lines represent median values, and gray lines correspond to 95% confidence interval (CI). B) Heat map showing 223 DEGs (adjusted p<0.05) that are associated with percent viable tumor cells in early-stage NSCLCs treated with neoadjuvant chemoimmunotherapy. C) Radar plot highlighting differences between pre- (red) and post-treatment samples (blue) for the cellular signature scores. D) Heat map showing 128 DEGs between pre- and post-treatment samples (adjusted p<0.05). Columns denote samples and rows represent single genes and (red, relatively higher expression; blue, relatively lower expression). P-values were calculated using Wilcoxon matched-pairs signed rank test. pCR: pathologic complete response, MPR: major pathologic response.
Next, we interrogated immune genes that were associated with pathologic response, identifying 223 genes significantly associated with % VTCs (adjusted p<0.05). Patients with less % VTCs after neoadjuvant chemoimmunotherapy exhibited higher expression of genes involved in immune activation and chemotaxis (ILR1L, CCL14, IL33, IL7R, IRF8, CXCR4), T and NK (TARP, CD226, CD69, KLRD1), and myeloid cells (CLEC9A, MARCO). Conversely, tumors with relatively higher %VTCs following neoadjuvant chemoimmunotherapy displayed upregulation of genes implicated in the DNA replication and cell cycle (e.g., BRCA1, CDK4, TOP2A, AURKA) as well as the major immunosuppressive transcriptional factor FOXP3 (Figure 4B).
We next interrogated evolution of immune responses in a subset of these patients (n=13) with available paired pre- and post-therapy samples. Differential expression analysis revealed 128 DEGs that were significantly modulated between paired post- and pre-treatment samples. Chemoimmunotherapy increased expression of genes that are implicated in inflammation and chemotaxis of immune cells (IL1R1, CXCR4, CCL14, CXCL12), regulatory T cells (p=0.0479) and M2 macrophages (p=0.0398) (Figures 4C–4D, Supplementary Figure 13). Chemoimmunotherapy also reduced overall abundance of T helper type 1 (p<0.0001) and epithelial cells (p<0.0001) cells (Figures 4D).
We next compared immune gene programs across NSCLCs that are treatment-naïve, treated with neoadjuvant chemotherapy, and those treated with neoadjuvant chemoimmunotherapy. Due to the design of our study, and the currently approved treatment approaches42, stage I NSCLCs were more frequently found in the treatment-naïve cohort (38%) compared with neoadjuvant chemotherapy (2.6%) and the chemoimmunotherapy (0%) cohorts. We thus excluded stage I NSCLCs from this comparative analysis. We observed that 532 genes were differentially expressed between the three groups (Figure 5A). NSCLC patients treated with chemoimmunotherapy exhibited upregulated expression of profiles indicative of elevated T and B cell (e.g., CD3G, CD8A, MS4A1, CD19, CD22) and myeloid (CD68, CD163, CXCR2, ALOX15B) cell infiltration (Figure 5A) and, conversely, attenuated levels of genes involved in cell cycle (PKM, CDK4) and DNA repair (BRCA1, PCNA) (Figure 5A). Additionally, most immune cell gene signatures were found to be elevated in the chemoimmunotherapy cohort (Figure 5B). Chemoimmunotherapy-treated NSCLC patients displayed a markedly and significantly upregulated abundance of B and plasma cells (both p<0.05) as well as CD4 (p=0.0031) and cytotoxic CD8 (p<0.0001) T cells. Notably, and for many of these cell subsets, we found gradual changes across the three patient groups, i.e., chemoimmunotherapy-treated NSCLCs exhibiting the highest fractions of these immune populations and the treatment-naïve group showing the lowest levels (Figure 5B). Our findings underscore immune gene programs that may underlie effects of and response to neoadjuvant chemoimmunotherapy.
Figure 5. Immune gene programs that are differentially modulated between treatment-naïve NSCLCs and those treated with neoadjuvant chemotherapy and chemoimmunotherapy.
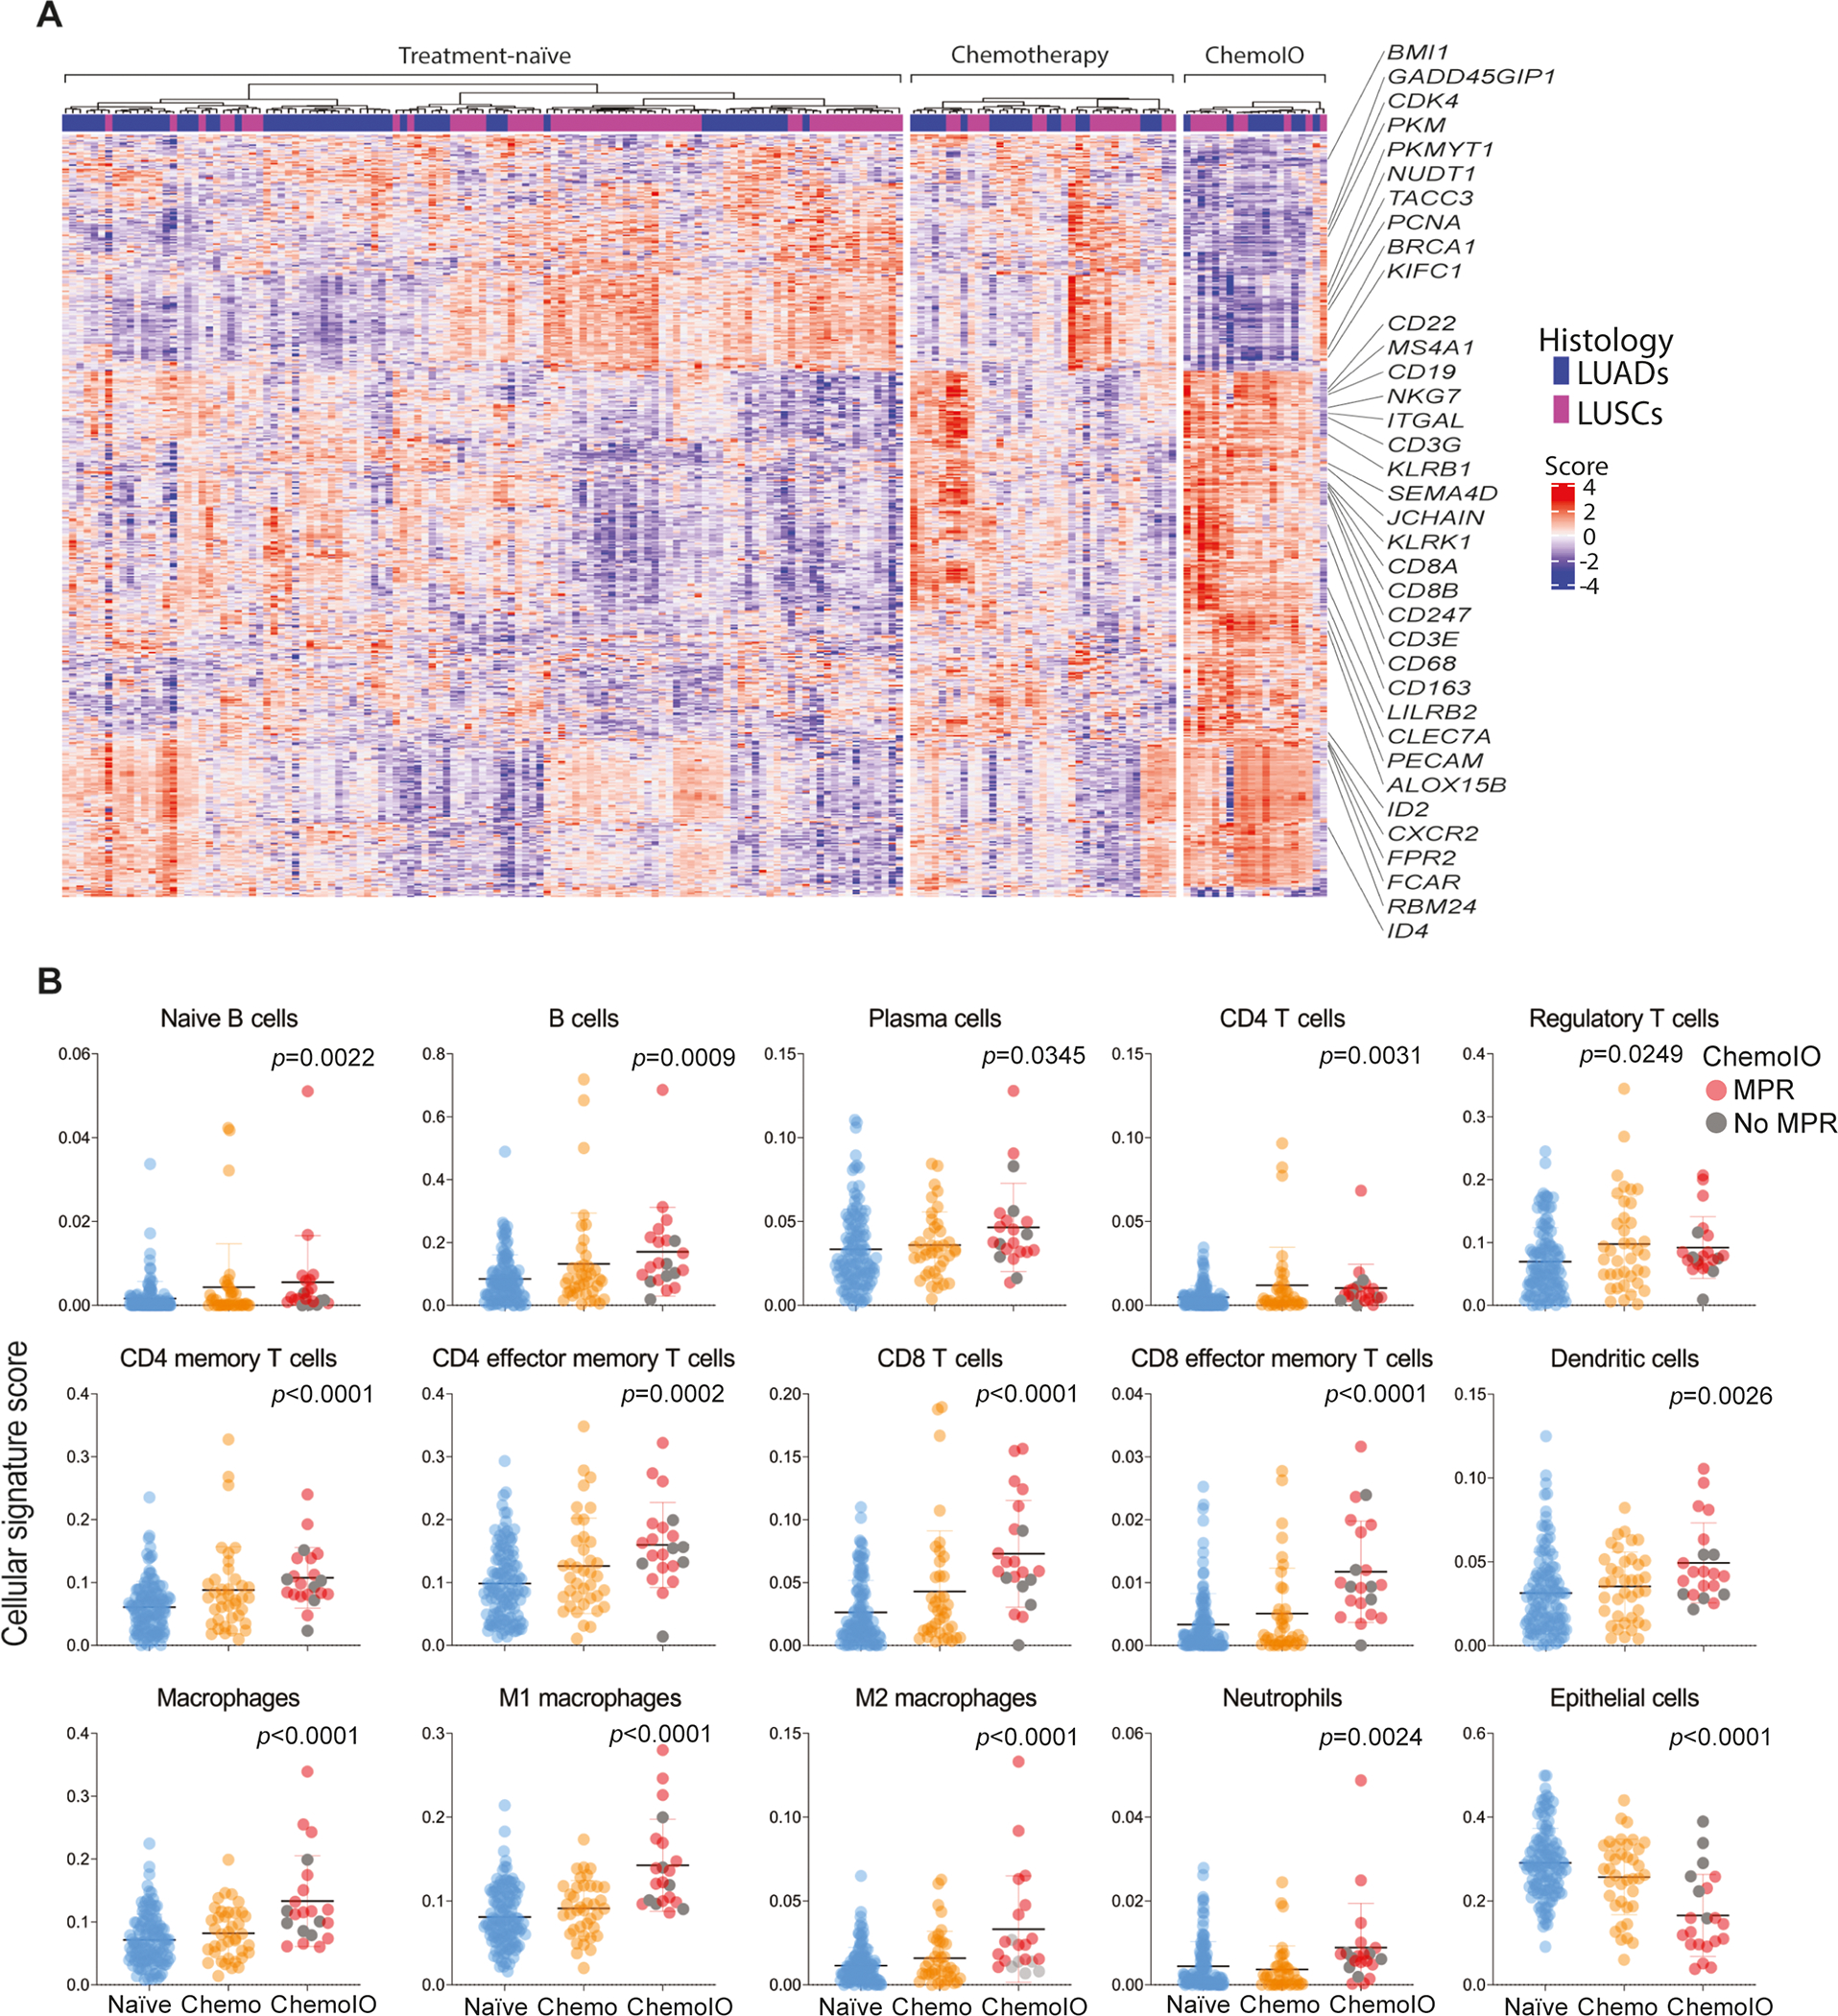
A) Heat map showing 532 DEGs between treatment-naïve, treated with neoadjuvant chemotherapy (Chemotherapy), and those treated with chemoimmunotherapy (ChemoIO) NSCLCs (adjusted p<0.05). Columns denote samples and rows represent single genes (red, relatively higher expression; blue, relatively lower expression). B) Dot plots for cellular signature scores across the three cohort (blue, treatment-naïve; orange, neoadjuvant chemotherapy; red, neoadjuvant chemoimmunotherapy. P-values were calculated based on Kruskal-Wallis test, bars correspond to median values +/− 95% CI).
DISCUSSION
Immune phenotypes underlying the pathobiology of NSCLC including its response to neoadjuvant therapy remain poorly understood. Here, we performed targeted RNA-seq of an immune gene panel to interrogate immune programs in three cohorts of resectable NSCLC that underwent up-front surgery (treatment-naïve), neoadjuvant chemotherapy or chemoimmunotherapy. We found that the majority of treatment-naïve NSCLCs that expressed PD-L1 displayed elevated immune cell scores. We further defined three TIME phenotypes (inflamed, cold, and excluded) in NSCLCs based on the presence and spatial distribution of CD8+ cells and that showed distinct immune and inflammatory features. We then described immune gene sets that were associated with response to neoadjuvant chemotherapy or chemoimmunotherapy. Lastly, comparative analysis of immune programs across the three cohorts showed progressive increases in various immune cell scores along the spectrum of treatment-naïve, to neoadjuvant chemotherapy treated tumors, up to those treated with neoadjuvant chemoimmunotherapy. Our study points to immune programs and phenotypes that may underlie tumor immunity and responses to neoadjuvant therapies, including chemotherapy and immune-based treatment, in resectable NSCLC.
Several clinical trials have demonstrated that tumoral and immune cell PD-L1 expression is associated with increased likelihood of response to antibodies against PD-1 or PD-L1 in metastatic NSCLC14,43–45. In our analysis of early-stage NSCLCs, and consistent with previous reports46–48, we found that PD-L1 positive LUADs displayed overall augmented immune gene scores and programs as compared with PD-L1 negative LUADs. Interestingly, we found that a subset of PD-L1 negative LUADs displayed relatively high levels of immune cell scores. It is noteworthy that previous studies have demonstrated favorable responses to anti-PD-1/PD-L1 therapy in localized NSCLCs that were negative for tumoral PD-L117–20,23. Our findings set the stage for a reasonable supposition that early-stage NSCLC patients with negative tumoral PD-L1 may comprise additional immune-centric signatures that may play a role in shaping tumor responsiveness to ICI. These immune programs can be further explored to improve our understanding of how the TIME may impact responses to anti-PD-1/PD-L1-based therapies in the early-stage disease setting. It is worthwhile to mention that when we stratified each of LUADs and LUSCs based on PD-L1 expression status, we found overall higher immune cell scores and signatures in the former lung tumor type and less so in LUSCs. Additionally, we found distinctively modulated immune signatures (e.g., plasma cells and macrophage subsets) between PD-L1 positive LUSCs relative to their negative counterparts and which were not prevalent in the LUAD analysis. Our findings point to immune programs that denote disparate immunopathology between LUADs and LUSCs. Interestingly, recent studies have shown that PD-L1 negative LUSCs exhibited more favorable responses to combined anti-PD-1 and -CTLA-4 treatment relative to PD-L1 negative LUADs49,50, emphasizing different immune biology between both major subtypes of NSCLC.
Earlier work has shown that the extent and spatial pattern (intratumoral or peritumoral) of lymphocyte infiltration impinge on host immunity and response to ICIs51,52. Here, we defined three different TIME phenotypes based on CD8+ T cells: inflamed, excluded, and cold TIME. We found that inflamed tumors, in contrast to tumors exhibiting a cold TIME phenotype, showed upregulation for CD8 memory/effector and CD4 memory T cells as well as B cells and reduced levels scores for M2 macrophages, all features known to promote anti-tumor immune responses53. We also found that early-stage LUADs with an inflamed phenotype exhibited elevated levels of CXCL9 and CXCL13 along with increased expression of genes involved in antigen presentation (e.g., TAP1 and TAP2). Our findings are in close agreement with a recently reported meta-analysis which described elevated expression of CXCL9 and CXLC13 as stronger predictors of response of advanced/metastatic cancers to ICI54. Interestingly, LUADs with an excluded TIME phenotype displayed an overall intermediate ‘immune-state’, in line with the study by AbdulJabbar et al55, and with notably higher signature scores for M2 macrophages relative to both inflamed and cold LUADs. These data are in agreement with earlier work demonstrating immune cell exclusion by pro-tumor macrophage subsets including tumor-associated and tissue-resident macrophages56,57. On that theme, a recent report that employed transcriptomic analysis for multi-cancer TIME classification found that tumors with lowest ratios of M1/M2 macrophage signatures exhibited poor prognosis58. Also, another study by Herbst et al similarly stratified tumors treated with anti-PD-L1 therapy into distinct TIME phenotypes and found that metastatic tumors exhibiting a cold or an excluded TIME phenotype did not respond, suggesting that pre-existing immunity may be important for response31. Conversely, other studies exploring the combination of CTLA-4 plus PD-1 blockade have shown responses independent of baseline CD8 T cells59. Nonetheless, our study highlights heterogeneity of immune phenotypes and antitumor immunity in early-stage NSCLC.
Recent studies have shown encouraging results when interrogating the use of ICI, alone or in combination with chemotherapy, as a neoadjuvant therapeutic approach for resectable NSCLC, with MPR rates ranging from 20 to 86%17–23,60. Yet, like the metastatic setting, there are very limited, if any, available biomarkers to predict response to neoadjuvant ICI18,43. Analysis of surgically resected NSCLCs treated with neoadjuvant ICI or chemoimmunotherapy underscored immune markers or targets that were associated with MPR17–19. Despite these insights, a comprehensive view of immune programs that are associated with NSCLCs response to neoadjuvant ICI or chemoimmunotherapy is still lacking. Our gene profiling analysis demonstrated immune cell scores and programs that were associated with MPR to neoadjuvant chemoimmunotherapy. Our findings are in line with recent studies showing positive association between CD8 T cells, including memory T and antigen-experienced subsets, with ICI response18,19,22,60,61. Also, our longitudinal profiling analysis of paired pre- and post-treatment samples showed increased scores for M2 macrophages post-chemoimmunotherapy. While these findings may first appear counterintuitive, they are in accordance with recent independent studies by Forde et al and Cascone et al showing increased fractions of macrophages expressing PD-L1 (CD68+PD-L1+) following ICI18,19. It is intriguing to speculate whether co-targeting protumor myeloid programs may enhance response to neoadjuvant immunotherapy. Of note, a recent phase III clinical trial (CheckMate 816) showed strikingly increased MPR following neoadjuvant chemoimmunotherapy (36.8%) versus chemotherapy alone (8.6%)24. Here, our gene profiling analysis showed that NSCLCs that were treated with neoadjuvant chemoimmunotherapy displayed relatively highest signature scores for various immune cells such as CD8 and CD4 T cells as well as B cell subsets. Our work offers a comprehensive overview of immune gene programs that may underlie response to and effects of chemoimmunotherapy in resectable NSCLC.
Our work is not without limitations. Our analysis centered on interrogating immune programs in retrospective cohorts of patients with resectable NSCLC. It is not clear how our data will compare to immune profiles in NSCLCs in the metastatic setting. Also, our findings when comparing the three cohorts should be interpreted with caution due to the small number of patients in the treated groups, differences in pathologic stage, PD-L1 expression, and disease course among the three cohorts, along with the multicenter nature of the chemoimmunotherapy cohort. Thus, our findings warrant validation in future studies that include larger cohorts. Nonetheless, given the ongoing efforts exploring ICI in early-stage NSCLC our work provides new insights on immune programs that are disparate among early-stage NSCLCs and in the context of neoadjuvant therapy. It is noteworthy that we described TIME phenotypes based on CD8+ T cell densities and it cannot be neglected that markers for other immune cells could impact these phenotypes. Nevertheless, we found that TIME phenotypes based on extent and pattern infiltration of CD8+ cells still showed robust differences in their frequencies by pathological stage, PD-L1 expression, and tumor mutation burden. Also, our study focused on immune gene profiling of different cohorts of resectable NSCLC. A paucity of adequate tissues from patients treated with chemotherapy and chemoimmunotherapy impeded a more comprehensive examination of TIME phenotypes, for instance by high-plex spatial analysis of immune cells. Future studies are warranted to perform spatial immune profiling of neoadjuvant treated NSCLCs. Still, our targeted sequencing analysis identified immune programs that were tightly correlated with their corresponding immune cell densities (measured by protein analysis) and distinctively modulated based on various immune phenotypes (e.g., PD-L1 expression).
In conclusion, using targeted gene sequencing analysis, we characterized immune programs across patients that underwent up-front surgery, neoadjuvant chemotherapy, or neoadjuvant chemoimmunotherapy. We identified immune gene programs that are unique to PD-L1 positive and negative NSCLCs as well as those that are shared between both groups. Spatial distribution of CD8+ T-cells unveiled distinctive TIME phenotypes whose frequencies differed based on major clinicopathological and genomic features. Longitudinal analysis of patients following neoadjuvant chemoimmunotherapy showed strong upregulation of immune cells signatures within the TIME. Comparative analysis underscored immune programs and signatures that overall were progressively modulated along the spectrum of treatment-naïve, neoadjuvant chemotherapy-treated, up to those treated with chemoimmunotherapy -- pointing to an association between perturbation of an expanded repertoire of immune gene sets with neoadjuvant chemoimmunotherapy. All in all, our study showcases immune gene signatures, programs, and phenotypes that inform of the immunopathology of localized NSCLC as well as its response to early immunotherapy.
Supplementary Material
STATEMENT OF TRANSLATIONAL RELEVANCE.
Neoadjuvant treatment with immune checkpoint inhibitors alone or in combination with chemotherapy have recently shown promising results in NSCLC. Yet, mechanisms that promote response to these strategies remain inadequately understood. Here we report immune programs that inform of host anti-tumor immunity and response in resectable NSCLC. In treatment naïve tumors we found that tumor immune microenvironment phenotypes (inflamed, cold and excluded) based on the cell densities and spatial distribution of CD8+ T cells exhibited disparate frequencies by stage, PD-L1 expression, and mutational burden. Cytotoxic T cell signature was associated with favorable survival in neoadjuvant chemotherapy-treated NSCLCs. Patients achieving major pathological response after chemoimmunotherapy exhibit higher CD8+ T cells, while Th1 cells were significantly reduced post-chemoimmunotherapy. Among the three cohorts, chemoimmunotherapy-treated NSCLCs significantly exhibited highest scores for various immune cell subsets including T effector and B cells. Our findings highlight immune gene programs that may underlie host tumor immunity and response to immunotherapy in resectable NSCLC.
Funding:
This work was partially supported by The University of Texas Lung Specialized Programs of Research Excellence (SPORE) grant from the National Cancer Institute (NCI) P50CA70907, the NCI Cancer Center Support Grant P30CA016672 (supporting the Institutional Tissue Bank), NCI Cooperative Agreement U24CA224285 (to the MDACC CIMAC), and the Cancer Prevention and Research Institute of Texas grant RP160668. P.R. was supported by SEOM (Sociedad Española de Oncología Médica).
Footnotes
Disclosures:
C. Haymaker as received personal fees from Nanobiotix and reports consulting or advisory roles for Briacell and the Mesothelioma Applied Research Foundation. T. Cascone has received speaker’s fees from the Society for Immunotherapy of Cancer, Bristol Myers Squibb and Roche; reports consultant/advisory role fees from MedImmune, AstraZeneca, Bristol Myers Squibb, EMD Serono, Merck & Co., Genentech and Arrowhead Pharmaceuticals; and reports clinical research funding to The University of Texas MD Anderson Cancer Center from Boehringer Ingelheim, MedImmune, AstraZeneca, Bristol Myers Squibb and EMD Serono. M. Provencio reports grants, personal fees and non-financial support from BMS; grants, personal fees and non-financial support from Roche; grants, personal fees and non-financial support from AstraZeneca; personal fees from MSD; personal fees from Takeda; outside the submitted work. I. I. Wistuba has provided consulting or advisory roles for AstraZeneca/MedImmune, Asuragen, Bayer, Bristol-Myers Squibb, Genentech/Roche, GlaxoSmithKline, Guardant Health, HTG Molecular Diagnostics, Merck, MSD Oncology, Lilly, OncoCyte, Novartis, Flame Inc, and Pfizer; has received grants and personal fees from Asuragen, Genentech/Roche, Bristol Myers Squibb, AstraZeneca/MedImmune, HTG Molecular, Merck, and Guardant Health; has received personal fees from GlaxoSmithKline and Oncocyte, Daiichi-Sankyo, Roche, Astra Zeneca, Pfizer and Bayer; has received research funding to his institution from 4D Molecular Therapeutics, Adaptimmune, Adaptive Biotechnologies, Akoya Biosciences, Amgen, Bayer, EMD Serono, Genentech, Guardant Health, HTG Molecular Diagnostics, Iovance Biotherapeutics, Johnson & Johnson, Karus Therapeutics, MedImmune, Merck, Novartis, OncoPlex Diagnostics, Pfizer, Silicon Biosytems, Takeda, and Novartis. H. Kadara reports research funding from Johnson and Johnson outside the scope of the work.
REFERENCES
- 1.Siegel RL, Miller KD, Fuchs HE & Jemal A Cancer statistics, 2022. CA. Cancer J. Clin. 72, 7–33 (2022). [DOI] [PubMed] [Google Scholar]
- 2.Siegel RL, Miller KD, Fuchs HE & Jemal A Cancer Statistics, 2021. CA. Cancer J. Clin 71, 7–33 (2021). [DOI] [PubMed] [Google Scholar]
- 3.National Lung Screening Trial Research Team et al. Results of initial low-dose computed tomographic screening for lung cancer. N. Engl. J. Med. 368, 1980–91 (2013). [DOI] [PMC free article] [PubMed] [Google Scholar]
- 4.Timmerman R et al. Stereotactic body radiation therapy for inoperable early stage lung cancer. JAMA 303, 1070–6 (2010). [DOI] [PMC free article] [PubMed] [Google Scholar]
- 5.Felip E et al. Adjuvant atezolizumab after adjuvant chemotherapy in resected stage IB-IIIA non-small-cell lung cancer (IMpower010): a randomised, multicentre, open-label, phase 3 trial. Lancet (London, England) 398, 1344–1357 (2021). [DOI] [PubMed] [Google Scholar]
- 6.Sinjab A et al. Resolving the spatial and cellular architecture of lung adenocarcinoma by multiregion single-cell sequencing. Cancer Discov. (2021). doi: 10.1158/2159-8290.CD-20-1285 [DOI] [PMC free article] [PubMed] [Google Scholar]
- 7.Dejima H et al. Immune evolution from preneoplasia to invasive lung adenocarcinomas and underlying molecular features. Nat. Commun. 12, 2722 (2021). [DOI] [PMC free article] [PubMed] [Google Scholar]
- 8.Remark R et al. Immune contexture and histological response after neoadjuvant chemotherapy predict clinical outcome of lung cancer patients. Oncoimmunology 5, e1255394 (2016). [DOI] [PMC free article] [PubMed] [Google Scholar]
- 9.Munari E et al. Impact of PD-L1 and PD-1 Expression on the Prognostic Significance of CD8+ Tumor-Infiltrating Lymphocytes in Non-Small Cell Lung Cancer. Front. Immunol. 12, (2021). [DOI] [PMC free article] [PubMed] [Google Scholar]
- 10.Mascaux C et al. Immune evasion before tumour invasion in early lung squamous carcinogenesis. Nature 571, 570–575 (2019). [DOI] [PubMed] [Google Scholar]
- 11.Mahoney KM, Rennert PD & Freeman GJ Combination cancer immunotherapy and new immunomodulatory targets. Nat. Rev. Drug Discov. 14, 561–84 (2015). [DOI] [PubMed] [Google Scholar]
- 12.Gill J & Prasad V A reality check of the accelerated approval of immune-checkpoint inhibitors. Nat. Rev. Clin. Oncol. 16, 656–658 (2019). [DOI] [PubMed] [Google Scholar]
- 13.Gettinger S et al. Five-Year Follow-Up of Nivolumab in Previously Treated Advanced Non-Small-Cell Lung Cancer: Results From the CA209-003 Study. J. Clin. Oncol. 003, JCO2017770412 (2018). [DOI] [PubMed] [Google Scholar]
- 14.Reck M et al. Five-Year Outcomes With Pembrolizumab Versus Chemotherapy for Metastatic Non-Small-Cell Lung Cancer With PD-L1 Tumor Proportion Score ≥ 50. J. Clin. Oncol. 39, 2339–2349 (2021). [DOI] [PMC free article] [PubMed] [Google Scholar]
- 15.Doroshow DB et al. PD-L1 as a biomarker of response to immune-checkpoint inhibitors. Nat. Rev. Clin. Oncol. 18, 345–362 (2021). [DOI] [PubMed] [Google Scholar]
- 16.Lucibello G, Mograbi B, Milano G, Hofman P & Brest P PD-L1 regulation revisited: impact on immunotherapeutic strategies. Trends Mol. Med. (2021). doi: 10.1016/j.molmed.2021.06.005 [DOI] [PubMed] [Google Scholar]
- 17.Provencio M et al. Neoadjuvant chemotherapy and nivolumab in resectable non-small-cell lung cancer (NADIM): an open-label, multicentre, single-arm, phase 2 trial. Lancet. Oncol 21, 1413–1422 (2020). [DOI] [PubMed] [Google Scholar]
- 18.Cascone T et al. Neoadjuvant nivolumab or nivolumab plus ipilimumab in operable non-small cell lung cancer: the phase 2 randomized NEOSTAR trial. Nat. Med. 27, 504–514 (2021). [DOI] [PMC free article] [PubMed] [Google Scholar]
- 19.Forde PM et al. Neoadjuvant PD-1 Blockade in Resectable Lung Cancer. N. Engl. J. Med. 378, 1976–1986 (2018). [DOI] [PMC free article] [PubMed] [Google Scholar]
- 20.Shu CA et al. Neoadjuvant atezolizumab and chemotherapy in patients with resectable non-small-cell lung cancer: an open-label, multicentre, single-arm, phase 2 trial. Lancet Oncol 21, 786–795 (2020). [DOI] [PubMed] [Google Scholar]
- 21.Gao S et al. Neoadjuvant PD-1 inhibitor (Sintilimab) in NSCLC. J. Thorac. Oncol. 15, 816–826 (2020). [DOI] [PubMed] [Google Scholar]
- 22.Altorki NK et al. Neoadjuvant durvalumab with or without stereotactic body radiotherapy in patients with early-stage non-small-cell lung cancer: a single-centre, randomised phase 2 trial. Lancet. Oncol 22, 824–835 (2021). [DOI] [PubMed] [Google Scholar]
- 23.Rothschild SI et al. SAKK 16/14: Durvalumab in Addition to Neoadjuvant Chemotherapy in Patients With Stage IIIA(N2) Non–Small-Cell Lung Cancer—A Multicenter Single-Arm Phase II Trial. J. Clin. Oncol. JCO.21.00276 (2021). doi: 10.1200/JCO.21.00276 [DOI] [PubMed] [Google Scholar]
- 24.Spicer J et al. Surgical outcomes from the phase 3 CheckMate 816 trial: Nivolumab (NIVO) + platinum-doublet chemotherapy (chemo) vs chemo alone as neoadjuvant treatment for patients with resectable non-small cell lung cancer (NSCLC). J. Clin. Oncol. 39, 8503–8503 (2021). [Google Scholar]
- 25.Versluis JM, Long GV & Blank CU Learning from clinical trials of neoadjuvant checkpoint blockade. Nat. Med. 26, 475–484 (2020). [DOI] [PubMed] [Google Scholar]
- 26.Kadara H et al. Whole-exome sequencing and immune profiling of early-stage lung adenocarcinoma with fully annotated clinical follow-up. Ann. Oncol. Off. J. Eur. Soc. Med. Oncol. 28, 75–82 (2017). [DOI] [PMC free article] [PubMed] [Google Scholar]
- 27.Travis WD et al. IASLC Multidisciplinary Recommendations for Pathologic Assessment of Lung Cancer Resection Specimens After Neoadjuvant Therapy. J. Thorac. Oncol. 15, 709–740 (2020). [DOI] [PMC free article] [PubMed] [Google Scholar]
- 28.Pataer A et al. Histopathologic response criteria predict survival of patients with resected lung cancer after neoadjuvant chemotherapy. J. Thorac. Oncol. 7, 825–32 (2012). [DOI] [PMC free article] [PubMed] [Google Scholar]
- 29.Parra ER et al. Image Analysis-based Assessment of PD-L1 and Tumor-Associated Immune Cells Density Supports Distinct Intratumoral Microenvironment Groups in Non-small Cell Lung Carcinoma Patients. Clin. Cancer Res. 22, 6278–6289 (2016). [DOI] [PMC free article] [PubMed] [Google Scholar]
- 30.Tsao Ming Sound, Kerr Keith M., S. D. & Yatabe Yasushi, F. R. H. IASLC Atlas od PD-L1 immunohistochemistry testing in Lung cancer. (Rx Press, 2017). [Google Scholar]
- 31.Herbst RS et al. Predictive correlates of response to the anti-PD-L1 antibody MPDL3280A in cancer patients. Nature 515, 563–7 (2014). [DOI] [PMC free article] [PubMed] [Google Scholar]
- 32.Jaramillo MC, LaRoche D, Ran D & Navratil M Gene expression profiling signatures for immunophenotyping of tumor microenvironment using HTG EdgeSeq Precision Immuno-Oncology Panel. J. Clin. Oncol. 39, e14528–e14528 (2021). [Google Scholar]
- 33.Jiang P et al. Signatures of T cell dysfunction and exclusion predict cancer immunotherapy response. Nat. Med. 24, 1550–1558 (2018). [DOI] [PMC free article] [PubMed] [Google Scholar]
- 34.Sidders B et al. Adenosine Signaling Is Prognostic for Cancer Outcome and Has Predictive Utility for Immunotherapeutic Response. Clin. Cancer Res. 26, 2176–2187 (2020). [DOI] [PubMed] [Google Scholar]
- 35.Ayers M et al. IFN-γ-related mRNA profile predicts clinical response to PD-1 blockade. J. Clin. Invest. 127, 2930–2940 (2017). [DOI] [PMC free article] [PubMed] [Google Scholar]
- 36.Rooney MS, Shukla SA, Wu CJ, Getz G & Hacohen N Molecular and genetic properties of tumors associated with local immune cytolytic activity. Cell 160, 48–61 (2015). [DOI] [PMC free article] [PubMed] [Google Scholar]
- 37.McDermott DF et al. Clinical activity and molecular correlates of response to atezolizumab alone or in combination with bevacizumab versus sunitinib in renal cell carcinoma. Nat. Med. 24, 749–757 (2018). [DOI] [PMC free article] [PubMed] [Google Scholar]
- 38.Hwang S et al. Immune gene signatures for predicting durable clinical benefit of anti-PD-1 immunotherapy in patients with non-small cell lung cancer. Sci. Rep. 10, 643 (2020). [DOI] [PMC free article] [PubMed] [Google Scholar]
- 39.Kargl J et al. Neutrophil content predicts lymphocyte depletion and anti-PD1 treatment failure in NSCLC. JCI Insight 4, (2019). [DOI] [PMC free article] [PubMed] [Google Scholar]
- 40.Le X et al. Characterization of the Immune Landscape of EGFR-Mutant NSCLC Identifies CD73/Adenosine Pathway as a Potential Therapeutic Target. J. Thorac. Oncol 16, 583–600 (2021). [DOI] [PMC free article] [PubMed] [Google Scholar]
- 41.Rocha P et al. CD73 expression defines immune, molecular, and clinicopathological subgroups of lung adenocarcinoma. Cancer Immunol. Immunother. 70, 1965–1976 (2021). [DOI] [PMC free article] [PubMed] [Google Scholar]
- 42.Chaft JE et al. Evolution of systemic therapy for stages I–III non-metastatic non-small-cell lung cancer. Nat. Rev. Clin. Oncol. (2021). doi: 10.1038/s41571-021-00501-4 [DOI] [PMC free article] [PubMed] [Google Scholar]
- 43.Grant MJ, Herbst RS & Goldberg SB Selecting the optimal immunotherapy regimen in driver-negative metastatic NSCLC. Nat. Rev. Clin. Oncol. (2021). doi: 10.1038/s41571-021-00520-1 [DOI] [PubMed] [Google Scholar]
- 44.Tang H et al. PD-L1 on host cells is essential for PD-L1 blockade–mediated tumor regression. J. Clin. Invest. 128, 580–588 (2018). [DOI] [PMC free article] [PubMed] [Google Scholar]
- 45.Lin H et al. Host expression of PD-L1 determines efficacy of PD-L1 pathway blockade–mediated tumor regression. J. Clin. Invest. 128, 805–815 (2018). [DOI] [PMC free article] [PubMed] [Google Scholar]
- 46.Teng MWL, Ngiow SF, Ribas A & Smyth MJ Classifying Cancers Based on T-cell Infiltration and PD-L1. Cancer Res. 75, 2139–45 (2015). [DOI] [PMC free article] [PubMed] [Google Scholar]
- 47.Roepman P et al. An Immune Response Enriched 72-Gene Prognostic Profile for Early-Stage Non–Small-Cell Lung Cancer. Clin. Cancer Res. 15, 284–290 (2009). [DOI] [PubMed] [Google Scholar]
- 48.Prat A et al. Immune-Related Gene Expression Profiling After PD-1 Blockade in Non–Small Cell Lung Carcinoma, Head and Neck Squamous Cell Carcinoma, and Melanoma. Cancer Res. 77, 3540–3550 (2017). [DOI] [PubMed] [Google Scholar]
- 49.Paz-Ares LG et al. Nivolumab (NIVO) plus ipilimumab (IPI) versus chemotherapy (chemo) as first-line (1L) treatment for advanced non-small cell lung cancer (NSCLC): 4-year update from CheckMate 227. J. Clin. Oncol. 39, 9016–9016 (2021). [Google Scholar]
- 50.Reck M et al. First-line nivolumab (NIVO) plus ipilimumab (IPI) plus two cycles of chemotherapy (chemo) versus chemo alone (4 cycles) in patients with advanced non-small cell lung cancer (NSCLC): Two-year update from CheckMate 9LA. J. Clin. Oncol. 39, 9000–9000 (2021). [Google Scholar]
- 51.Patel SS et al. The microenvironmental niche in classic Hodgkin lymphoma is enriched for CTLA-4-positive T cells that are PD-1-negative. Blood 134, 2059–2069 (2019). [DOI] [PMC free article] [PubMed] [Google Scholar]
- 52.Lavin Y et al. Innate Immune Landscape in Early Lung Adenocarcinoma by Paired Single-Cell Analyses. Cell 169, 750–765.e17 (2017). [DOI] [PMC free article] [PubMed] [Google Scholar]
- 53.Bruni D, Angell HK & Galon J The immune contexture and Immunoscore in cancer prognosis and therapeutic efficacy. Nat. Rev. Cancer 20, 662–680 (2020). [DOI] [PubMed] [Google Scholar]
- 54.Litchfield K et al. Meta-analysis of tumor- and T cell-intrinsic mechanisms of sensitization to checkpoint inhibition. Cell 184, 596–614.e14 (2021). [DOI] [PMC free article] [PubMed] [Google Scholar]
- 55.AbdulJabbar K et al. Geospatial immune variability illuminates differential evolution of lung adenocarcinoma. Nat. Med. 26, 1054–1062 (2020). [DOI] [PMC free article] [PubMed] [Google Scholar]
- 56.DeNardo DG & Ruffell B Macrophages as regulators of tumour immunity and immunotherapy. Nat. Rev. Immunol. 19, 369–382 (2019). [DOI] [PMC free article] [PubMed] [Google Scholar]
- 57.Casanova-Acebes M et al. Tissue-resident macrophages provide a pro-tumorigenic niche to early NSCLC cells. Nature (2021). doi: 10.1038/s41586-021-03651-8 [DOI] [PMC free article] [PubMed] [Google Scholar]
- 58.Bagaev A et al. Conserved pan-cancer microenvironment subtypes predict response to immunotherapy. Cancer Cell 39, 845–865.e7 (2021). [DOI] [PubMed] [Google Scholar]
- 59.van Dijk N et al. Preoperative ipilimumab plus nivolumab in locoregionally advanced urothelial cancer: the NABUCCO trial. Nat. Med. 26, 1839–1844 (2020). [DOI] [PubMed] [Google Scholar]
- 60.Lee J et al. PS01.05 Surgical and Clinical Outcomes With Neoadjuvant Atezolizumab in Resectable Stage IB–IIIB NSCLC: LCMC3 Trial Primary Analysis. J. Thorac. Oncol. 16, S59–S61 (2021). [Google Scholar]
- 61.Juneja VR et al. PD-L1 on tumor cells is sufficient for immune evasion in immunogenic tumors and inhibits CD8 T cell cytotoxicity. J. Exp. Med. 214, 895–904 (2017). [DOI] [PMC free article] [PubMed] [Google Scholar]
Associated Data
This section collects any data citations, data availability statements, or supplementary materials included in this article.
Supplementary Materials
Data Availability Statement
Raw data were generated in the HTG Molecular Diagnostics core facility (Tuscon, AZ). Processed data are available from the authors and derived data supporting the findings of this study are available from the corresponding author upon request.