

Abstract
Wastewater-based epidemiology is an effective tool for monitoring infectious disease spread or illicit drug use within communities. At the Ohio State University, we conducted a SARS-CoV-2 wastewater surveillance program in the 2020–2021 academic year and compared results with the university-required weekly COVID-19 saliva testing to monitor COVID-19 infection prevalence in the on-campus residential communities. The objectives of the study were to rapidly track trends in the wastewater SARS-CoV-2 gene concentrations, analyze the relationship between case numbers and wastewater signals when adjusted using human fecal viral indicator concentrations (PMMoV, crAssphage) in wastewater, and investigate the relationship of the SARS-CoV-2 gene concentrations with wastewater parameters. SARS-CoV-2 nucleocapsid and envelope (N1, N2, and E) gene concentrations, determined with reverse transcription droplet digital PCR, were used to track SARS-CoV-2 viral loads in dormitory wastewater once a week at 6 sampling sites across the campus during the fall semester in 2020. During the following spring semester, research was focused on SARS-CoV2 N2 gene concentrations at 5 sites sampled twice a week. Spearman correlations both with and without adjusting using human fecal viral indicators showed a significant correlation (p < 0.05) between human COVID-19 positive case counts and wastewater SARS-CoV-2 gene concentrations. Spearman correlations showed significant relationships between N1 gene concentrations and both TSS and turbidity, and between E gene concentrations and both pH and turbidity. These results suggest that wastewater signal increases with the census of infected individuals, in which the majority are asymptomatic, with a statistically significant (p-value <0.05) temporal correlation. The study design can be utilized as a platform for rapid trend tracking of SARS-CoV-2 variants and other diseases circulating in various communities.
Keywords: Wastewater-based surveillance, PMMoV, crAssphage, Viral shedding, Total suspended solids, Fecal mass correction
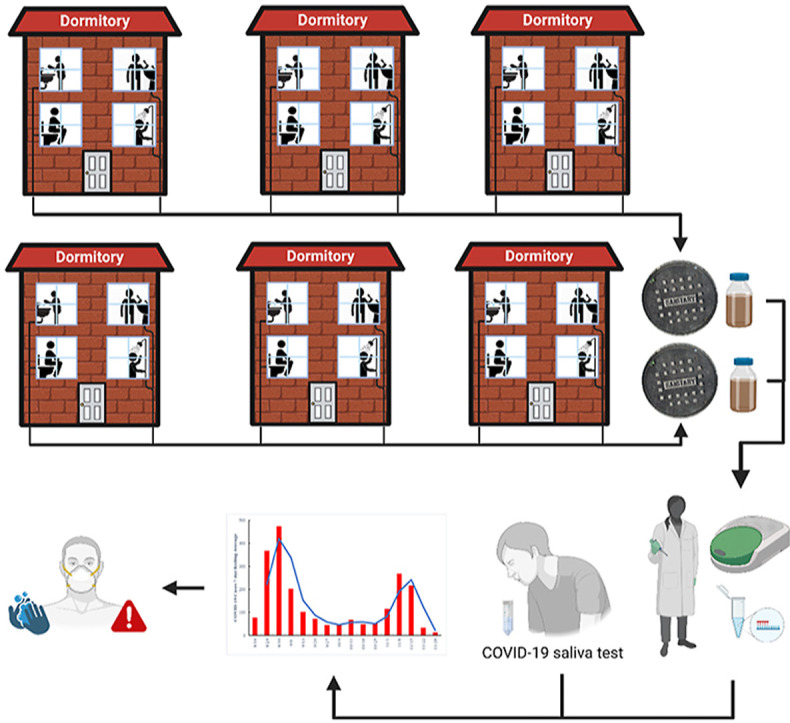
Graphical abstract
1. Introduction
In response to the COVID-19 pandemic, the Ohio State University (OSU) closed all non-critical facilities on March 21, 2020, and all students were required to move home to their permanent residences by March 22, 2020. The campus transitioned to a remote working environment (Drake, 2020).
As the April 2020 surge in infections began to decline, many universities began to plan a partial return of students to campus for the Fall 2020 semester (Betancourt et al., 2020; Gibas et al., 2021). On June 3, 2020, a hybrid autumn semester was announced for OSU, with course offerings being a combination of remote and in-person instruction. As an infection control strategy, a plan for student screening for SARS-CoV-2 was developed, with case investigation, contact tracing and quarantine coordinated with local public health agencies. A comprehensive monitoring team guided testing strategy using results of screening to inform predictive modeling, and to establish guidelines for: limiting occupancy in dormitories and classrooms; disinfection protocols; masking and distancing (OSU, 2020). In addition to testing of symptomatic individuals, all asymptomatic students were tested upon return to campus, with regular surveillance testing thereafter. Surveillance testing was based on reverse transcription polymerase chain reaction RT-PCR analysis of saliva samples, and the frequency was weekly for those living in university residence halls. Testing would increase to twice a week in the event of a spike in infection rates.
Frequency of surveillance testing was designed to control infection prevalence among asymptomatic people, with sustained increases in frequency limited by testing capacity. 12,900 students living in residence halls at this time, in addition to an off-campus student population in excess of 32,000 that was also in the testing program. As such, a collaboration started with the comprehensive monitoring team using wastewater-based surveillance testing as a complementary tool to surveillance testing for the resident campus community. Some university studies reported that wastewater surveillance can be used for early detection of COVID-19 symptomatic and asymptomatic/pre-symptomatic cases on campus (Betancourt et al., 2020; Gibas et al., 2021; Karthikeyan et al., 2021; Scott et al., 2021). However, many of these studies lack a direct comparison to infection rates in the population feeding into the wastewater catchments, raising questions as to the temporal nature of wastewater detection of SARS-CoV-2 relative to the occurrence of test-positive asymptomatic individuals. As such, combining wastewater surveillance with individual surveillance testing served both to ensure the adequacy of the weekly surveillance testing to guide control measures while also enhancing our ability to interpret and refine wastewater surveillance approaches. The latter is significant because although there are a multitude of wastewater monitoring programs at colleges across the United States (US), the approach varies at every level of methodology and analysis, reflecting variability in funding, research capabilities and goals (Harris-Lovett et al., 2021). Few such programs have analyzed the effects of fecal indicator adjustment or how wastewater quality could potentially affect wastewater gene concentration data (Karthikeyan et al., 2021). Each surveillance program varied in scale as well. For example, the University of Arizona focused on one dormitory building, while the University of San Diego surveilled over 200 buildings with varied numbers of buildings accounted for at each sampling point. These differences affect the ability to utilize the resultant data in guiding the pandemic response due to inconsistency in sampling schemes and methodologies affecting the ability to compare data between universities (Betancourt et al., 2020; Karthikeyan et al., 2021).
Wastewater is often diluted with greywater and potentially stormwater, and there was some concern as to how this would affect the data. With the additional greywater inputs such as shower and laundry usage, as well as dining hall sink outputs, the addition has the potential to dilute the wastewater signal. To resolve this, two approaches were considered in this study: 1) adjusting (“normalize”) by dividing the SARS-CoV-2 gene copy numbers by the human fecal viral indicator gene copy numbers (craAssphage or PMMoV); and 2) utilizing a fecal mass correction equation to take the fecal mass proportion into account in wastewater. The first approach, often utilized in the field of wastewater surveillance (D'Aoust et al., 2021; Scott et al., 2021; Xiao et al., 2022; Wu et al., 2020). By utilizing the fecal mass proportion, the second approach utilizes a scaling factor as a means of correcting overall fecal strength of the wastewater (we will refer to this as a fecal mass correction factor (m c)). In addition, it may be a more mathematically justifiable method of normalization by transforming the data to take a normal distribution shape, to adjusting values to chosen common scale.
Thus, the main objectives of this study were to establish the temporal and quantitative relationship between SARS-CoV-2 infection rates defined by human surveillance testing and wastewater viral signal intensities for a known population in which asymptomatic infections predominate, the latter being a function of younger age. A second objective was to examine the relationship between virus concentrations and wastewater quality parameters. Finally, since wastewater is often diluted with greywater, the third objective was to determine whether adjusting the SARS-CoV-2 wastewater signals with human fecal viral indicators (crAssphage and PMMoV) or by fecal mass correction of the viral indicators can enhance its correlation with COVID-19 confirmed cases.
2. Materials and methods
2.1. Human case data
Human case data was collected from the publicly available OSU COVID-19 Dashboard (OSU, 2020). All surveillance testing was based upon RT-PCR analysis of saliva samples. Testing in August, September and October of 2020 was performed by Vault Health, and all subsequent testing was performed by the Applied Microbiology Services Laboratory of the OSU Infectious Diseases Institute using the SalivaDirect test (Yale University, New Haven, CT). Symptomatic students were tested by Student Health Services (RT-PCR analysis of nasal swabs) and these data are included in the on-campus totals for COVID-19 cases. The dashboard was updated daily. Only the data regarding on-campus student residents was utilized for this study. The data gathered from the OSU dashboard was transformed into a 7-day rolling average for the purpose of this study.
During the move-in period (8/16-8/30), students were tested and if positive for SARS-CoV-2 or identified as a close contact with an infected individual, went into isolation or quarantine at an off-campus location. For students in-residence on campus, if they tested positive for SARS-CoV-2 through screening or diagnostic testing, they were moved to separate isolation facilities within 1–3 days of sample collection (nasal swab or saliva), and close contacts were also removed to separate quarantine facilities.
2.2. Sampling sites and sample collection
Six wastewater sewer junctions, each draining a defined portion of the wastewater from the OSU campus, were sampled once a week between August 18, 2020 and December 3, 2020. During this time, 7767 of the on-campus residents (60% of the total campus residents) in 23 buildings were captured within the wastewater monitoring catchment (Fig. 1 a). These buildings encompassed 19 dormitories, 1 recreational facility and 3 dining facilities, and the number of buildings tributary to each sampling site varied (Fig. 1a). Grab samples (1 L) were collected from each sampling site during the daytime, primarily in the morning between 9:00 and 11:00 a.m. in sterile bottles (Nalgene). An extendable sampling apparatus was lowered into the sewer manhole to collect from the flow. After collection, the samples were transported on ice to the on-campus laboratory and immediately processed.\
Fig. 1.

Sampling sites with the total number of students residing in the dormitories listed in the chart to the right. The number of dormitory buildings encompassed in each site is indicated in the chart and represented by the building symbol. A) August 16, 2020 through December 3, 2020 sampling period; and B) January 11, 2021 through May 4, 2021 sampling period.
Between January 11, 2021 and May 4, 2021, five wastewater sewer locations (manholes) were sampled twice a week. During this time, campus housed a total of 6145 students in 18 dormitories draining to the 5 sampling locations. One recreational facility and 3 dining facilities also contributed wastewater to some of the sampling locations (Fig. 1b). Composite samples (1 L) were collected twice a week utilizing compact portable autosamplers set to collect 25 mL aliquots every half hour over a 24-h period. The autosamplers were suspended below the collection sites and powered by sealed Ni-Cad batteries (Teledyne ISCO 6712C, Lincoln, NE, USA). Samples were suctioned through a sample strainer to remove gross solids and collected in sterile 1L composite bottles. Samples containers were retrieved, capped, place on ice, and transported to the laboratory for analysis. Composite samples were generally retrieved from autosamplers between 8:00–10:00 a.m. on Tuesday and Thursday mornings; thus, these samples were representative of the wastewater flow from the preceding 24 h.
2.3. Wastewater parameters
From August 18, 2020 to December 3, 2020, field measurements were taken with a multiparameter meter (Hanna HI98194, Woonsocket, RI, USA) immediately following grab sample collection. The multiparameter meter was calibrated weekly according to manufacturer instructions and using manufacturer-supplied solutions. The multiparameter meter measured temperature, pH, electrical conductivity, dissolved oxygen concentration, and oxidation reduction potential, from which dissolved solids and salinity were calculated (Table 2). All other wastewater analyses were performed the same day as sample collection. Turbidity (Nephelometric turbidity unit [NTU]) measurements were conducted according to standard method 2130B (APHA, 2012) with a Micro 100 Turbidimeter (HF Scientific Inc, Fort Myers, FL, USA). The sample bottle was inverted for 30 s to suspend settled solids. After rinsing with 25 mL of wastewater sample, a 25 mL sample was placed into the sample cell of the turbidimeter for measurement (completed in triplicate). The sample cell was rinsed with deionized (DI) water between each sample. Total suspended solids were measured according to the standard method 2540D (APHA, 2012). 0.7 mm glass-fiber filter disks (Hach 253000) and aluminum weighing dishes (Fisherbrand, 08-732-102) were used for this analysis.
Table 2.
Summary statistics of the wastewater parameters analyzed in this study.
| Parameter | Mean | Range |
|---|---|---|
| pH | 7.99 | 6.25–9.42 |
| Turbidity (NTU) | 170.05 | 6.53–1100.00 |
| TSS (mg/L) | 442.81 | 48.17–2705.83 |
2.4. Viral concentration and RNA extraction from wastewater
A 5% Tween 20 solution was added to 100 mL wastewater in a 1:100 ratio and centrifuged at 2500 RPM for 10 min at 4 °C using a Thermo Scientific Sorvall Legend XTR (Thermo Scientific, Waltham, MA, USA) for solid removal. The supernatant was then filtered through a 0.45 μM sterile filter unit (Cat. No. SLHPR33RB, Millipore-Sigma, USA) for bacteria removal. The filtered water was concentrated using the Concentrating Pipette Select™ (InnovaPrep, Drexel, MO, USA) with a 0.05 μm PS hollow fiber concentrating pipette tip (CC08011-200 Unirradiated). The sample was processed with the following protocol settings for wastewater (based on manufacturer recommendations): valve open for 600 ms, 1 pulse, foam factor of 10, valve start time of 3.0 s, flow end of 10 s, flow minimum start time of 40 s, extended delay of 3.0 s, pump at 25%, and extended pump delay time of 1 s (Ai et al., 2021). Viral recovery efficiency of this processing method was measured on a monthly basis by spiking the wastewater with human coronavirus OC43. The average recovery efficiency was 15.5 ± 7.6%.
Approximately 200 μL of eluent was obtained and used for viral RNA extraction using the AllPrep PowerViral DNA/RNA Kit (Qiagen, Valencia, CA) or the RNeasy PowerMicrobiome Kit (Cat. No. 26000-50; QIAGEN, Germantown, MD, USA) according to the manufacturer instructions. 10 μL of total RNA was then reverse transcribed from RNA to cDNA using a High-Capacity cDNA Reverse Transcription Kit (Applied Biosystems, cat No. 4368814). The resulting cDNA was then used for SARS-CoV-2 gene quantification.
2.5. Quantification of SARS-CoV-2 and human fecal viral indicators
Digital droplet PCR (ddPCR) assays were implemented for quantification of SARS-CoV-2 genes. Each wastewater sample had two biological replicates from which two technical replicates were performed for each ddPCR assay. A sample was considered positive if 3 of the 4 replicates showed positive droplets at the expected amplitude. Three monoplex assays individually targeted the N genes and the E gene of SARS-CoV-2 (Table 1 ). The N gene assays employed two primer and probe sets, both from the United States Center for Disease Control and Prevention (CDC). These sets amplify the N1 and N2 region of the N gene (Hirotsu et al., 2020; Jung et al., 2020; Wu et al., 2020). The ddPCR assay used for the E gene is based on the E_Sarbeco primers and probe set (Corman et al., 2020) recommended by the World Health Organization (WHO). The concentration of two human fecal indicators (crAssphage and PMMoV) was quantified using diluted cDNA (Dare et al., 2007; Decaro et al., 2008; Haramoto et al., 2013; Ogorzaly and Gantzer, 2006; Stachler et al., 2017) (Supplementary Table 1). Gene amplifications were conducted using 20 μL reactions containing ddPCR supermix for probes (Bio-Rad, cat No. 1863024), DNase- & RNase-free water, 900 nM of forward and reverse primers, 250 nM of probe, and cDNA templates. Following droplet generation using the QX200 Droplet Generator (Bio-Rad), a Bio-Rad C1000 Touch Thermal Cycler (Bio-Rad, Hercules, CA, USA) was used to amplify SARS-CoV-2 genes with the following conditions: 94 °C for 10 min, 40–45 cycles of denaturation and annealing/extension at 94 °C for 30 s and 60 °C for 60 s, respectively, followed by 98 °C for 10 min and then a final hold of 4 °C. The annealing temperature for the PMMoV and crAssphage assays was 53 °C, while the other PCR conditions were as above. Following amplification, target gene concentrations were determined using a QX200 droplet reader (Bio-Rad) and QuantaSoft (V 1.7; Bio-Rad). The limit of quantification (LOQ) of ddPCR reactions is 2 gene copies/reaction. For detectable but not quantifiable measurements, the results are recorded as ½ of the LOQ.
Table 1.
Primers and probes used in this study.
| Target gene | Oligonucleotide | Sequence | Reaction concentration | Reference |
|---|---|---|---|---|
| Envelope protein (E) gene | E_Sarbeco_F | ACAGGTACGTTAATAGTTAATAGCGT | 900 nM | Corman et al. (2020) |
| E_Sarbeco_R | ATATTGCAGCAGTACGCACACA | 900 nM | ||
| E_Sarbeco_P | FAM-ACACTAGCCATCCTTACTGCGCTTCG | 250 nM | ||
| Nucleocapsid protein (N) gene | N1_USCDC_F | GACCCCAAAATCAGCGAAAT | 900 nM |
Wu et al. (2020); Hirotsu et al. (2020) |
| N1_USCDC_R | TCTGGTTACTGCCAGTTGAATCTG | 900 nM | ||
| N1_USCDC_P | 5′-ACCCCGCATTACGTTTGGTGGACC-FAM-3′ | 250 nM | ||
| N2_USCDC_F | TTACAAACATTGGCCGCAAA | 900 nM | ||
| N2_USCDC_R | GCGCGACATTCCGAAGAA | 900 nM | ||
| N2_USCDC_P | FAM-ACAATTTGCCCCCAGCGCTTCAG | 250 nM |
Firefly (Coleoptera) Luciferase control RNA was implemented as an internal amplification control for the detection of PCR inhibition (Johnson et al., 2005). ddPCR mixture with or without wastewater cDNA template were spiked with an equal titer of Luciferase cDNA. PCR inhibition was assessed by comparing the difference in Luciferase gene amplification. No PCR inhibition was detected in our samples. It might be due to two reasons: the Qiagen kit used for RNA extraction includes several inhibitor removal steps; and ddPCR is more robust in handling inhibition-prone environmental samples than conventional quantitative PCR (Sedlak et al., 2014).
2.6. Fecal mass correction
The mass correction used in this analysis is based on the mass fraction of wastewater, which is an important characteristic in the design and operation of wastewater treatment plants. By mass, typical wastewater is 99–99.9% water (Metcalf et al., 2013). The remainder is then the mass fraction of solids (i.e., feces or feces associated mass) in the wastewater. This range is where the mass correction factor (m c) can be by implementing iterative or stochastic methods.
By utilizing the PMMoV or other human fecal indicator, we can calculate the fecal strength method as the mass correction. Thus, accounting for the amount of PMMoV in the system, the mass correction factor is as follows (Equation (1));
| (1) |
where is the concentration of PMMoV in human feces, is the volume of wastewater, is the volume of feces from an average person, is the concentration of PMMoV in wastewater, and is the density of feces (Rose et al., 2015). The concentration of PMMoV in human feces is assumed to be 105 - 1010 gene copies/g feces (Kuroda et al., 2015; Zhang et al., 2006). The concentration of crAssphage in human feces is assumed to be 8.1 (range 3.1–10.3) log10 gene copies/g feces (Park et al., 2020). The relationship between the fecal mass corrected wastewater gene copy values and human COVID-19 case numbers was assessed utilizing Spearman's correlation, the results of which can be found in Supplementary Information.
2.7. Data analysis
On-campus residents’ COVID-19 case numbers were retrieved from the OSU COVID-19 Dashboard (OSU, 2020). 7-day moving averages were calculated from the case numbers in Microsoft Excel V 2102 (Microsoft, Redmond, WA). All plots were generated within Excel V 2102 with moving average trendlines. Additionally, tables and figures were created within the draw.io software V. 14.6.13 (JGraph Ltd., Northampton, England).
All other statistical calculations were conducted utilizing the “dplyr” and “tidyverse” packages in RStudio V. 4.0.3 (R Core Team, Vienna, Austria). Due to varying population sizes per sampling site, gene concentration data in the figures is represented per 100 students (Fig. 2 ). This was done by dividing the student population by 100 and dividing the gene concentration data by the adjusted student population. Strength of correlations were assessed utilizing Spearman correlation coefficients with a p-value < 0.05 being considered statistically significant.
Fig. 2.


A comparison between dormitory student COVID-19 cases and SARS-CoV-2 gene copies in wastewater. A) timeline of important events that substantially affect student populations on campus from August 16, 2020 through December 4, 2020. Graphs show SARS-CoV-2 gene concentrations in wastewater (red) compared to human case numbers (blue) for dormitory occupants; B) N2 concentrations quantified; C) N1 concentrations quantified; and D) E gene concentrations quantified in wastewater. All gene concentration data was normalized and scaled to 100 students. . (For interpretation of the references to colour in this figure legend, the reader is referred to the Web version of this article.)
3. Results
3.1. SARS-CoV-2 in wastewater and human confirmed cases
SARS-CoV-2 viral signal was detected in the wastewater on all sample dates for the August 16 through December 3, 2020 sampling period (n = 101). Detection was sporadic from the weeks of August 16–30 due to student move-in on campus. While all students were required to take a COVID-19 saliva test prior to move-in, not all students were living on campus, with some students quarantined at off-campus sites before being allowed to integrate into campus living, depending on where the students were moving from. In addition, students had staggered move-in dates, causing the on-campus population to change gradually over the week. The normal student occupancy in the dorms observed within the sampling range during the autumn 2020 semester was 7767 students, with daily on campus new positive student COVID-19 cases ranging from 0 to 165. This number potentially varied depending on student holidays and significant on-campus events (Fig. 2a). Over the course of the study, SARS-CoV-2 viral load in the wastewater ranged between 0 and 6.08 105 gene copies/L with the average for N1, N2, and E being 3.29 104, 2.69 104, and 3.45 104 gene copies/L, respectively at individual sites. Outside of the initial move-in dates, the SARS-CoV-2 viral load data was in line with the increases and decreases in the human case data trend. Any peaks in viral load unmatched by human case data led to repeated analyses to ensure accurate data (Fig. 2, see 10/18). The peak in the human case data shown at 11/8–11/15 is matched by a sharp peak in SARS-CoV-2 N and E gene detections (Fig. 2). The sporadic detection days of 8/16 to 8/30 were removed, due to students testing positive upon arrival and immediately going to off-site isolation facilities where they did not contribute to the wastewater. When 8/16 to 8/30 were removed, Spearman correlation coefficients revealed a significant relationship (p-value < 0.05) between all wastewater SARS-CoV-2 gene concentrations and the human case data from the same week (Table 4 ).
Table 4.
Summary of Spearman's correlation analyses between the normalized SARS-CoV-2 data and the human case data. The bolded or underlined values are for significant relationships (p-value < 0.05 or < 0.10, respectively). During 8/16-8/30, on-campus student populations and resulting gene concentration data were substantially affected by move-in.
| Parameter | N2 Gene |
N1 Gene |
E Gene |
|||
|---|---|---|---|---|---|---|
| p-value | rho | p-value | Rho | p-value | rho | |
| Without 8/16–8/30 | 0.05 | 0.56 | 0.05 | 0.55 | 0.06 | 0.54 |
| All dates included | 0.50 | 0.18 | 0.30 | 0.30 | 0.82 | 0.06 |
During the January 11 through May 4, 2021 sampling period (n = 154), only N2 gene concentrations were analyzed during this sampling period, as previous studies and other literature supported that N2 gene concentrations show the strongest correlation with positive confirmed cases in 9 different Ohio sewersheds (Ai et al., 2021). Moreover, it has been suggested that the primer binding region of the N2 gene region is less prone to mutation (Rahman et al., 2021). N2 gene concentrations for this sampling period in wastewater ranged between 0 and 2.51 104 gene copies/L with an average of 720 gene copies/L at individual sites. The gene concentrations overall were significantly lower (p-value < 0.05) than those in the previous semester, which corresponded to the decreased number of human COVID-19 cases on campus (Fig. 3 ). The N2 gene concentrations for the full academic year (August 2020–May 2021) were significantly correlated (p-value < 0.05, Spearman's rho > 0.5) to the human COVID-19 case data for the campus population (Table 5 ).
Fig. 3.

A comparison between dormitory student COVID-19 cases and SARS-CoV-2 gene copies in wastewater for the January 11, 2021 through May 4, 2021 sampling period. A) timeline of important campus events that substantially affect student populations on campus; B) graph of the N2 gene concentrations in wastewater (red) scaled to 100 students compared to human case numbers (blue); and C) timeline of the state of Ohio's vaccine distribution plan and the percentage of Franklin County's fully vaccinated population sits below. (For interpretation of the references to colour in this figure legend, the reader is referred to the Web version of this article.)
Table 5.
Summary of Spearman's correlation between the on-campus COVID-19 cases and SARS-CoV-2 N2 gene concentration/L of wastewater (scaled to 100 students) observed during the semesters and full academic year (i.e., August 16, 2020 through May 4, 2021). Significant values are bolded (p < 0.05).
| August–December (2020) |
January–May (2021) |
August–May (2020–2021) |
|||
|---|---|---|---|---|---|
| p-value | rho | p-value | rho | p-value | rho |
| 0.49 | 0.18 | 0.78 | 0.07 | 0.004 | 0.48 |
3.2. SARS-CoV-2 vs. human fecal viral indicators in wastewater
When the viral gene concentration data was adjusted using the fecal indicators gene copy numbers, there was also a significant correlation (p-value < 0.05, Spearman's rho > 0.5) between the campus dormitory COVID-19 cases and the SARS-CoV-2 gene concentrations for the full academic year of sampling. Adjusting the viral load data by dividing by these fecal indicator concentrations improved the correlation with human case data when comparing to the unadjusted data (Table 6 and Fig. 4 ).
Table 6.
Summary of Spearman's correlation between the on-campus COVID-19 cases and SARS-CoV-2 N2 gene copies/L of wastewater (scaled to 100 students). Two viral indicators are utilized to standardize the wastewater data per semester and for the full academic year. Significant values are bolded (p < 0.05).
| normalized by PMMoV |
normalized by crAssphage |
|||||
|---|---|---|---|---|---|---|
| p-value | rho | p-value | rho | p-value | rho | |
| August–December | 0.49 | 0.18 | 0.21 | 0.33 | 0.21 | 0.33 |
| January–May | 0.78 | 0.07 | 0.71 | 0.096 | 0.67 | 0.11 |
| All dates included | 0.004 | 0.48 | 0.0002 | 0.59 | 0.0004 | 0.58 |
Fig. 4.

A comparison between dormitory student COVID-19 cases (blue) and SARS-CoV-2 gene copies in wastewater (scaled to 100 students) adjusted utilizing fecal indicators (red). A) standardized by PMMoV; and B) standardized by crAssphage. (For interpretation of the references to colour in this figure legend, the reader is referred to the Web version of this article.)
3.3. Wastewater quality parameters and SARS-CoV-2 concentrations
Turbidity, pH, and total suspended solids were all measured and utilized for correlation analysis (Table 2). Using Spearman's correlations, the E gene had a minor significance (p-value < 0.1) to pH and TSS, and the N1 gene concentrations were significantly correlated with turbidity (p-value < 0.05, Spearman's rho > 0.5) and TSS values (p-value < 0.05, Spearman's rho > 0.5) (Table 3). This analysis revealed no significant relationship between the wastewater quality parameters and N2 gene concentrations.
Table 3.
Summary of Spearman correlation analysis between wastewater parameters and SARS-CoV-2 target gene concentrations between August 18, 2020 through December 4, 2020. Significant values are bolded for p < 0.05 and underlined for p < 0.1.
| Parameter | pH |
Turbidity |
Total suspended solid |
|||
|---|---|---|---|---|---|---|
| p-value | rho | p-value | rho | p-value | rho | |
| N1 Gene | 0.112 | 0.200 | 0.002 | 0.337 | 0.001 | 0.352 |
| N2 Gene | 0.322 | 0.126 | 0.173 | 0.143 | 0.132 | 0.158 |
| E Gene | 0.078 | 0.222 | 0.177 | 0.142 | 0.083 | 0.182 |
4. Discussion
4.1. SARS-CoV-2 in wastewater as a pandemic surveillance tool
Wastewater-based epidemiology (WBE) is a useful and practical tool to study trends in infectious disease (e.g. polio, influenza A (H1N1)) and drug usage (e.g. illicit drug use, antibiotic resistance) at the community-level (Heijnen and Medema, 2011; Hovi et al., 2011; Zuccato et al., 2008). The wastewater monitoring project performed herein coupled with regular testing of undergraduate students residing on campus demonstrated how effective wastewater monitoring can be during an on-going global pandemic. The wastewater monitoring data from this study allowed the campus to perform focused surveillance of specific dormitories or possible hotspots while remaining more cost-effective and less intrusive than requiring additional student testing at potential hotspots.
The wastewater gene concentrations data set revealed similar quantitative results for the N genes and the E gene (Fig. 2). This is unique, as the E gene is not often utilized in SARS-CoV-2 wastewater monitoring and is often detected at significantly lower levels than N gene concentrations in wastewater (Medema et al., 2020). The wastewater N1, N2, and E gene concentrations all showed significant correlation (p-value < 0.05) with the human case data; therefore, the wastewater monitoring results from this study provided an accurate depiction of human case data trends and could be a strong tool for surveillance of community health. That being said, there is variability in wastewater signal relative to the number of infected individuals detected by the campus surveillance testing and the smaller number identified by diagnostic testing (of symptomatic individuals). This may reflect person-to-person variability in the presence and magnitude of gastrointestinal shedding of virus, compared to the consistent shedding of virus in nasal secretions and saliva of infected individuals (Zhang et al., 2021). Furthermore, the variability and likelihood of population reduction around the periods of move-in and move-out of campus would likely influence the wastewater viral loads toward the beginning and end of the semesters. In addition, weekly surveillance testing can miss peaks of asymptomatic infections (see Figs. 2 and 10/18) that can otherwise be detected in wastewater samples, reflecting the longer duration of gastrointestinal shedding of virus relative to viral shedding in the upper respiratory tract. Overall, the rise in wastewater signal tends to correspond to the rise in the number of individual cases. Furthermore, it is valuable to note that this corresponding data is within a university setting, with less bias than a city-wide study, as only residents and employees were permitted in the dormitory buildings at this time. Wastewater surveillance is thus an effective tool to complement current surveillance efforts as the pandemic continues to change.
4.2. Environmental uncertainties
While WBE is a powerful tool that avoids many biased clinical factors within a community (lack of asymptomatic testing, testing availability limitations, etc.) it can often be affected by uncertainties such as RNA degradation of the viruses over time during the conveyance of wastewater from the source to a wastewater treatment plant. However, the wastewater for this study was collected from manholes and immediately taken to the lab, allowing for rapid processing and data collection from fresh wastewater samples. Sampling points herein were located less than a few hundred meters from the wastewater source.
Other environmental uncertainties could also potentially affect WBE study results (Gonzalez et al., 2020). One research study examining the behavior of enveloped and non-enveloped viruses in raw wastewater observed that up to 26% of two enveloped viruses (murine hepatitis virus and Pseudomonas phage φ6) adsorbed to wastewater solids, in comparison to the 6% observed in two non-enveloped viruses (Enterobacteria phage MS2 and T3), making them potentially more intact in wastewater with higher TSS and turbidity levels (Ye et al., 2016). In this study, N1 gene concentrations significantly correlated with both the TSS and turbidity of wastewater (Table 3). Scott et al. (2021) did not observe association between N1 and N2 concentration in wastewater and wastewater turbidity in dorm samples. Further research is needed to fully understand how much TSS and turbidity affect wastewater SARS-CoV-2 viral RNA concentrations, particularly in wastewater heavily diluted with greywater. Raw wastewater has high turbidity and TSS which could potentially contribute to higher viral concentrations, as the virus may be stabilized in the turbid environments. Low wastewater pH can also lead to virion degradation (Corpuz et al., 2020). When testing viral pH tolerance, it was observed that viruses maintain stability ranging roughly from neutral to 8.5, with rapidly decreased stability once pH reaches 6.0 or below (Stallknecht et al., 1990). Many wastewater physicochemical parameters are routinely measured at wastewater treatment plants, require less expensive equipment than molecular biology measurements, and are quick and easy to measure. Because of these factors, wastewater physicochemical parameters may serve as complementary or alternative tools for adjusting the viral load data to improve strength of statistical relationships with community health outcomes for WBE.
4.3. Normalization with fecal indicators
Previous studies have shown how grey water might dilute and affect the SARS-CoV-2 gene concentrations (Gibas et al., 2021). Thus, to reduce the fluctuation in fecal strength due to grey water dilution, human-specific fecal viral indicator quantifications were used to adjust the N2 gene concentration correlation with two different methods. When dividing SARS-CoV-2 gene copies by the fecal viral indicator gene copies, this adjusted viral load slightly improved the correlation to human case data, although statistical significance was already observed with both the unadjusted and adjusted viral load data sets (Table 6). Similarly, Scott et al. (2021) reported enhanced correlation of wastewater markers from single dormitory buildings with cases when adjusted for PMMoV. Interestingly, Nagarkar et al. (2022) reported increase due to normalization (fecal marker and recovery) between wastewater SARS-CoV-2 concentration and cases in larger sewersheds, while raw N1/N2 concentrations corresponded with cases better at smaller sewersheds. Other municipal level studies observed lower correlation between cases and wastewater SARS-CoV-2 markers when fecal mass correction was used (Feng et al., 2021; Ai et al., 2021).
The fecal mass correction using equation (1) was integrated utilizing PMMoV and crAss phage as fecal indicators (Supplementary Figure 1). While the results of this correction were not significant (i.e., higher p-values), this approach may provide less uncertainty in this model (Supplementary Table 2). The model considers the mass fraction of solids in the wastewater, which is not represented in the unitless factor relating pathogen to indicator concentration generated by the preceding methodology. While we did not see a significant improvement within our samples (directly from manholes), other sample types (e.g. wastewater treatment plant influents) may benefit from utilizing this method to enhance the statistical analysis.
The fecal indicator adjustment results show how the uncertainty imparted by grey water dilution can potentially affect wastewater-based surveillance data. However, the continuation of wastewater monitoring and the significant correlation between the N2 gene concentrations and human COVID-19 case numbers on campus for the full year (with and without fecal indicator adjustment) continues to support the concept of wastewater surveillance being an adequate tool for community health monitoring.
4.4. Further considerations
Confirmed case numbers were substantially lower on the OSU campus in comparison to the rest of Franklin County, Ohio, as the average positivity rate from Franklin County for the duration of this study was 6.74% compared to the OSU on-campus rate of 0.89% (Franklin County Public Health, 2020). This substantial difference is likely due to the lack of required regular testing for the citizens of Franklin County, therefore only residents that are symptomatic get tested leading to a higher positivity rate. OSU campus students were all required to test weekly at minimum, in comparison to state-wide programs that were unable to require regular testing of residents. This required testing provided an active regular detection of asymptomatic and symptomatic cases; a human case data set unique to the campus for analysis. This data set potentially provided a more accurate comparison to the campus wastewater data vs. comparing state-wide surveillance programs and human case data, which would not capture all human case numbers.
It is also important to acknowledge that the spring semester wastewater SARS-CoV-2 viral loads overall were lower than the autumn semester. This is likely due to seasonal trends in viral prevalence, as other variables such as student population and testing requirements did not drastically change between semesters. The lower human case numbers and viral load data overall reflects the potential effect of seasonal viral prevalence and how that may need to be considered in the future of wastewater surveillance.
4.5. Future of wastewater surveillance
The surveillance efforts outlined here could potentially serve as long-term monitoring of vaccine effectiveness within the community as well as other universities and residential communities. This study is novel in its focus on university dormitories and considerations of fecal mass correction. It is also novel in evolving to incorporate sampling twice a week on a university campus, as research has shown higher sampling frequency per week improves accuracy in trend analyses (Feng et al., 2021; Safford et al., 2022). It represents one way in which wastewater can be utilized to monitor specific communities of people for public health decision-making while also acknowledging concerns and knowledge gaps in what is currently known about wastewater monitoring. However, the analysis of wastewater parameter relationships and fecal strength in the wastewater revealed an uncertainty within the SARS-CoV-2 gene concentration analysis and how it may be subjected to uncertainties, such as grey water dilution, pH, turbidity and TSS of the wastewater.
As SARS-CoV-2 or other emerging infectious disease wastewater surveillance continues to expand across the country, more research needs to be done on the most effective way to collect and utilize data gathered from surveillance to effectively address public health concerns. Research currently lacks consistency in collection size, frequency, and specificity (building specific, community-focused, city-wide, etc.) and it is currently unclear on how this affects the utility of wastewater surveillance data downstream. The variety of SARS-CoV-2 monitoring methodologies and interpretation of results affects the utility of the data in a public health setting as well, and consistency needs to be established. Previous wastewater surveillance papers have suggested that wastewater surveillance has a temporal lead over clinical testing in predicting trends (Peccia et al., 2020; Randazzo et al., 2020; Wu et al., 2020). However, as the clinical testing efforts have continually adapted over the course of the pandemic, this lead has not been seen in trends later in the course of the pandemic (Xiao et al., 2022).
We recommend further research on the best ways to utilize pandemic wastewater surveillance; how it can be better utilized for decision-making or better quantified for comparison to other community results, as well as how it can methodologically be made more consistent for discussion and international comparisons in the future. We also recommend further research on how other communities can effectively adapt surveillance methodologies to their own needs.
5. Conclusion
This study validates the potential of wastewater-based surveillance to be used as a complementary monitoring tool for this and future pandemics. There are currently a few challenges associated with this tool such as the influence of wastewater parameters as well as greywater dilution on the SARS-CoV-2 gene concentrations. However, this study provides evidence that with adjustment utilizing fecal indicators to account for greywater, the correlations between the wastewater concentrations and human cases was significantly strengthened. This study also introduces the mass correction of fecal strength methodology as a different potential estimator of greywater dilution.
The Ohio State University implemented the wastewater monitoring program as part of a safety measure implemented with the return of students on campus in Fall 2020 and is estimated to continue indefinitely as a recurrent safety strategy for the students. As vaccination efforts change, as well as the prospective end date of the pandemic, wastewater-based monitoring continues to gain recognition as a cost-effective and non-invasive technique with the potential for long-term implementation.
Credit author statement
Emily Lu: Data Curation, Formal analysis, Investigation, Visualization, Writing - Original Draft. Yuehan Ai: Methodology, Investigation, Writing - Original Draft. Angela Davis: Methodology, Writing – Review & Editing. Judith Straathof: Investigation, Writing – Review & Editing. Kent Halloran: Investigation, Resources, Supervision. Natalie Hull: Methodology, Supervision, Writing – Review & Editing. Ryan Winston: Resources, Supervision, Writing – Review & Editing. Mark Weir: Methodology, Writing – Review & Editing. Jeffrey Soller: Methodology, Writing – Review & Editing. Zuzana Bohrerova: Funding acquisition, Project administration, Writing – Review & Editing. Michael Oglesbee: Supervision, Writing - Review & Editing. Jiyoung Lee: Conceptualization, Methodology, Funding acquisition, Resources, Supervision, Writing - Review & Editing.
Declaration of competing interest
The authors declare that they have no known competing financial interests or personal relationships that could have appeared to influence the work reported in this paper.
Acknowledgements
This study was supported by funding from the Ohio Department of Health and the Ohio State University (Contact Tracing and Comprehensive Monitoring Team Programs). Funding for JAS came from the U.S. Centers for Disease Control and Prevention. We thank Emma Lancaster, Fan He and the rest of the Lee Lab members at the Ohio State University for their assistance in sample processing during this study. This research could not have been completed without the help from Joey Smith, Andrew Tirpak, and Ian Simpson in the Winston Lab and assistance from OSU Environmental Health and Safety for field work. The authors thank Rebecca Fugitt at the Ohio Department of Health for her exceptional support in various stages of the study. We appreciate Dean Amy Fairchild at the College of Public Health, the Ohio State University for the timely support in developing the methodology early in the Pandemic and guidance for the usage of wastewater data for comprehensive monitoring of COVID-19 on the campus.
Footnotes
Supplementary data to this article can be found online at https://doi.org/10.1016/j.envres.2022.113580.
Appendix A. Supplementary data
The following is the Supplementary data to this article:
References
- Ai Y., Davis A., Jones D., Lemeshow S., Tu H., He F., Lee J. 2021. Wastewater-based Epidemiology for Tracking COVID-19 Trend and Variants of Concern in Ohio, United States. medRxiv. [preprint] [DOI] [PMC free article] [PubMed] [Google Scholar]
- APHA . twenty-second ed. American Public Health Association; Washington, DC: 2012. Standard Methods for the Examination of Water and Waste Water. [Google Scholar]
- Betancourt W.W., Schmitz B.W., Innes G.K., Brown K.M.P., Prasek S.M., Stark E.R., Foster A.R., Sprissler R.S., Harris D.T., Sherchan S.P., Gerba C.P., Pepper I.L. 2020. Wastewater-based Epidemiology for Averting COVID-19 Outbreaks on the University of Arizona Campus. medRxiv. [DOI] [Google Scholar]
- Corman V.M., Landt O., Kaiser M., Molenkamp R., Meijer A., Chu D.K., Bleicker T., Brünink S., Schneider J., Schmidt M.L., Mulders D.G., Haagmans B.L., van der Veer B., van den Brink S., Wijsman L., Goderski G., Romette J.-L., Ellis J., Zambon M., Peiris M., Goossens H., Reusken C., Koopmans M.P., Drosten C. Detection of 2019 novel coronavirus (2019-nCoV) by real-time RT-PCR. Euro Surveill. 2020;25 doi: 10.2807/1560-7917.ES.2020.25.3.2000045. [DOI] [PMC free article] [PubMed] [Google Scholar]
- Dare R.K., Fry A.M., Chittaganpitch M., Sawanpanyalert P., Olsen S.J., Erdman D.D. Human coronavirus infections in rural Thailand: a comprehensive study using real-time reverse-transcription polymerase chain reaction assays. J. Infect. Dis. 2007;196:1321–1328. doi: 10.1086/521308. [DOI] [PMC free article] [PubMed] [Google Scholar]
- Decaro N., Elia G., Campolo M., Desario C., Mari V., Radogna A., Colaianni M.L., Cirone F., Tempesta M., Buonavoglia C. Detection of bovine coronavirus using a TaqMan-based real-time RT-PCR assay. J. Virol. Methods. 2008;151:167–171. doi: 10.1016/j.jviromet.2008.05.016. [DOI] [PMC free article] [PubMed] [Google Scholar]
- Drake M.V. university housing; 2020, March 12. Coronavirus (COVID-19) Updates: Classes. extension of spring break and travel [Press release] https://president.osu.edu/story/coronavirus-update-march-12. [Google Scholar]
- D'Aoust P.M., Mercier E., Montpetit D., Jia J.J., Alexandrov I., Neault N., Baig A.T., Mayne J., Zhang X., Alain T., Langlois M.A., Servos M.R., MacKenzie M., Figeys D., MacKenzie A.E., Graber T.E., Delatolla R. Quantitative analysis of SARS-CoV-2 RNA from wastewater solids in communities with low COVID-19 incidence and prevalence. Water Res. 2021;188 doi: 10.1016/j.watres.2020.116560. [DOI] [PMC free article] [PubMed] [Google Scholar]
- Feng S., Roguet A., McClary-Gutierrez J.S., Newton R.J., Kloczko N., Meiman J.G., McLellan S.L. Evaluation of sampling, analysis, and normalization methods for SATS-CoV-2 concentrations in wastewater to assess COVID-19 burdens in Wisconsin communities. ACS EST Water. 2021;1:1955–1965. doi: 10.1021/acsestwater.1c00160. [DOI] [Google Scholar]
- Franklin County Public Health . 2020. Franklin County Dashboard.https://franklindashboard.netlify.app/ Accessed. [Google Scholar]
- Gibas C., Lambirth K., Mittal N., Juel M.A.I., Barua V.B., Roppolo Brazell L., Hinton K., Lontai J., Stark N., Young I., Quach C., Russ M., Kauer J., Nicolosi B., Chen D., Akella S., Tang W., Schlueter J., Munir M. Implementing building-level SARS-CoV-2 wastewater surveillance on a university campus. Sci. Total Environ. 2021;782 doi: 10.1016/j.scitotenv.2021.146749. [DOI] [PMC free article] [PubMed] [Google Scholar]
- Gonzalez R., Curtis K., Bivins A., Bibby K., Weir M.H., Yetka K., Thompson H., Keeling D., Mitchell J., Gonzalez D. COVID-19 surveillance in Southeastern Virginia using wastewater-based epidemiology. Water Res. 2020;186 doi: 10.1016/j.watres.2020.116296. [DOI] [PMC free article] [PubMed] [Google Scholar]
- Haramoto E., Kitajima M., Kishida N., Konno Y., Katayama H., Asami M., Akiba M. Occurrence of pepper mild mottle virus in drinking water sources in Japan. Appl. Environ. Microbiol. 2013;79:7413–7418. doi: 10.1128/AEM.02354-13. [DOI] [PMC free article] [PubMed] [Google Scholar]
- Harris-Lovett S., Nelson K.L., Beamer P., Bischel H.N., Bivins A., Bruder A., Butler C., Camenisch T.D., De Long S.K., Karthikeyan S., Larsen D.A., Meierdiercks K., Mouser P.J., Pagsuyoin S., Prasek S.M., Radniecki T.S., Ram J.L., Roper D.K., Safford H., Sherchan S.P., Shuster W., Stalder T., Wheeler R.T., Korfmacher K.S. Wastewater surveillance for SARS-CoV-2 on college campuses: initial efforts, lessons learned, and research needs. Int. J. Environ. Res. Publ. Health. 2021;18(9):4455. doi: 10.3390/ijerph18094455. [DOI] [PMC free article] [PubMed] [Google Scholar]
- Heijnen L., Medema G. Surveillance of influenza A and the pandemic influenza A (H1N1) 2009 in sewage and surface water in the Netherlands. J. Water Health. 2011;9(3):434–442. doi: 10.2166/wh.2011.019. [DOI] [PubMed] [Google Scholar]
- Hirotsu Y., Mochizuki H., Omata M. Double-quencher probes improved the detection sensitivity of severe acute respiratory syndrome coronavirus 2 (SARS-CoV-2) by one-step RT-PCR (preprint) Infect. Dis. (except HIV/AIDS) 2020 doi: 10.1101/2020.03.17.20037903. [DOI] [PMC free article] [PubMed] [Google Scholar]
- Hovi T., Shulman L., van der Avoort H., Deshpande J., Roivanen M., de Gourville E. Role of environmental poliovirus surveillance in global polio eradication and beyond. Epidemiol. Infect. 2011;140(1):1–13. doi: 10.1017/S095026881000316X. [DOI] [PubMed] [Google Scholar]
- Johnson D.R., Lee P.K., Holmes V.F., Alvarez-Cohen L. An internal reference technique for accurately quantifying specific mRNAs by real-time PCR with application to the tceA reductive dehalogenase gene. Appl. Environ. Microbiol. 2005;71(7):3866–3871. doi: 10.1128/AEM.71.7.3866-3871.2005. [DOI] [PMC free article] [PubMed] [Google Scholar]
- Jung Y.J., Park G.-S., Moon J.H., Ku K., Beak S.-H., Kim S., Park E.C., Park D., Lee J.-H., Byeon C.W., Lee J.J., Maeng J.-S., Kim S.J., Kim S.I., Kim B.-T., Lee M.J., Kim H.G. Comparative analysis of primer-probe sets for the laboratory confirmation of SARS-CoV-2 (preprint) Microbiology. 2020 doi: 10.1101/2020.02.25.964775. [DOI] [Google Scholar]
- Karthikeyan S., Nguyen A., McDonald D., Zong Y., Ronquillo N., Ren J., Zou J., Farmer S., Humphrey G., Henderson D., Javidi T., Messer K., Anderson C., Schooley R., Martin N., Knight R. Rapid, large-scale wastewater surveillance and automated reporting system enable early detection of nearly 85% of COVID-19 cases on a university campus. mSystems. 2021;6(4) doi: 10.1128/msystems.00793-21. [DOI] [PMC free article] [PubMed] [Google Scholar]
- Kuroda K., Nakada N., Hanamoto S., Inaba M., Katayama H., Do A.T., Nga T.T.V., Oguma K., Hayashi T., Takizawa S. Pepper mild mottle virus as an indicator and a tracer of fecal pollution in water environments: comparative evaluation with wastewater-tracer pharmaceuticals in Hanoi, Vietnam. Sci. Total Environ. 2015;506–507:287–298. doi: 10.1016/j.scitotenv.2014.11.021. [DOI] [PubMed] [Google Scholar]
- Medema G., Heijnen L., Elsinga G., Italiaander R., Brouwer A. Presence of SARS-coronavirus-2 RNA in sewage and correlation with reported COVID-19 prevalence in the early stage of the epidemic in The Netherlands. Environ. Sci. Technol. Lett. 2020;7(7):511–516. doi: 10.1021/acs.estlett.0c00357. [DOI] [PubMed] [Google Scholar]
- Metcalf & Eddy Inc. Tchobanoglous G., Burton F.L., Tsuchihashi R., Stensel H.D. fifth ed. McGraw-Hill Professional; 2013. Wastewater Engineering: Treatment and Resource Recovery. [Google Scholar]
- Nagarkar M., Keely S.P., Jahne M., Wheaton E., Hart C., Smith B., Garland J., Varughese E.A., Braam A., Wiechman B., Morris B., Brinkman N.E. SARS-CoV-2 monitoring at three sewersheds of different scales and complexity demonstrates distinctive relationships between wastewater measurements and COVID-19 case data. Sci. Total Environ. 2021 Nov;13 doi: 10.1016/j.scitotenv.2021.151534. (Epub ahead of print) [DOI] [PMC free article] [PubMed] [Google Scholar]
- Ogorzaly L., Gantzer C. Development of real-time RT-PCR methods for specific detection of F-specific RNA bacteriophage genogroups: application to urban raw wastewater. J. Virol. Methods. 2006;138:131–139. doi: 10.1016/j.jviromet.2006.08.004. [DOI] [PubMed] [Google Scholar]
- Park G.W., Ng T., Freeland A.L., Marconi V.C., Boom J.A., Staat M.A., Montmayeur A.M., Browne H., Narayanan J., Payne D.C., Cardemil C.V., Treffiletti A., Vinjé J. CrAssphage as a novel tool to detect human fecal contamination on environmental surfaces and hands. Emerg. Infect. Dis. 2020;26(8):1731–1739. doi: 10.3201/eid2608.200346. [DOI] [PMC free article] [PubMed] [Google Scholar]
- Peccia J., Zulli A., Brackney D.E., et al. Measurement of SARS-CoV-2 RNA in wastewater tracks community infection dynamics. Nat. Biotechnol. 2020;38:1164–1167. doi: 10.1038/s41587-020-0684-z. [DOI] [PMC free article] [PubMed] [Google Scholar]
- Rahman M.S., Islam M.R., Alam A.R.U., Islam I., Hoque M.N., Akter S., et al. Evolutionary dynamics of SARS-CoV-2 nucleocapsid protein and its consequences. J. Med. Virol. 2021;93(4):2177–2195. doi: 10.1002/jmv.26626. [DOI] [PubMed] [Google Scholar]
- Randazzo W., Truchado P., Cuevas-Ferrando E., Simón P., Allende A., Sánchez G. SARS-CoV-2 RNA in wastewater anticipated COVID-19 occurrence in a low prevalence area. Water Res. 2020;181 doi: 10.1016/j.watres.2020.115942. [DOI] [PMC free article] [PubMed] [Google Scholar]
- Rose C., Parker A., Jefferson B., Cartmell A. The characterization of feces and urine: a review of the literature to inform advanced treatment technology. Crit. Rev. Environ. Sci. Technol. 2015;45(17):1827–1879. doi: 10.1080/10643389.2014.1000761. [DOI] [PMC free article] [PubMed] [Google Scholar]
- Safford H.R., Shapiro K., Bischel H.N. Wastewater analysis can be a powerful public health tool—if it's done sensibly. Proc. Natl. Acad. Sci. Unit. States Am. 2022;119(6) doi: 10.1073/pnas.2119600119. [DOI] [PMC free article] [PubMed] [Google Scholar]
- Scott L.C., Aubee A., Babahaji L., Vigil K., Tims S., Aw T.G. Targeted wastewater surveillance of SARS-CoV-2 on a university campus for COVID-19 outbreak detection and mitigation. Environ. Res. 2021;200 doi: 10.1016/j.envres.2021.111374. [DOI] [PMC free article] [PubMed] [Google Scholar]
- Sedlak R.H., Kuypers J., Jerome K.R. A multiplexed droplet digital PCR assay performs better than qPCR on inhibition prone samples. Diagn. Microbiol. Infect. Dis. 2014;80(4):285–286. doi: 10.1016/j.diagmicrobio.2014.09.004. [DOI] [PubMed] [Google Scholar]
- Stachler E., Kelty C., Sivaganesan M., Li X., Bibby K., Shanks O.C. Quantitative CrAssphage PCR assays for human fecal pollution measurement. Environ. Sci. Technol. 2017;51:9146–9154. doi: 10.1021/acs.est.7b02703. [DOI] [PMC free article] [PubMed] [Google Scholar]
- Stallknecht D.E., Kearney M.T., Shane S.M., Zwank P.J. Effects of pH, temperature, and salinity on persistence of avian influenza viruses in water. Avian Dis. 1990;34(2):412. doi: 10.2307/1591429. [DOI] [PubMed] [Google Scholar]
- The Ohio State University . The Ohio State University; 2020. COVID-19 Dashboard.https://safeandhealthy.osu.edu/dashboard Accessed. [Google Scholar]
- The Ohio State University . Ohio State News; 2020, June 3. Ohio State Announces Plans for an Autumn Semester Return to Campuses.https://news.osu.edu/ohio-state-announces-plans-for-an-autumn-semester-return-to-campuses/ Accessed. [Google Scholar]
- Wu F., Xiao A., Zhang J., Gu X., Lee W.L., Kauffman K., Hanage W., Matus M., Ghaeli N., Endo N., Duvallet C., Moniz K., Erickson T., Chai P., Thompson J., Alm E. SARS-CoV-2 titers in wastewater are higher than expected from clinically confirmed cases (preprint) Infect. Dis. (except HIV/AIDS) 2020 doi: 10.1101/2020.04.05.20051540. [DOI] [PMC free article] [PubMed] [Google Scholar]
- Xiao A., Wu F., Bushman M., Zhang J., Imakaev M., Chai P.R., Duvallet C., Endo N., Erickson T.B., Armas F., Arnold B., Chen H., Chandra F., Ghaeli N., Gu X., Hanage W.P., Lee W.L., Matus M., McElroy K.A., Alm E.J. Metrics to relate COVID-19 wastewater data to clinical testing dynamics. Water Res. 2022:118070. doi: 10.1016/j.watres.2022.118070. [DOI] [PMC free article] [PubMed] [Google Scholar]
- Ye Y., Ellenberg R.M., Graham K.E., Wigginton K.R. Survivability, partitioning, and recovery of enveloped viruses in untreated municipal wastewater. Environ. Sci. Technol. 2016;50(10):5077–5085. doi: 10.1021/acs.est.6b00876. [DOI] [PubMed] [Google Scholar]
- Zhang T., Breitbart M., Lee W.H., Run J.Q., Wei C.L., Soh S.W.L., Hibberd M.L., Liu E.T., Rohwer F., Ruan Y. RNA viral community in human feces: prevalence of plant pathogenic viruses. PLoS Biol. 2006;4(1) doi: 10.1371/journal.pbio.0040003. [DOI] [PMC free article] [PubMed] [Google Scholar]
- Zhang Y., Cen M., Hu M., Du L., Hu W., Kim J.J., Dai N. Prevalence and persistent shedding of fecal SARS-CoV-2 RNA in patients with COVID-19 infection: a systematic review and meta-analysis. Clin. Transl. Gastroenterol. 2021;12(4):343. doi: 10.14309/ctg.0000000000000343. [DOI] [PMC free article] [PubMed] [Google Scholar]
- Zuccato E., Chiabrando C., Castiglioni S., Bagnati R., Fanelli R. Estimating community drug abuse by wastewater analysis. Environ. Health Perspect. 2008;116(8):1027–1032. doi: 10.1289/ehp.11022. [DOI] [PMC free article] [PubMed] [Google Scholar]
Associated Data
This section collects any data citations, data availability statements, or supplementary materials included in this article.