Abstract
Purpose
Metagenomic next-generation sequencing (mNGS) is a novel technique of pathogens detection that plays an increasingly important role in clinical practice. In this study, we explored the application value of mNGS in pulmonary infection combined with pleural effusion applied to samples of pleural effusion fluid.
Patients and Methods
We reviewed 80 cases of pulmonary infection with pleural effusion between August 2020 and October 2021. Among them, 40 patients were placed in the mNGS group and underwent both culture and mNGS testing; the patients in the control group were only subjected to culture test. The effectiveness of mNGS was evaluated for microbial composition and diagnostic accuracy in every pleural effusion specimen type.
Results
We found that the positive rate of mNGS was 70% (28/40). The comparison between mNGS and culture method resulted that the sensitivity was 100% (95% CI: 29.2–100%) and the specificity was 64.9% (95% CI: 47.5–79.8%). The positive predictive value of mNGS was 18.8% (95% CI, 13.0–26.3%), and the negative predictive value was 100%. The most commonly identified potential pathogens were bacteria, such as Streptococcus, Prevotella, Parvimonas, Porphyromonas and Gemella. The most detected fungal infection was Candida and Pneumocystis. A total of 11 patients were identified as mixed infection by mNGS. Treatment regimen adjustments were made according to mNGS results and the overall length of hospital stay in the mNGS group was shorter compared to that of the control group.
Conclusion
In this study, mNGS produced higher positive rates than the culture method in detecting pathogens in the pleural effusion specimens. The technology performed satisfactorily, providing more diagnostic evidence and reducing the length of hospital stay.
Keywords: metagenomic next-generation sequencing, pulmonary infection, pleural effusion, clinical application, evaluation
Introduction
Pleural effusion is a common clinical situation due to many different underlying diseases. Epidemiological studies from North America, Western Europe, and East Asia have shown that the incidence of pleural infection in the second decade of the 21st century is 6.7–9.9 cases per 100,000 population. The incidence of pleural infection nearly doubled from the first to the second decade of the 21st century.1–5 Pleural cavity infection is often secondary to pulmonary infection, and pleural effusion is present in 15% to 44% of hospitalized patients with pneumonia, in which 40% of patients are complicated with parapneumonic effusion or empyema.6,7 Due to the differences in geographical locations and infection settings, the pathogenic microorganisms are very different.8 Precise identification and diagnosis of pathogens is essential, as the treatment and prognosis of pleural effusion largely depend on it.9 A delayed etiological diagnosis can cause the patient to develop a pulmonary empyema on the basis of pleural effusion, which is associated with significantly higher morbidity and mortality.10
A variety of conventional microbiological tests, such as microscopic examination, culture, PCR, nucleic acid hybridization and drug sensitivity, can help identify the pathogen. However, the diagnostic merit of these methods remains limited because pathogens are undetected in 25% to 60% of infectious diseases.11–15 The conventional culture methods produce poor positive rates, are time-consuming, and limited to fungal and bacterial detections only. Other methods like PCR and immunology techniques are restricted to a limited number of suspected microorganisms. Therefore, faster, more sensitive, and comprehensive pathogenic diagnosis methods are very much needed clinically.
mNGS is a novel method for rapid and sensitive pathogen detections.16,17 It is capable of detecting multiple pathogens simultaneously without bias and can identify rare or unexpected pathogens.18,19 The mNGS assay has been used to identify pathogens from various infectious diseases in different body parts.17 In terms of respiratory infections, successive sampling of sputum, pharyngeal swabs, bronchoalveolar lavage fluid (BALF), blood, pleural fluids, and lung tissue.20,21 Multiple studies have demonstrated higher detection rates and less time-consuming for mNGS compared to traditional pathogen detection methods, and mNGS is less commonly affected by prior antibiotic exposures.18,22–26
Applications to pleural effusion have not been sufficiently evaluated. For pulmonary infection patients with pleural effusion, the pathogen characteristics of pleural effusion are of great significance for the treatment. Therefore, this specific patient population was chosen in the study to assess the diagnostic value of mNGS.
Materials and Methods
Patients and Sample Collection
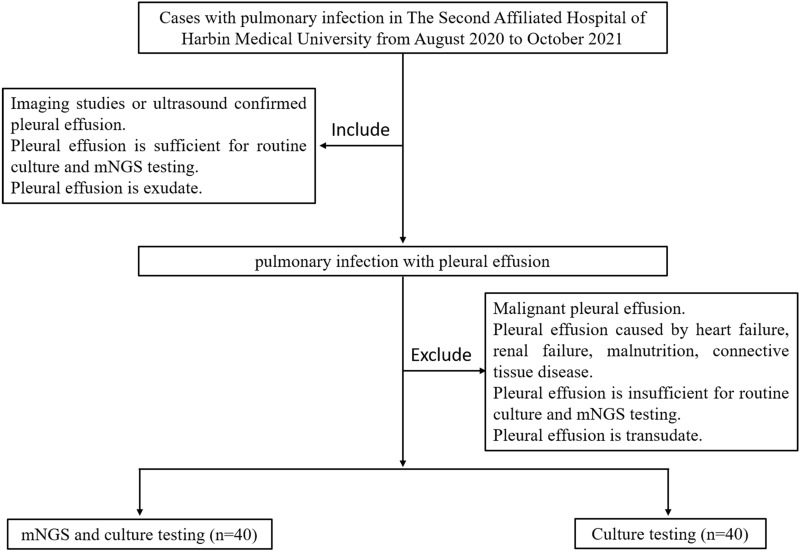
This study was a retrospective cohort study. We reviewed 80 pulmonary infection patients with pleural effusion from the Department of Respiratory, The Second Affiliated Hospital of Harbin Medical University from August 2020 to October 2021 by querying a hospital-based electronic medical record system (Figure 1). Patients included in this study confirmed that their pleural fluid volume was moderate (ie, 500 mL) or above by ultrasound. Patients who did not take the mNGS test were placed in the control group, and patients who took the test were placed in the mNGS group. All patients had taken the culture test. Thoracentesis or closed chest drainage was performed by experienced clinicians to obtain pleural effusion specimens. 5 mL of pleural effusion was used for mNGS detection, and 20 mL for traditional culture.
Figure 1.
Flow diagram of cases inclusion and exclusion.
Culture of Pleural Effusion
First, the skin was disinfected. Sample collection was then performed by clinicians strictly according to the principle of “asepsis”. A total of 20 mL of pleural effusion (10 mL for the aerobic and 10 mL for the anaerobic bottle) was drawn for one set of routine culture testing. The pleural fluid samples were sent to the laboratory immediately after collection at room temperature. Aerobic and anaerobic pleural effusion cultures were incubated using the BD BactecTM FX400 detection system, according to the manufacturer’s instructions. Finally, the positive pleural effusion cultures were sub-cultured, and the microorganisms were identified by standard methods, and susceptibility testing was performed by disc diffusion methods. The duration of the culture was 5 days.
mNGS Procedure for Pleural Fluid Samples
Pleural fluid sample was collected by standard procedures. DNA was extracted using the Tiangen Magnetic DNA Kit (Tiangen). DNA libraries were constructed through DNA-fragmentation, end-repair, add A-tailing, adapter-ligation and PCR amplification, and were performed using the NEB Next® Ultra™ DNA Library Prep Kit for Illumina®. The quality of the library was detected by the Agilent 2100 bioanalyzer. The concentration of the library was detected by Qubit 2.0. The qualified libraries were sequenced using Illumina Next-seq platform. To control the contamination of each sequencing run, we added a negative control to each run. The above sequencing process was completed by Genoxor Medical Science and Technology Inc.
The raw data was split using bcl2fastq2, and the adaptor sequences and low-quality base sequences were removed using Trimmomatic software to obtain high-quality, effective data. Human host sequences were removed using bowtie2 calibration software. Eventually, sequences that could not be mapped to the human genome were retained for alignment with the microbial genome database. The pathogenic microorganism database is constructed by screening standard microbial nucleic acid sequences in public databases. It covers 16834 common clinical pathogenic microorganisms, including 7982 bacteria, 917 fungi, 7811 virus, and 124 parasites. In order to compare different samples and species within the same sample, the number of reads was normalized by the length of the species genome to calculate their “Reads Per Kilobase (RPK).” The relative abundance of the species was further calculated based on RPK.
Results Interpretation
The microbial list obtained from the above analysis process was compared to negative controls and in-house background database, removing common background microorganisms in clinical and testing laboratories. The detection list is obtained after filtering through the threshold criterion, and the thresholds were set as the number of reads stringently mapped to the species of bacterium, mycoplasma, chlamydia, DNA virus or fungus ≥3, and Mycobacterium tuberculosis complex (MTC) ≥1. The mNGS analysis takes 24 h to complete and generate interpretable results. Finally, two or more associate chief physicians determined the final diagnosis about the causative agents by referring to the content of the sequencing reports, such as the number of unique reads, relative abundance, information of sequenced samples, and the microbial genome size, comprehensively querying microbial pathogenicity, and combining with the clinical characteristics and examination results of the patients.
Statistical Analysis
Continuous variants were described by means when they conformed to the normal distribution and by medians when not, and the categorical data were expressed as numbers. In accordance with the extracted data, 2 × 2 contingency tables were established to calculate sensitivity, specificity, positive predictive value (PPV), and negative predictive value (NPV). Fisher’s exact test, chi-squared test, and the Mann–Whitney U-test were used to compare variables. Statistical analyses and figures were conducted using the SPSS statistical package 25.0 software and GraphPad Prism 7 software. P values <0.05 were considered for significant differences, and all tests were two-tailed.
Results
Baseline Characteristics of Patients
A total of 80 patients diagnosed with pulmonary infection combined with pleural effusions were divided into the control group (40 patients) and the mNGS group (40 patients). Patients in the two groups were not significantly different in age, gender, basic disease, or laboratory test results (Table 1). All 80 patients were analyzed using culture test. Patients in the mNGS group underwent additional mNGS testing.
Table 1.
Baseline Characteristics of Participants
| Characteristics | mNGS Detection (n = 40) | Control (n = 40) | P value |
|---|---|---|---|
| Age, year (range) | 49.75 (20.00–86.00) | 55.52 (24.00–80.00) | 0.087 |
| Gender (n) | 0.576 | ||
| Male | 33 | 31 | |
| Female | 7 | 9 | |
| Smoke history (n) | 23 | 28 | 0.245 |
| Primary diseases (n) | |||
| Diabetes | 3 | 4 | 0.692 |
| Cardiovascular disease | 6 | 8 | 0.556 |
| Digestive system diseases | 4 | 4 | 1.000 |
| Renal system diseases | 2 | 2 | 1.000 |
| Cerebrovascular diseases | 3 | 4 | 0.692 |
| Respiratory diseases | 3 | 3 | 1.000 |
| Fever (n) | 22 | 20 | 0.654 |
| WBC, *109/L | 12.13 (4.20–39.75) | 9.24 (3.40–21.50) | 0.086 |
| Neutrophil, % | 78.12 (52.50–96.20) | 74.95 (54.50–93.30) | 0.180 |
| D-dimer(μg/L) | 1352.64 (145.00–3150.00) | 1423.97 (79.90–7247.00) | 0.550 |
| Hypoproteinemia (n) | 9 | 14 | 0.217 |
| Empyema (n) | 7 | 5 | 0.531 |
| Location of pleural effusion (n) | 0.239 | ||
| Unilateral | 35 | 31 | |
| Bilateral | 5 | 9 |
Notes: Statistics: Chi-square for calculations of gender, smoke history, primary diseases, fever, hypoproteinemia, empyema, readmission and location of pleural effusion, Mann–Whitney test for comparisons in age, WBC, neutrophil and D-dimer.
Diagnostic Performance of mNGS and Culture
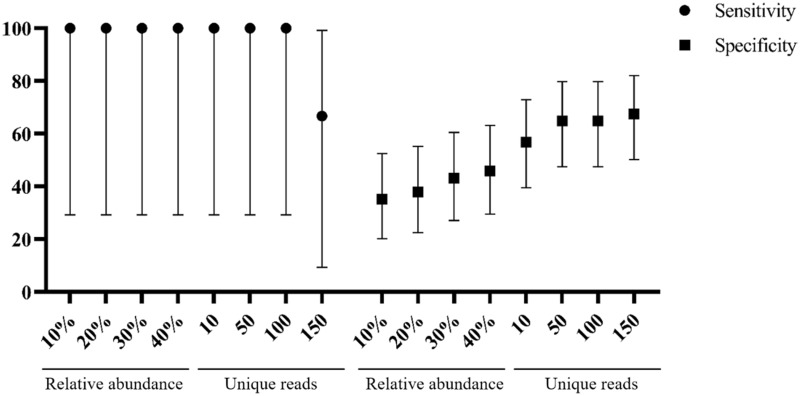
Twenty-eight samples from the test group were identified as potential pathogens for pulmonary infections by mNGS testing. mNGS provided a wide range of microbial profiles wherein the pathogens were otherwise difficult to identify. Setting to optimized thresholds, mNGS testing is specific enough to explain the contaminations apart from true infections. The best sensitivity of 100% (95% CI: 29.2–100%) and specificity of 64.9% (95% CI: 47.5–79.8%) were achieved at 50 unique reads threshold (Figure 2). The positive predictive value of mNGS was 18.8% (95% CI, 13.0–26.3%), and the negative predictive value was 100%. We also determined the 50 unique reads as the final threshold that maximized the sensitivity and specificity of mNGS for infection.
Figure 2.
Sensitivity and specificity with 95% confidence intervals were calculated under different threshold.
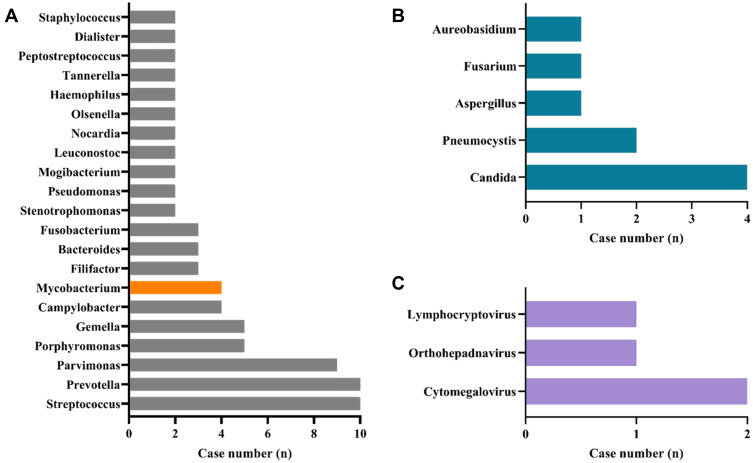
Three patients in the mNGS group had positive pleural effusion cultures. Streptococcus viridans, Streptococcus salivarius, and Candida albicans were detected. The pathogen detection results of mNGS showed that bacteria were the most commonly identified potential pathogens, with Streptococcus, Prevotella, Parvimonas, Porphyromonas and Gemella being the most prevalent (Figure 3). The sensitivity and specificity of diagnosing bacterial pulmonary infection by mNGS were 100.0% (95% CI: 29.2–100.0%) and 66.67% (95% CI: 48.2–82.0%), respectively. The most detected fungal species were Candida and Pneumocystis. Cytomegalovirus was the most common virus identified.
Figure 3.
Genus distribution of bacteria (A), fungi (B), and virus (C) detected by mNGS. Streptococcus and Prevotella, Candida, and Cytomegalovirus were the most commonly detected bacteria, fungi, and viruses, respectively.
Furthermore, 4 cases of Mycobacterium genus were detected by mNGS. None of the 4 patients had a medical history of pulmonary tuberculosis. Combined with the clinical characteristics of the patients, laboratory examinations, imaging findings, and the number of unique reads, relative abundance provided by the mNGS, the 4 patients were finally considered to be active infection and treated accordingly. All four patients’ conditions were improved after treatment.
Diagnostic Performance of mNGS in Mixed Infection
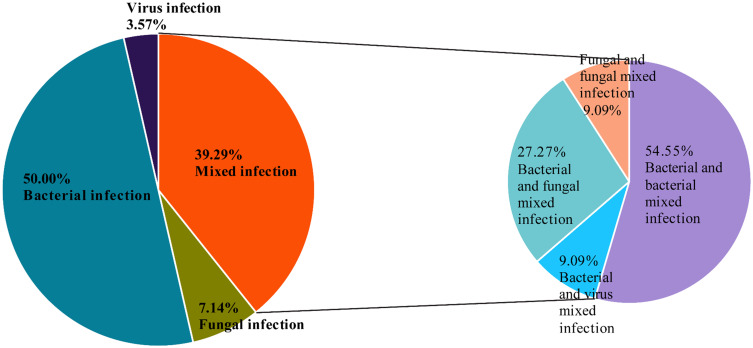
Among the patients who tested positive for mNGS, 11 patients (11/28 = 39.29%) were diagnosed with a mixed infection: two or more pathogens were identified in each case. The most common pattern of mixed infection was bacterial and bacterial mixed infection (6 patients, 6/11=54.55%), followed by bacterial and fungal mixed infection (3 patients, 3/11=27.27%). One patient was diagnosed with bacterial and viral mixed infection; one patient was diagnosed with fungal and fungal mixed infection (Figure 4).
Figure 4.
Percentage of patients with infections for various pathogens.
Correlative Analysis Between mNGS and Laboratory Results
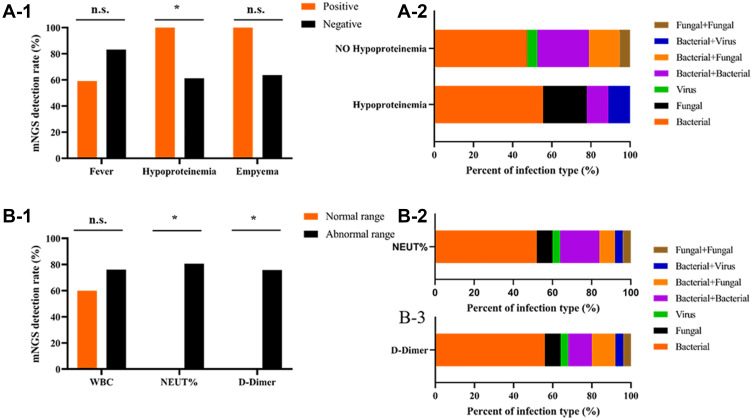
We assessed the baseline characteristics associated with mNGS detection rate and found that the hypoalbuminemia group had a significantly higher detection rate. Neither fever nor empyema affected the detection rate (Figure 5A-1). Compared to non-hypoalbuminemia patients, more hypoalbuminemia patients had fungal infections (Figure 5A-2). When the patient had abnormal neutrophil ratio and D-dimer value upon diagnosis, the detection rate of mNGS was higher than the normal group (The normal range: WBC (white blood cell) is 4–10 × 10^9/L, NEUT% (neutrophils%) is 50–70%, and D-dimer is 0–243 ng/mL) (Figure 5B-1). We also analyzed the distribution of different types of infection detected by mNGS in patients with abnormal neutrophil ratio and D-dimer value. We found that bacteria were the most common, followed by bacteria and bacteria mixed infections (Figure 5B-2 and 3).
Figure 5.
(A-1) The influence of Fever, Hypoproteinemia, Empyema on the detection rate of mNGS in pulmonary infections. Positive/negative represent case with/without these symptoms, respectively. Chi-squared Test. (A-2) Proportion of infection type of pulmonary infection with hypoproteinemia detected using mNGS. B-1The influence of WBC, NEUT% and D-dimeron the detection rate of mNGS in pulmonary infections. Chi-squared Test. (B-2) and (B-3) Proportion of infection type of pulmonary infection with abnormal level of NEUT% and D-dimer detected using mNGS. WBC, white blood cell; NEUT, neutrophil. * represents P values < 0.05.
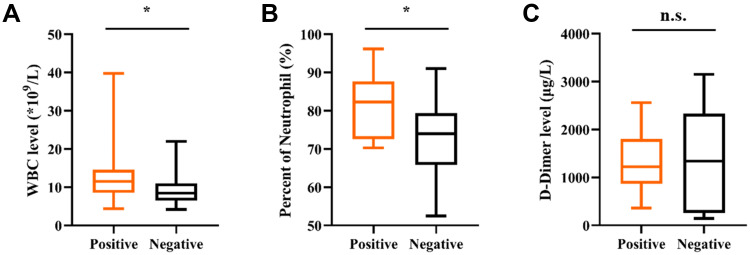
Based on the mNGS testing results, 40 patients were divided into a positive group (28 cases) and a negative group (12 cases). The laboratory results in different mNGS results group revealed that positive group had a significantly higher WBC and NEUT% (p < 0.05) (Figure 6A and B), while D-dimer value showed no significant differences between both groups (Figure 6C).
Figure 6.
The comparisons of WBC (A), neutrophil (B) and D-dimer(C) across mNGS groups. * Represents P values < 0.05.
Comparison of Outcomes Between mNGS and Control Groups
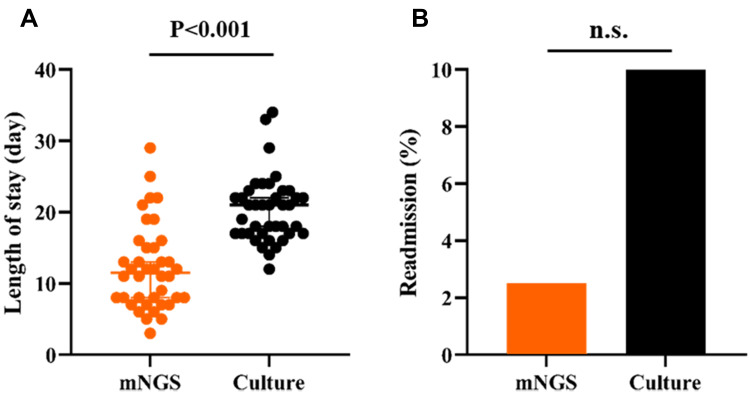
Patients in the mNGS group had a median of 11.5 hospital days (8.0–15.75 days), which is significantly reduced from 21 hospital days in the control group (17.00–22.75 days, p < 0.05) (Figure 7A). Considering readmissions, there were a total of 4 (10%) readmissions in the control group compared to 1 case (2.5%) in mNGS group. However, the readmission rates did not significantly differ among the 2 groups (Figure 7B).
Figure 7.
Length of stay (A) and readmission (B) comparison between mNGS and culture for pulmonary infection.
Discussion
In this study, all samples used for mNGS were pleural effusion from patients. There has been no systematic evaluation of the clinical application of mNGS in pleural effusion samples from pulmonary infection patients combined with pleural effusion. All the patients in this study had a medium volume of pleural fluid (ie, 500 mL) or above. Compared to the invasive operation of BALF, patients prefer to take pleural fluid as a sample for examination. Theoretically, the pleural effusion belongs to the normal sterile body fluid. Unlike sputum, BALF and other normal bacteria-bearing samples, pleural effusion can easily determine whether certain microorganisms are pathogens. For example, BALF is taken under bronchoscopy, which may contain different degrees of contaminating bacteria (including normal colonizing flora of the oropharynx, nasopharynx, and airway). However, pleural effusion is less likely to be contaminated with colonizing microorganisms during collection so the interferences from the sample contamination could be avoided to some extent.
The most frequently detected bacteria were Streptococcus, Prevotella, Parvimonas, Porphyromonas and Gemella. The most detected fungi were Candida and Pneumocystis, and the most detected virus was Cytomegalovirus. Some studies have shown that the most common pathogens of community acquired pneumonia are Streptococcus, followed by anaerobic bacteria and Staphylococcus.27–29 Nosocomial pneumonia is most often caused by Gram-negative bacilli and Staphylococcus, among which the percentage of methicillin-resistant Staphylococcus aureus (MRSA) is up to 25%, while the proportion of streptococcus is relatively low.27–29 The rate of pleural fungal infection has increased continuously in the recent years, and the most common fungi causing infection include Candida and Aspergillus.27–29 This is not inconsistent with our findings. According to patient’s history, clinical symptoms, laboratory findings and the imaging features, a large proportion of patients were eventually diagnosed with community-acquired pneumonia with pleural effusion in the patients enrolled with pulmonary infection and pleural effusion. Additionally, mNGS was found to be capable of detecting more potential pathogens, which were rare and difficult-to-cultivate pathogens, such as Nocardia, Pneumocystis and Mycobacterium tuberculosis.
It is worth mentioning that we have detected more anaerobes. Pleural cavity infections caused by anaerobic bacteria are often found in patients with poor oral hygiene and accidental inhalation infection.30 In our study, a total of 10 cases of Prevotella, 9 cases of Parvimonas and 5 cases of Porphyromonas were detected by mNGS. After reviewing the patient’s medical history and daily habits, we found that P2, P3, P14, P20, P26, P34, P35 and P36 in the mNGS group had oral health problems, and the daily brushing, washing and cleaning were poor. This study did not rule out that inhalation pulmonary infections caused by oral hygiene problems can lead to the production of pleural effusion, so we considered Prevotella, Parvimonas and Porphyromonas as possible pathogens in the above patients. Pleural cavity infection is generally considered to be the result of the migration of bacteria from the lung to the thoracic cavity. There are significant differences in oxygen content and pH (potential of hydrogen) between the thoracic cavity and lung so the bacterial spectrum of pleural infection is not exactly the same as that of pneumonia.31–33 The results showed that mNGS was useful for detection of pathogens in pleural effusion samples, which provided a new idea for our clinicians. We can further understand the distribution characteristics and trace the origin of pathogens in patients with pulmonary infection complicated by pleural effusion and provide a deeper understanding of antibiotic treatment in such patients.
Three patients from the mNGS group had positive pleural effusion cultures. Streptococcus viridans was detected by pleural effusion culture in patient P16. mNGS results showed that the Streptococcus genus was detected in the patient’s pleural effusion, and the number of reads was 68499 (where 32758, 213, 132 were the number of reads of Streptococcus intermedius, Streptococcus anginosus and Streptococcus mutans, respectively). Streptococcus viridans group (SVG), also known as α-hemolytic streptococcus, is an opportunistic pathogen with low pathogenicity.34 Facklam divided SVG into Streptococcus mutans, Streptococcus oralis, Streptococcus mitis, Streptococcus sanguinis, Streptococcus milleri, Streptococcus bovis, Streptococcus acidominimus, Streptococcus tuberculosis and Streptococcus uberis, among which Streptococcus milleri includes Streptococcus intermedius, Streptococcus anginosus and Streptococcus constellatus.35 The pleural effusion culture results revealed well-coincident results with mNGS results at the genus level. In addition, mNGS provided more specific identification at the species level. However, the results of the culture and mNGS of P3 and P5 were different. Streptococcus salivarius and Candida albicans were detected in pleural fluid of P3 and P5 by culture test, respectively. The mNGS results indicated that Prevotella, Bacteroides and Actinomyces were detected in the P3ʹs’ sample, and Mycobacterium tuberculosis were detected in the P5ʹs’ sample. The culture and mNGS results are inconsistent. Considering that pleural effusion samples for culture and mNGS were collected at different stages, the time of analysis may impact the result of pathogen detection. The inconsistency may well be the result of other factors: the number of pathogen sequences was below the threshold of detection, or contamination of microbial genomes in the environment or human flora. All things considered, these two patients were decided to be mixed infection, especially patient P5 who was highly immunocompromised. We tested this patient on T cell subsets and found that the numbers of CD8+ T lymphocytes and CD4 T+ lymphocytes were greatly reduced. Combined with the patient’s clinical characteristics, culture results and sequencing report, we finally determined this patient as mixed infection, and gave him both antifungal and antituberculosis treatment.
Pleural cavity infection process could be divided into three phases: (a) exudative phase, (b) fibrin exudation and pus formation, and (c) tissue formation. The first stage occurs when neutrophil activation causes vascular endothelial cell injury, increased capillary permeability and exudation increase to form pleural effusion. Importantly, the blood glucose level is normal at this stage and no pathogenic microorganisms can be detected. At the second stage, a variety of cytokines stimulate neutrophils and fibroblasts chemotaxis. The permeability of the cell membrane is further increased, bacteria enter the pleural cavity, and bacteria and related degradation products in the effusion can be detected. At the same time, fibrin decomposition is reduced, and fibrin is increased in the thoracic cavity. At the third stage of tissue formation, improper treatment can cause chronic pleural cavity infection.6,27,36–38 Consistent with our findings, the detection rate of mNGS in the group with abnormal neutrophil ratio and D-dimer value is higher than that in the normal group. The WBC and NEUT% levels were higher in mNGS positive patients than in negative patients. It is suggested that clinicians should choose the best sampling time based on the comprehensive judgment of the patients’ medical history, course of disease, and laboratory indicators (especially WBC, NEUT%, D-dimer) when using pleural effusion for culture or mNGS, so as to optimize the positive rate of pathogen detection.
Mixed infection refers to the discovery of two or more infectious pathogens by culture and/or mNGS testing of pleural effusion. Previous studies have shown that the sensitivity and specificity of mNGS in diagnosing mixed pulmonary infection were 97.2% (95% CI: 83.8–99.9%) and 63.2% (95% CI: 38.6–82.8%), respectively.39 In our study, the positive rate of mixed infection detected by mNGS was 39.3%. This may be related to the inclusion criteria of our research. The occurrence of mixed infections is related to the patient’s underlying disease state and immunodeficiency, while our study excluded the patients with pleural effusion caused by malignant tumor and systemic diseases, such as heart failure, renal failure, or connective tissue diseases. To a certain extent, patients with severe underlying diseases and poor immune function were excluded. Therefore, the detection rate of mixed infection in our patients was reduced to some degree. In our study, the most common pattern of mixed infection was bacterial and bacterial mixed infection, followed by bacterial and fungal mixed infection. Xie found that the most common co-infection was bacterial and fungal mixed infection, followed by bacterial and bacterial infection.40 Wang found that the most common mixed pulmonary infection was virus and fungal mixed infection.39 Legoff found that the most common mixed infection was bacterial and viral mixed infection.41 These inconsistent results may be related to the condition of patients and different detection samples. Our hospital is located in Northern China, where the air is dry and cold, which is not conducive to the survival of fungi, and also affects the risk of fungal infection to a certain extent. In addition, all patients in the mNGS group were tested for DNA, and only 5 patients were tested for DNA and RNA, which limited the detection of RNA viruses, so the detection rate of viruses was also low.
Hypoproteinemia may be associated with the occurrence of pulmonary infection. It is also one of the risk factors for pulmonary fungal infection.42–44 Consistent with our findings, the positive rate of mNGS detection in patients with hypoalbuminemia was higher than that in patients without hypoalbuminemia in the mNGS group. More fungal infections were found in a subgroup of patients with hypoalbuminemia. It also suggests that clinicians should correct hypoalbuminemia timely when treating patients with pulmonary infection complicated by pleural effusion.
Compared to the control group, the length of hospital stay was shorter in the mNGS group, while the readmission rate was not significantly different. With the mNGS pathogen profiling results, the clinicians were able to choose antibiotics with better precision. A total of 13 patients changed the medication after mNGS results arrived, and they responded well to the adjusted treatments. While in the control group, due to the low positive rate of pleural effusion culture, 82.5% of the patients could not identify the pathogen. Therefore, the antibiotic treatment of the patients in the control group was the empirical medication of the clinician, and the treatment was not accurate enough, which prolonged the hospitalization time. This further substantiates that mNGS method will bring significant benefits for the treatment of infectious patients, including avoiding inappropriate therapy and antibiotic resistance, shortening hospital lengths of stay, and reducing the cost of treatment.
Limitations
First of all, the number of included patients is limited and the sample size is small, we need to expand it in future studies. Secondly, there is currently a lack of recognized standards for interpreting sequencing results. In our study, an expert group formed by two or more associate chief physicians determined the final interpretation based on the clinical characteristics of patients, which was subjective to a certain extent and resulted in limitations of this study. Thirdly, in our study, only pleural fluid samples were tested by mNGS, and the lack of other sample controls (such as BALF, sputum, throat swabs). For patients with pulmonary infection complicated with pleural effusion, multiple samples should be added for comparison to further explore the best samples. Finally, compared to the culture test, mNGS is expensive and has not yet been included in the medical insurance, which limits the promotion and use of mNGS in clinical practice to some extent.
Conclusion
This study demonstrated that in patients with pulmonary infection complicated with pleural effusion, mNGS had an overall superior detection rate of potential pathogens to culture methods, especially rare and difficult-to-culture pathogens. mNGS is a powerful tool for the detection of mixed infections, and the most common combinations were bacterial–bacterial coinfection. And we found bacterial infections were most common, followed by bacteria–bacteria coinfections in patients with abnormal neutrophil ratio and D-dimer value. We also found that the median duration of hospital stay was shorter in the mNGS group than in the control group. The mNGS test results of pleural effusion samples, combined with the patient’s underlying disease state and laboratory indicators, grant the clinicians with a deeper understanding of the pathogenic microorganisms in patients with pulmonary infection complicated with pleural effusion.
Acknowledgments
The author highly acknowledges the contribution of all the associated personnel who contributed to the completion of this study.
Funding Statement
This study was supported by the funds from the National Natural Science Foundation of China (NO. 81700021) and was supported by funds from Wu Jieping Medical Foundation (NO.320.6750.18493).
Abbreviations
mNGS, metagenomic next-generation sequencing; PCR, polymerase chain reaction; MTC, Mycobacterium tuberculosis complex; PPV, positive predictive value; NPV, negative predictive value; WBC, white blood cell; MRSA, methicillin-resistant Staphylococcus aureus; NEUT%, neutrophils%; BALF, bronchoalveolar lavage fluid; SVG, Streptococcus viridans group; RPK, reads per kilobase; pH (potential of hydrogen).
Data Sharing Statement
Data that support this study are available from the NCBI database. The accession number is PRJNA788173.
Ethics Statement
This is a retrospective study. Approval from the Ethics Committee of the Second Affiliated Hospital of Harbin Medical University was obtained, and the Ethics Committee had agreed with the request for waiver of informed consent. The Declaration of Helsinki was adhered to throughout the study. The IRB approval number for this study is KY2022-083.
Author Contributions
All authors made a significant contribution to the work reported, whether that is in the conception, study design, execution, acquisition of data, analysis and interpretation, or in all these areas; took part in drafting, revising or critically reviewing the article; gave final approval of the version to be published; have agreed on the journal to which the article has been submitted; and agree to be accountable for all aspects of the work.
Disclosure
The authors declare no conflicts of interest.
References
- 1.Nayak R, Brogly SB, Lajkosz K, et al. Two decades of thoracic empyema in Ontario, Canada. Chest. 2020;157:1114–1116. doi: 10.1016/j.chest.2019.11.040 [DOI] [PubMed] [Google Scholar]
- 2.Grijalva CG, Zhu Y, Nuorti JP, et al. Emergence of parapneumonic empyema in the USA. Thorax. 2011;66:663–668. doi: 10.1136/thx.2010.156406 [DOI] [PMC free article] [PubMed] [Google Scholar]
- 3.Bobbio A, Bouam S, Frenkiel J, et al. Epidemiology and prognostic factors of pleural empyema. Thorax. 2021;76:1117–1123. doi: 10.1136/thoraxjnl-2020-215267 [DOI] [PubMed] [Google Scholar]
- 4.Lehtomäki A, Nevalainen R, Ukkonen M, et al. Trends in the incidence, etiology, treatment, and outcomes of pleural infections in adults over a decade in a Finnish University Hospital. Scand J Surg. 2020;109:127–132. doi: 10.1177/1457496919832146 [DOI] [PubMed] [Google Scholar]
- 5.Shen HN, Lu CL, Li CY. Epidemiology of pleural infections in Taiwan from 1997 through 2008. Respirology. 2012;17:1086–1093. doi: 10.1111/j.1440-1843.2012.02214.x [DOI] [PubMed] [Google Scholar]
- 6.Dean NC, Griffith PP, Sorensen JS, et al. Pleural effusions at first ED encounter predict worse clinical outcomes in patients with pneumonia. Chest. 2016;149:1509–1515. doi: 10.1016/j.chest.2015.12.027 [DOI] [PMC free article] [PubMed] [Google Scholar]
- 7.Chalmers JD, Singanayagam A, Murray MP, et al. Risk factors for complicated parapneumonic effusion and empyema on presentation to hospital with community-acquired pneumonia. Thorax. 2009;64:592–597. doi: 10.1136/thx.2008.105080 [DOI] [PubMed] [Google Scholar]
- 8.Hassan M, Cargill T, Harriss E, et al. The microbiology of pleural infection in adults: a systematic review. Eur Respir J. 2019;54:1900542. doi: 10.1183/13993003.00542-2019 [DOI] [PubMed] [Google Scholar]
- 9.Sziklavari Z, Graml JI, Zeman F, et al. [Outcomes of stage-adapted surgical treatment of pleural empyema]. Zentralbl Chir. 2016;141:335–340. German. doi: 10.1055/s-0041-109703 [DOI] [PubMed] [Google Scholar]
- 10.Jany B, Welte T. Pleural effusion in adults-etiology, diagnosis, and treatment. Dtsch Arztebl Int. 2019;116:377–386. doi: 10.3238/arztebl.2019.0377 [DOI] [PMC free article] [PubMed] [Google Scholar]
- 11.Glaser CA, Honarmand S, Anderson LJ, et al. Beyond viruses: clinical profiles and etiologies associated with encephalitis. Clin Infect Dis. 2006;43:1565–1577. doi: 10.1086/509330 [DOI] [PubMed] [Google Scholar]
- 12.Zhou G, Zhou Y, Zhong C, et al. Retrospective analysis of 1641 cases of classic fever of unknown origin. Ann Transl Med. 2020;8:690. doi: 10.21037/atm-20-3875 [DOI] [PMC free article] [PubMed] [Google Scholar]
- 13.Fenollar F, Raoult D. Molecular diagnosis of bloodstream infections caused by non-cultivable bacteria. Int J Antimicrob Agents. 2007;30:S7–15. doi: 10.1016/j.ijantimicag.2007.06.024 [DOI] [PubMed] [Google Scholar]
- 14.Tattevin P, Watt G, Revest M, et al. Update on blood culture-negative endocarditis. Med Mal Infect. 2015;45:1–8. doi: 10.1016/j.medmal.2014.11.003 [DOI] [PubMed] [Google Scholar]
- 15.Pallen MJ. Diagnostic metagenomics: potential applications to bacterial, viral and parasitic infections. Parasitology. 2014;141:1856–1862. doi: 10.1017/S0031182014000134 [DOI] [PMC free article] [PubMed] [Google Scholar]
- 16.Han D, Li Z, Li R, et al. mNGS in clinical microbiology laboratories: on the road to maturity. Crit Rev Microbiol. 2019;45:668–685. doi: 10.1080/1040841X.2019.1681933 [DOI] [PubMed] [Google Scholar]
- 17.Simner PJ, Miller S, Carroll KC. Understanding the promises and hurdles of metagenomic next-generation sequencing as a diagnostic tool for infectious diseases. Clin Infect Dis. 2018;66:778–788. doi: 10.1093/cid/cix881 [DOI] [PMC free article] [PubMed] [Google Scholar]
- 18.Miao Q, Ma Y, Wang Q, et al. Microbiological diagnostic performance of metagenomic next-generation sequencing when applied to clinical practice. Clin Infect Dis. 2018;67:S231–S240. doi: 10.1093/cid/ciy693 [DOI] [PubMed] [Google Scholar]
- 19.Goldberg B, Sichtig H, Geyer C, et al. Making the leap from research laboratory to clinic: challenges and opportunities for next-generation sequencing in infectious disease diagnostics. mBio. 2015;6:e01888–15. doi: 10.1128/mBio.01888-15 [DOI] [PMC free article] [PubMed] [Google Scholar]
- 20.Li N, Cai Q, Miao Q, et al. High-throughput metagenomics for identification of pathogens in the clinical settings. Small Methods. 2021;5:2000792. doi: 10.1002/smtd.202000792 [DOI] [PMC free article] [PubMed] [Google Scholar]
- 21.Filkins LM, Bryson AL, Miller SA, et al. Navigating clinical utilization of direct-from-specimen metagenomic pathogen detection: clinical applications, limitations, and testing recommendations. Clin Chem. 2020;66:1381–1395. doi: 10.1093/clinchem/hvaa183 [DOI] [PubMed] [Google Scholar]
- 22.Zhang HC, Ai JW, Cui P, et al. Incremental value of metagenomic next generation sequencing for the diagnosis of suspected focal infection in adults. J Infect. 2019;79:419–425. doi: 10.1016/j.jinf.2019.08.012 [DOI] [PubMed] [Google Scholar]
- 23.Zhang XX, Guo LY, Liu LL, et al. The diagnostic value of metagenomic next-generation sequencing for identifying Streptococcus pneumoniae in paediatric bacterial meningitis. BMC Infect Dis. 2019;19:495. doi: 10.1186/s12879-019-4132-y [DOI] [PMC free article] [PubMed] [Google Scholar]
- 24.van Rijn AL, van Boheemen S, Sidorov I, et al. The respiratory virome and exacerbations in patients with chronic obstructive pulmonary disease. PLoS One. 2019;14:e0223952. doi: 10.1371/journal.pone.0223952 [DOI] [PMC free article] [PubMed] [Google Scholar]
- 25.Li G, Huang J, Li Y, et al. The value of combined radial endobronchial ultrasound-guided transbronchial lung biopsy and metagenomic next-generation sequencing for peripheral pulmonary infectious lesions. Can Respir J. 2020;2020:2367505. doi: 10.1155/2020/2367505 [DOI] [PMC free article] [PubMed] [Google Scholar]
- 26.Huang J, Jiang E, Yang D, et al. Metagenomic next-generation sequencing versus traditional pathogen detection in the diagnosis of peripheral pulmonary infectious lesions. Infect Drug Resist. 2020;13:567–576. doi: 10.2147/IDR.S235182 [DOI] [PMC free article] [PubMed] [Google Scholar]
- 27.Yang W, Zhang B, Zhang ZM. Infectious pleural effusion status and treatment progress. J Thorac Dis. 2017;9:4690–4699. doi: 10.21037/jtd.2017.10.96 [DOI] [PMC free article] [PubMed] [Google Scholar]
- 28.Birkenkamp K, O’Horo JC, Kashyap R, et al. Empyema management: a cohort study evaluating antimicrobial therapy. J Infect. 2016;72:537–543. doi: 10.1016/j.jinf.2016.02.009 [DOI] [PubMed] [Google Scholar]
- 29.Krenke K, Urbankowska E, Urbankowski T, et al. Clinical characteristics of 323 children with parapneumonic pleural effusion and pleural empyema due to community acquired pneumonia. J Infect Chemother. 2016;22:292–297. doi: 10.1016/j.jiac.2016.01.016 [DOI] [PubMed] [Google Scholar]
- 30.Meyer CN, Rosenlund S, Nielsen J, et al. Bacteriological aetiology and antimicrobial treatment of pleural empyema. Scand J Infect Dis. 2011;43:165–169. doi: 10.3109/00365548.2010.536162 [DOI] [PubMed] [Google Scholar]
- 31.Rahman NM, Maskell NA, West A, et al. Intrapleural use of tissue plasminogen activator and DNase in pleural infection. N Engl J Med. 2011;365:518–526. doi: 10.1056/NEJMoa1012740 [DOI] [PubMed] [Google Scholar]
- 32.Burgos J, Lujan M, Falcó V, et al. The spectrum of pneumococcal empyema in adults in the early 21st century. Clin Infect Dis. 2011;53:254–261. doi: 10.1093/cid/cir354 [DOI] [PubMed] [Google Scholar]
- 33.Maskell NA, Batt S, Hedley EL, et al. The bacteriology of pleural infection by genetic and standard methods and its mortality significance. Am J Respir Crit Care Med. 2006;174:817–823. doi: 10.1164/rccm.200601-074OC [DOI] [PubMed] [Google Scholar]
- 34.Walls G, McBride S, Raymond N, et al. Infective endocarditis in New Zealand: data from the international collaboration on endocarditis prospective cohort study. N Z Med J. 2014;127:38–51. [PubMed] [Google Scholar]
- 35.Facklam RR. Physiological differentiation of viridans streptococci. J Clin Microbiol. 1977;5:184–201. doi: 10.1128/jcm.5.2.184-201.1977 [DOI] [PMC free article] [PubMed] [Google Scholar]
- 36.Porcel JM. Pleural fluid tests to identify complicated parapneumonic effusions. Curr Opin Pulm Med. 2010;16:357–361. doi: 10.1097/MCP.0b013e328338a108 [DOI] [PubMed] [Google Scholar]
- 37.Idell S. The pathogenesis of pleural space loculation and fibrosis. Curr Opin Pulm Med. 2008;14:310–315. doi: 10.1097/MCP.0b013e3282fd0d9b [DOI] [PubMed] [Google Scholar]
- 38.Psallidas I, Corcoran JP, Rahman NM. Management of parapneumonic effusions and empyema. Semin Respir Crit Care Med. 2014;35:715–722. doi: 10.1055/s-0034-1395503 [DOI] [PubMed] [Google Scholar]
- 39.Wang J, Han Y, Feng J. Metagenomic next-generation sequencing for mixed pulmonary infection diagnosis. BMC Pulm Med. 2019;19:252. doi: 10.1186/s12890-019-1022-4 [DOI] [PMC free article] [PubMed] [Google Scholar]
- 40.Xie G, Zhao B, Wang X, et al. Exploring the clinical utility of metagenomic next-generation sequencing in the diagnosis of pulmonary infection. Infect Dis Ther. 2021;10:1419–1435. doi: 10.1007/s40121-021-00476-w [DOI] [PMC free article] [PubMed] [Google Scholar]
- 41.Legoff J, Zucman N, Lemiale V, et al. Clinical significance of upper airway virus detection in critically ill hematology patients. Am J Respir Crit Care Med. 2019;199:518–528. doi: 10.1164/rccm.201804-0681OC [DOI] [PubMed] [Google Scholar]
- 42.Li F, Yuan MZ, Wang L, et al. Characteristics and prognosis of pulmonary infection in patients with neurologic disease and hypoproteinemia. Expert Rev Anti Infect Ther. 2015;13:521–526. doi: 10.1586/14787210.2015.1019471 [DOI] [PubMed] [Google Scholar]
- 43.Xu S, Du B, Shan A, et al. The risk factors for the postoperative pulmonary infection in patients with hypertensive cerebral hemorrhage: a retrospective analysis. Medicine. 2020;99:e23544. doi: 10.1097/MD.0000000000023544 [DOI] [PMC free article] [PubMed] [Google Scholar]
- 44.Wang J, Zu Q, Wang W. Analysis of factors of pulmonary fungal infection in mice in respiratory medicine department based on logistic regression analysis model and Progranulin. Saudi J Biol Sci. 2020;27:629–635. doi: 10.1016/j.sjbs.2019.12.001 [DOI] [PMC free article] [PubMed] [Google Scholar]


