

Abstract
Using network analysis, we estimated the structure of relations among manic and depressive symptoms, respectively, in 486 patients (59% women; age: M = 37, SD = 12.1) with bipolar disorder prior to their entering a clinical trial. We computed three types of networks: (a) Gaussian graphical models (GGMs) depicting regularized partial correlations, (b) regression-based GGMs depicting non-regularized partial correlations, and (c) directed acyclic graphs (DAGs) via a Bayesian hill-climbing algorithm. Low energy and elevated energy were consistently identified as central nodes in the GGMs and as key parent nodes in the DAGs. Across analyses, pessimism about the future and depressed mood were the symptoms most strongly associated with suicidal thoughts and behavior. These exploratory analyses provide rich information about how bipolar disorder symptoms relate to one another, thereby furnishing a foundation for investigating how bipolar disorder symptoms may operate as a causal system.
Keywords: network analysis, directed acyclic graph, Bayesian networks, bipolar disorder, Gaussian graphical models
General Scientific Summary
Using three network analytic methods, we estimated the symptom structure of depression and mania, respectively, in patients with bipolar disorder. Our findings identify energy dysregulation as a potentially important feature of this mood disorder.
The neo-Kraepelinian tradition conceptualizes mental disorders as discrete underlying disease entities that function as the common cause of symptom emergence and co-occurrence (e.g., Guze, 1992; Klerman, 1978). Hence, observable signs and reportable symptoms reflect the presence of their latent, common cause. Embodied in our diagnostic manuals ever since the third edition (American Psychiatric Association [APA], 1980), this tradition inspired an immense amount of research on the epidemiology, etiology, and treatment of mental disorders. Yet failure to identify biomarkers of discrete disease entities prompted the primary authors of the most recent manual to announce that “We are now coming to the end of the neo-Kraepelinian era” (Regier et al., 2013, p. 68). Indeed, the origins of psychopathology seem massively multifactorial (Kendler, 2012), and far more complicated than many of us had suspected.
The psychometrician Borsboom (2008) identified an additional difficulty with the reflective, common cause model: to justify inference to a latent disease entity as the common cause of symptom covariance, one must satisfy the axiom of local independence. That is, solely attributing symptom co-occurrence to an underlying common cause precludes causal connections among the symptoms themselves. Yet such direct connections abound in psychopathology (e.g., insomnia causes fatigue; appetite loss causes weight loss; obsessions cause compulsions). Accordingly, Borsboom (2008) conjectured that the relation of disorder to symptoms appears mereological (i.e., whole to parts) rather than the disorder causing its symptoms. An episode of mental disorder is an emergent phenomenon arising from the causal interactions among its constituent signs and symptoms (e.g., Borsboom, 2017; Borsboom & Cramer, 2013; Cramer et al., 2010). Psychiatric disorders seldom function like an undetected malignant lung tumor causing chest pain, bloody sputum, and dyspnea (Borsboom & Cramer, 2013).
This perspective has inspired a nascent methodology, dubbed “network psychometrics” (Epskamp et al., 2018b, p. 953) to estimate and visualize the strength of associations among symptoms (e.g., Epskamp et al., 2012). Consequently, a surge of network analytic studies on diverse mental disorders has emerged (For a review, see Robinaugh et al., 2020b).
Most studies in network psychometrics have estimated Gaussian graphical models in which the nodes represent symptoms and the edges connecting these nodes represent the strength of association between pairs of symptoms after adjusting statistically for all other symptoms in the network (Fried et al., 2017). The presence of an edge between two nodes signifies their statistical dependence upon one another, conditional on the remaining symptoms. Conversely, the absence of an edge between two symptoms implies their conditional independence. These cross-sectional network analyses provide a snapshot of the strength of association between symptom pairs computed over a group of participants. They often reassuringly confirm associations known to clinicians, such as between flashbacks and intrusive thoughts in trauma survivors, while also disclosing less obvious ones, such as between difficulty concentrating and anger (McNally et al., 2015). However, these cross-sectional networks are undirected, providing no information about the direction of the relation between a pair of connected symptoms.
Bayesian network analysis provides a complementary approach (Jones et al., 2018; McNally et al., 2017a; McNally et al., 2017b), characterizing symptoms as a potentially causal system. These cross-sectional, directed acyclic graphs (DAGs) possess arrowheads signifying direction of prediction between connected symptoms, but prohibit cycles among symptoms such as X -> Y -> X, or X -> Y -> Z -> X (Pearl, 2011; Pearl & Mackenzie, 2018).
Although cross-sectional DAGs cannot confirm temporal precedence, they can disclose directional dependence relations in which the presence of a given node (i.e., a “descendant”) more strongly implies the presence of another node (i.e., the “parent”) than vice versa. In other words, a parent node may often be present without its descendant, but the presence of the descendant implies the presence of the parent. To illustrate, consider a homicide investigation. Because a murder suspect may have donned gloves before committing the crime, firing the murder weapon (a parent node) does not strongly imply the presence of gunpowder residue on the suspect’s hand (a descendant node). However, if present, gunpowder residue would strongly imply that he has fired a pistol within the previous 3–4 hours. By estimating directional dependence relations, DAGs have the potential of suggesting causal relations between symptoms.
In sum, the two network approaches complement one another. Just as the mean and the median constitute two different ways of characterizing central tendency, so do partial correlation networks and DAGs constitute two perspectives for modeling the relations among symptoms of mental disorder. In this exploratory study, we used these methods to investigate the relations among symptoms of bipolar disorder.
Major depression is the most studied disorder in the network literature (e.g., Cramer et al. 2012; Cramer et al., 2016; Robinaugh et al., 2020b). However, network studies of bipolar disorder symptoms are scarce (Koenders et al., 2015; Weintraub et al., 2020). In the first such study, Koenders et al. (2015) separated 125 bipolar patients into groups on the basis of their course of illness (minimally impaired, cycling, and depressed) and found that those in the cycling group had an especially dense symptom network, signifying high probability of co-occurrence among symptoms. In the second, Weintraub et al. (2020) examined a treatment-seeking sample of adolescents (n = 272) with at least subsyndromic manic, hypomanic, or depressive symptoms and found two major communities of symptoms - manic and depressive - with irritability and mood lability as symptoms “bridging” the two clusters. Notably, symptoms relevant to energy – both high (e.g., motor hyperactivity) and low (e.g., fatigue) – were highly “central” in the network for those with a bipolar spectrum disorder, exhibiting strong associations with other symptoms in the network.
In the current exploratory study of treatment-seeking adults with bipolar disorder, we used both regularized (and non-regularized) partial correlation and Bayesian network analytic methods to estimate and visualize the relations among symptoms of bipolar disorder. Following the 5th edition of the Diagnostic and Statistical Manual of Mental Disorders (DSM-5; APA, 2013), we distinguished symptoms of depression from those of mania, and computed separate networks for each cluster (networks including both symptoms of depression and mania appear in Supplement C). To characterize the position and potential importance of each symptom in their respective networks, we also estimated the centrality of each symptom in the partial correlation networks (Borgatti, 2005) and identified parent symptoms in the Bayesian networks (i.e., those symptoms whose activation the emergence of other descendant symptoms tended to depend).
Method
Participants
We used archival baseline data from 486 treatment-seeking patients with a diagnosis of either bipolar I (n = 333, 68.5%) or bipolar II disorder (n = 153, 31.5%) who participated in Bipolar CHOICE (Clinical and Health Outcomes Initiative in Comparative Effectiveness), a randomized pragmatic trial at six sites (Nierenberg et al., 2014). Diagnoses were made by a licensed psychiatrist who conducted the clinical diagnostic interviews. Patients ranged from 18 to 67 years of age (M = 39.0, SD = 12.1). There were 201 men (41%) and 285 women (59%).
Upon enrolling in the CHOICE trial, patients were in the following states, according to the diagnosing psychiatrist: 271 met criteria for a current major depressive episode alone, 58 met criteria for a manic/hypomanic episode alone, 76 were inter-episode (i.e., did not qualify for a current episode), and 81 patients met current criteria for a depressive episode and a current manic/hypomanic episode.
Measure
Bipolar Inventory of Symptoms Scale (BISS; Bowden et al., 2005).
All networks were based on items from the assessor-administered BISS (Bowden et al., 2007; Gonzalez et al., 2008). The 45-item BISS assesses the severity of each DSM-5 (APA, 2013) symptom of bipolar disorder, plus other signs and symptoms often present in bipolar patients (NB: For ease of exposition, we use symptoms to denote both signs and symptoms hereafter). Each item is scored on a five-point ordinal scale: 0(Not at all), 1(Slight), 2(Mild), 3(Moderate), and 4(Severe). For three symptoms assessed by both participant report and assessor observation during the interview (anxiety, irritability, and sadness) we calculated the average of the reported and observed scores.
Node Selection
Using the BISS and guided by DSM-5 criteria, we assembled two sets of symptoms, one for depression and one for mania. The DSM-5 identifies a consensus set of emotional, cognitive, behavioral, and somatic experiences observed in those with depression and thus provides a tractable starting place for identifying components of this disorder. However, because the DSM-5 often lists different ways to satisfy a diagnostic criterion, a given criterion may contain multiple distinct phenomenological experiences that may exhibit distinct patterns of association with other symptoms of mania. For example, criterion A for a manic episode, can be satisfied not only by markedly high energy, but also by irritability, hyperactivity, or elated mood. We addressed this problem by disaggregating criteria prior to conducting our analyses (for analyses using the aggregated DSM-5 diagnostic criteria, see Supplements D [depression] and E [mania]).
For the depression networks, we selected 12 BISS items that cover experiences referenced in the diagnostic criteria for a major depressive episode (APA, 2013, p. 125). Topological overlap occurs when two symptoms are near synonyms, thereby artifactually inflating the magnitude of the edge connecting them and consequently their respective centrality indices (Fried & Cramer, 2017)1. A similar problem occurs for two near antonyms (e.g., nodes representing increased appetite and decreased appetite). Accordingly, we included classic neurovegetative features (e.g., insomnia, low appetite) and excluded the opposing characteristics of atypical depression (e.g., hypersomnia, increased appetite; APA, 2013, pp. 185–186). Because psychomotor agitation and psychomotor slowing can co-occur, especially in patients with melancholic depression, we included both in the depression networks. For the mania networks, we selected 13 BISS items that cover experiences referenced in the criteria for a manic episode (APA, 2013, p. 124). The means and standard deviations for depression and mania symptoms appear in Tables 1 and 2, respectively.
Table 1.
Means and Standard Deviations for Disaggregated DSM-5 Depressive Symptoms Assessed by the BISS (n = 486).
| Symptom (node label) | M | SD |
|---|---|---|
| 1. A1. Depressed [depressed mood] | 2.16 | 0.99 |
| 2. A1. Pessimism | 2.03 | 1.22 |
| 3. A2. Anhedonia | 1.97 | 1.31 |
| 4. A3. Appetite L [loss of appetite] | 1.13 | 1.29 |
| 5. A4. Insomnia | 2.23 | 1.46 |
| 6. A5. Motor Slow [psychomotor slowing] | 1.22 | 1.17 |
| 7. A5. Motor Agit [psychomotor agitation] | 1.69 | 1.31 |
| 8. A6. Energy L [low energy] | 2.27 | 1.27 |
| 9. A7. Guilt | 1.94 | 1.28 |
| 10. A7. Inadequacy | 2.22 | 1.28 |
| 11. A8. Concentrate [impaired concentration] | 2.08 | 1.14 |
| 12. A9. Suicide [suicidality] | 0.69 | 0.99 |
Note. BISS items that correspond to disaggregated DSM-5 criteria (A1 through A9). Clarifications appear in brackets for symptoms whose labels were shortened to appear within nodes. Scores can range from 0 through 4.
Table 2.
Means and Standard Deviations for DSM-5 Manic Symptoms Assessed by the BISS (n = 486).
| Symptom (node label) | M | SD |
|---|---|---|
| 1. A. Elated | 0.57 | 0.98 |
| 2. A. Energy H [high energy] | 0.71 | 1.18 |
| 3. A. Irritable | 1.57 | 0.97 |
| 4. A. Hyperactive | 0.69 | 1.18 |
| 5. B1. Grandiose | 0.40 | 0.84 |
| 6. B2. Slp Need L [less need for sleep] | 0.66 | 1.23 |
| 7. B3. Speech [pressured speech] | 1.03 | 1.23 |
| 8. B4. Racing Tht [racing thoughts] | 1.84 | 1.42 |
| 9. B5. Distractible | 1.73 | 1.17 |
| 10. B6. Sex Drive H [high sex drive] | 0.38 | 0.91 |
| 11. B6. Motor Agit [psychomotor agitation] | 1.69 | 1.31 |
| 12. B6. Social H [high social interest] | 0.37 | 0.85 |
| 13. B7. Risky Acts [risky activities] | 0.68 | 1.03 |
Note. BISS items that correspond to disaggregated DSM-5 criteria (A through B7). Clarifications appear in brackets for symptoms whose labels were shortened to appear within nodes. Scores can range from 0 to 4.
Finally, two pairs of items are superficially similar, but clinically distinct: item 6 (psychomotor slowing) and item 8 (low energy) in the depression cluster (Table 1), and symptom 2 (high energy) and 4 (hyperactive) in the mania cluster (Table 2). Energy is a subjective experience, whereas psychomotor slowing and hyperactivity are behavioral phenomena that may or may not occur as energy fluctuates.
Notably, we examined depression symptoms and mania symptoms as separate networks. We did so because including all symptoms in the same network would lead to the inclusion of symptoms with high content overlap (e.g., distractibility and concentration difficulty) and symptoms plausibly characterized as opposing ends of the same spectrum (e.g., high energy and low energy). Nodes with substantially overlapping content such as these can distort network findings (Hallquist et al., 2019). Nonetheless, because such analyses have been performed in prior research (Weintraub et al., 2020), because our DAG analyses assume no relevant variables have been omitted, and because an exploratory analysis of the relations between symptoms of mania and depression may help inform our understanding of how individuals transition between these syndromes, we have included a combined network of both mania and depression symptoms in Supplement C.
Gaussian Graphical Models (GGMs)
Network Estimation.
We used the R package bootnet (v. 1.1.0; Epskamp et al., 2018a) to estimate a Graphical Gaussian Model (GGM) for depression and for mania whereby edges connecting symptoms depict conditional independence relations (i.e., partial correlations between symptom pairs adjusting for the influence of all other symptoms in the network; Epskamp & Fried, 2018). All networks depicted symptoms of the same 486 patients. Following Epskamp and Fried (2018), we used polychoric correlations where data were detected as ordinal. To avoid spurious, false-positive edges that can occur when one estimates many parameters, we regularized the model via the graphical LASSO (Least Absolute Shrinkage and Selection Operator; Friedman et al., 2008; Friedman et al., 2014). Friedman et al.’s method uses an L1 penalty, estimating a sparse inverse covariance matrix that shrinks trivially small partial correlations to zero, thereby eliminating them from the graph. The resultant sparse network provides a parsimonious picture that best accounts for the covariance among symptoms while minimizing the number of edges. This method converges on the true model if the data-generating model is, indeed, sparse.
Recently, Williams and colleagues have raised concerns about regularization in psychological networks (Williams & Rast, 2020; Williams et al., 2019). These researchers note that the graphical LASSO was developed and optimized on high-dimensional datasets where the number of variables vastly exceeds the number of participants (e.g., many genes, but far fewer individuals), whereas the opposite typically holds for psychopathology datasets (e.g., many fewer symptoms than patients). Further, they argue, sparsity may be unwarranted in psychopathology networks (i.e., syndromic clusters of symptoms may have many interconnections). Hence, they developed non-regularized methods of network estimation that outperformed graphical lasso regulation in simulation studies in terms of providing more consistent results across conditions (e.g., sample size and network density) as well as reducing false-positive edges (Williams et al., 2019). Accordingly, in addition to estimating regularized partial correlation networks, we used the non-regularized, regression-based developed by Williams et al.(2019) as implemented in the R package GGMnonreg (v. 1.0.0), by using the BIC information criterion and the forward selection method.
Network Inference.
We used the R package qgraph (v. 1.6.4; Epskamp et al., 2012) to calculate the centrality indices for our networks. We focused our analysis on strength centrality and expected influence. A node’s strength centrality is the sum of the absolute values of its edges, whereas a node’s expected influence centrality is the sum of its edges, accounting for the sign of the edge (Robinaugh et al., 2016). When all the edges incident on a node are positive, strength and expected influence metrics are identical. Indices diverge when negative edges are present. We omitted centrality indices from our analysis (e.g., betweenness and closeness centrality) that have uncertain relevance for psychopathology (Bringmann et al., 2019), are less stable (Epskamp et al., 2018a), and seldom appear in recent psychopathology studies.
Network Stability.
We used the R package bootnet (v. 1.1.0; Epskamp et al., 2018a) to conduct non-parametric and case-dropping bootstrap analyses for the regularized GGM. We used these analyses to estimate the robustness of these network findings, including the precision of edge weight estimates, the stability of centrality indices, and the confidence with which we can conclude that a given symptom was more central than another. In addition, we evaluated whether distribution properties of the symptoms were systematically affecting our network analyses. As Terluin et al. (2016) noted, symptoms exhibiting little variance across patients may artifactually attenuate strength centrality values. Accordingly, we calculated the correlation between the standard deviation of a symptom’s severity and its strength centrality and expected influence centrality.
Bayesian networks (directed acyclic graphs).
Like the GGMs, the Bayesian network analysis returns a network comprising symptoms (nodes) and the relations between them (edges). Here, an edge issuing from one node and incident on another node suggests that activation of the first predicts activation of the second. More specifically, if a plausible directed causal system exists among the symptoms of bipolar disorder, then Bayesian network analysis returns a graph that can estimate the causal structure of the system, provided two assumptions are met: first, that there are no bidirectional causal relations (e.g., X causes Y, and Y causes X) or causal loops (e.g., X causes Y, Y causes Z, and Z causes X); and second, no important variables (e.g., other symptoms) are missing from the data set.
We computed DAGs by running the hill-climbing algorithm from the R package, bnlearn (Scutari, 2010) via macOS BigSur version 11.2 MacBook Pro (Processor: 3.1 GHz Intel Core i7). Implemented by bnlearn, the bootstrap function discerns the structural aspect of the network by adding edges, removing them, and reversing their direction to optimize a goodness-of-fit target score (i.e., Bayesian Information Criterion [BIC]). This first step ascertains whether an edge is present; it does not calculate the weights of the edges. We randomly restarted the process with different candidate edges linking different symptom pairs, perturbing the system, and so forth. This iterative procedure discloses the structure of the network.
To ensure the stability of the resultant network, we bootstrapped 10000 samples, computed a network for each of them, and averaged all 10000 networks to obtain the final, resultant network. There are two steps to this procedure. First, we ascertained how frequently an edge appears in the 10000 bootstrapped networks. If an edge appeared in at least 85% of these networks (Sachs et al., 2005), we retained it in the final, averaged DAG. Accordingly, such a sparse DAG depicts only those edges most likely to be genuine, assuming that the generating network is, indeed, sparse.
Second, we determined the direction of each edge in the 10000 bootstrapped networks. Following Sachs et al. (2005), if an edge ran from symptom X to symptom Y in at least 51% of the bootstrapped networks, then this direction appeared in the final, averaged network. In summary, we first ascertained the structure of the network (i.e., symptom to symptom connections), and then ascertained the direction of each edge.
The bnlearn program computes a BIC value for each edge. The thickness of an edge corresponds to its absolute BIC value and hence its importance to model fit. That is, to remove a thick, high-BIC value edge from the network would be far more damaging to model fit than to remove a thin, low-BIC value edge from the network.
We also computed the identical network, but this time edge thickness indicated the probability that the depicted direction of the edge occurred as shown in the graph. For example, if an edge originated at symptom X and is incident on symptom Y in 95% of the 10000 bootstrapped networks, it would appear very thick. Yet it would appear very thin if it went from symptom X to symptom Y in only 52% of the bootstrapped networks. Because the DAGs displaying confidence in the direction of prediction are especially important as visual complements to the undirected GGMs, we retained these graphs in the main article while including the DAGs depicting BIC values in the Supplementary Materials (Supplements A and B).
Results
Depression Networks
Gaussian Graphical Model.
The regularized and non-regularized GGMs for the disaggregated 12 depression symptoms appear in Figure 1. For the regularized GGM, the confidence intervals for edge weights were narrow, suggesting reasonably stable estimates (Supplement A). The strongest edges (regularized partial correlations) were between low energy and psychomotor slowing (rp = .47) and between feelings of guilt and inadequacy (rp = .33).
Figure 1.
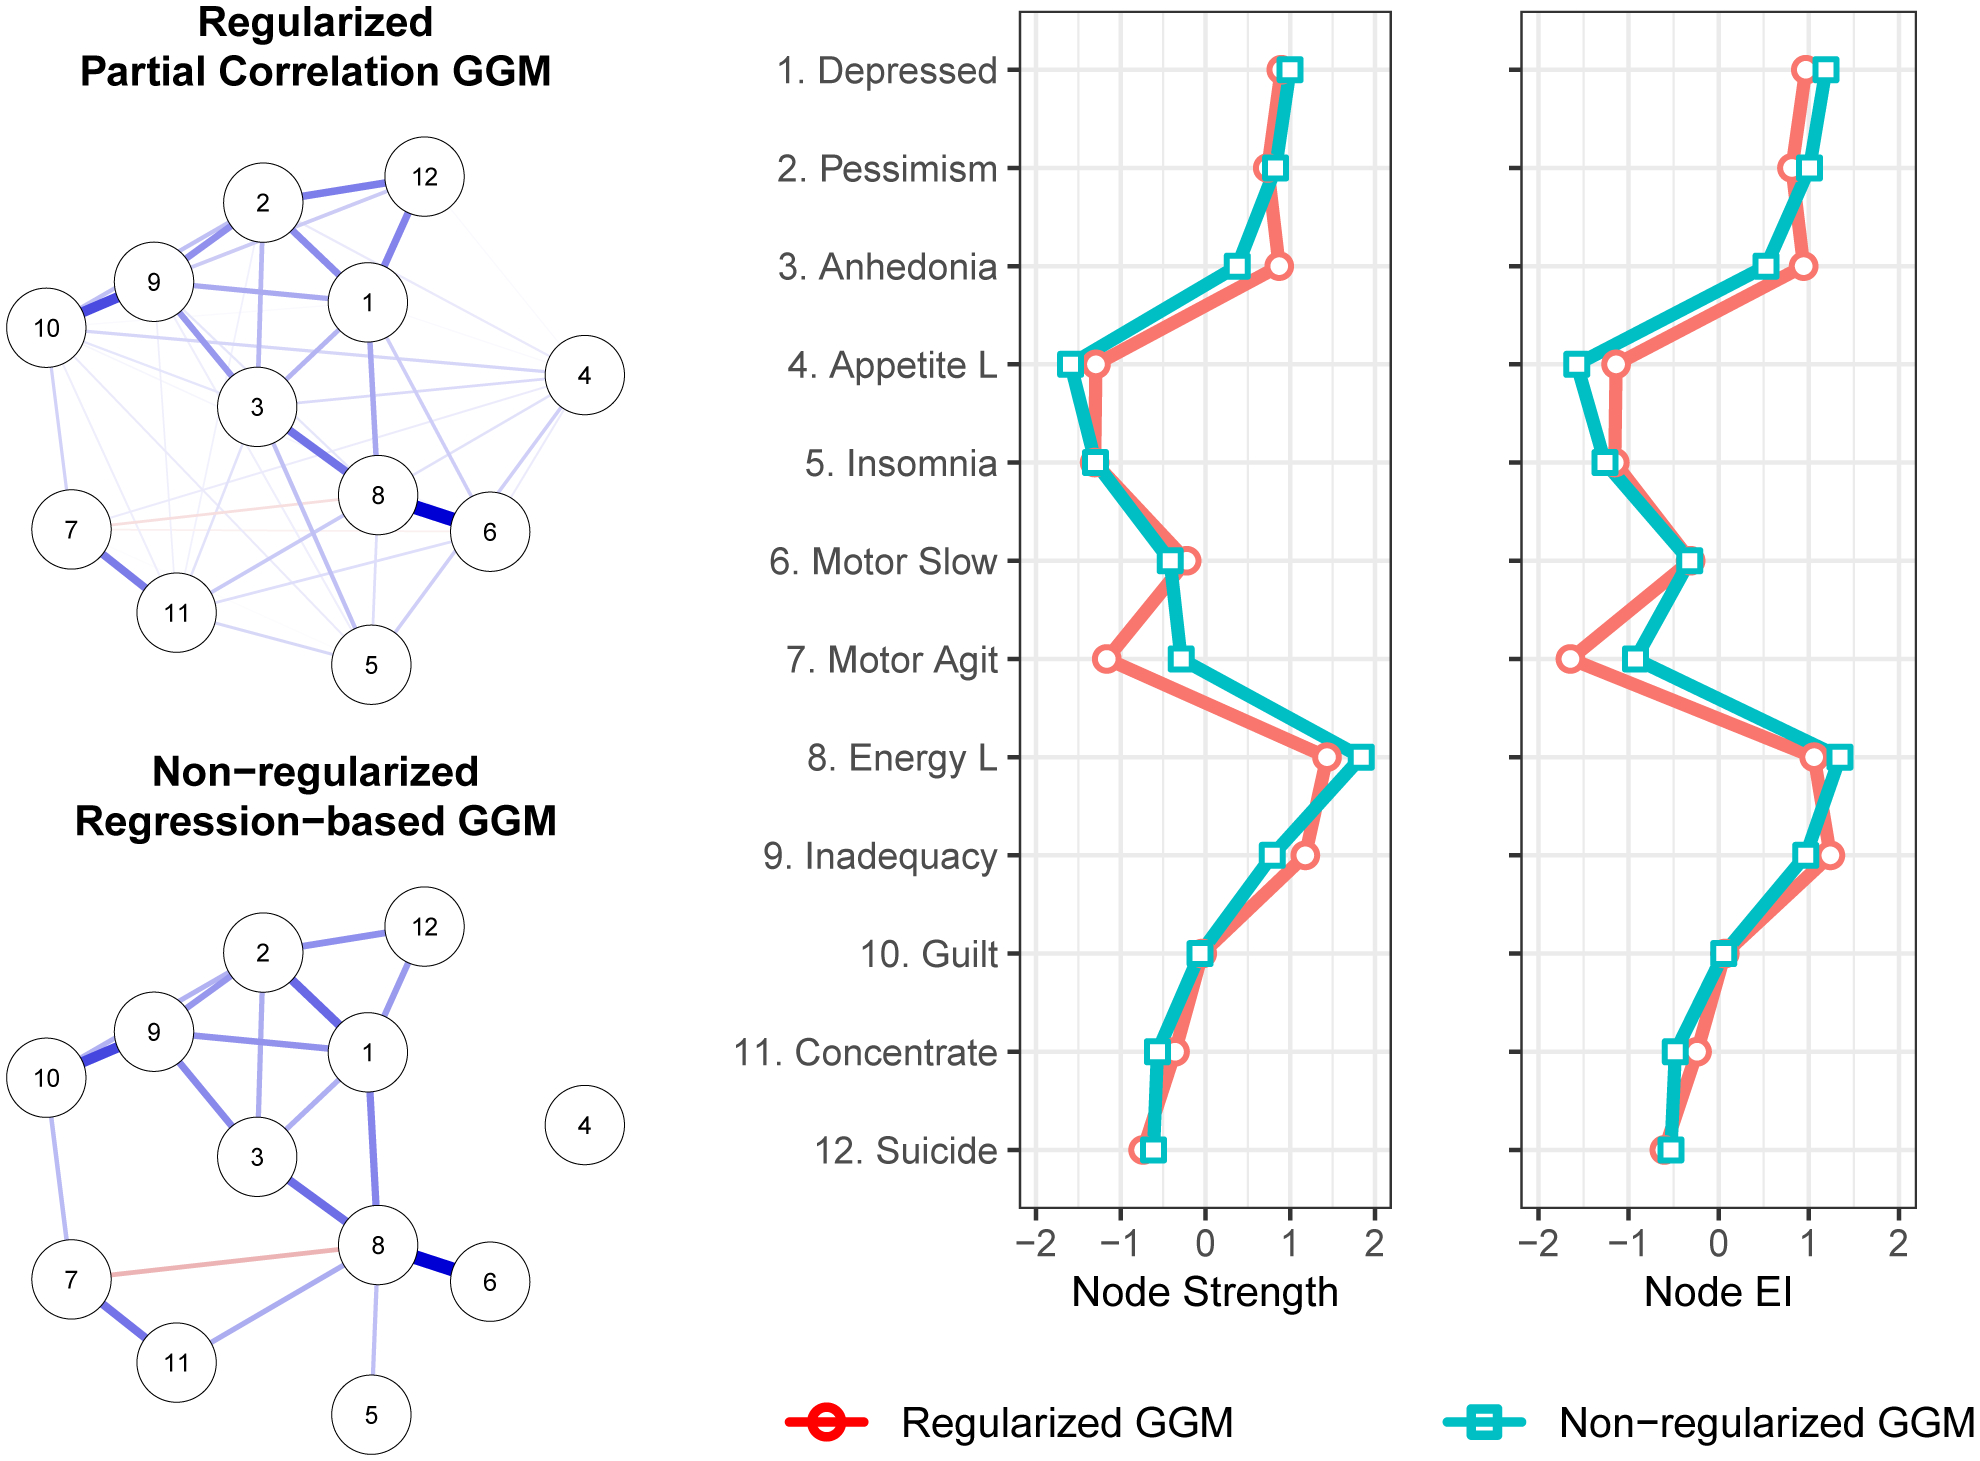
Gaussian graphical models (GGM) whereby edge thickness signifies the magnitude of association connecting a pair of depression symptoms. Blue edges indicate positive associations. Red edges indicate negative associations. Centrality plots depict the standardized node strength and expected influence for the regularized and non-regularized networks.
The non-regularized, regression-based method produced a similar, but sparser GGM, identifying a very similar set of especially strong edges but omitting weak edges that appeared in the regularized GGM. This finding is consistent with simulation results in which this non-regularized approach exhibited greater specificity (i.e., the proportion of absent edges correctly identified as being absent) but lower sensitivity (i.e., the proportion of edges correctly identified as being present) than did glasso regularization (Williams et al., 2020). Accordingly, the non-regularized GGM presented here is a more conservative complement to the regularized GGM: false positives are less likely, but some genuine edges may elude detection.
In the regularized network, the correlation stability (CS) coefficients for strength centrality (CS = .75) and expected influence centrality (CS = .75) were robust (Supplement A). The symptoms with the highest strength centrality were low energy, inadequacy, depressed mood, anhedonia, and pessimism (Figure 1). Bootstrapped difference tests (α = .05) indicated that low energy could not be statistically distinguished from these other high centrality symptoms, but had significantly greater strength centrality than did insomnia, loss of appetite, psychomotor agitation, suicidality, concentration impairment, guilt, and psychomotor slowing. For expected influence, low energy again had significantly greater expected influence centrality than did the majority of symptoms, but was again statistically indistinguishable from inadequacy, depressed mood, anhedonia, and pessimism (Supplement A).
The same broad pattern of findings appeared in the non-regularized networks. Consistent with the regularized network, low energy exhibited the highest strength and expected influence values, with centrality reasonably comparable to that of inadequacy, depressed mood, anhedonia, and pessimism.
In both the regularized and non-regularized networks, strength centrality (r[10]= −.18 and r[10]= −.21, respectively), and expected influence, (r[1])= −.22 and r[10]= −.16, respectively), were negatively and weakly correlated with the standard deviations for symptom severity. This implies that variance differences across symptoms did not drive symptom centrality values.
Directed Acyclic Graph.
Figure 2 depicts the DAG for the 12 disaggregated depression symptoms. Edge thickness in this graph signifies confidence in the direction of prediction. If all relevant variables are in the dataset and if there are no cycles among the symptoms, then this graph provides the best estimate of the causal dependencies among the symptoms of bipolar depression.
Figure 2.
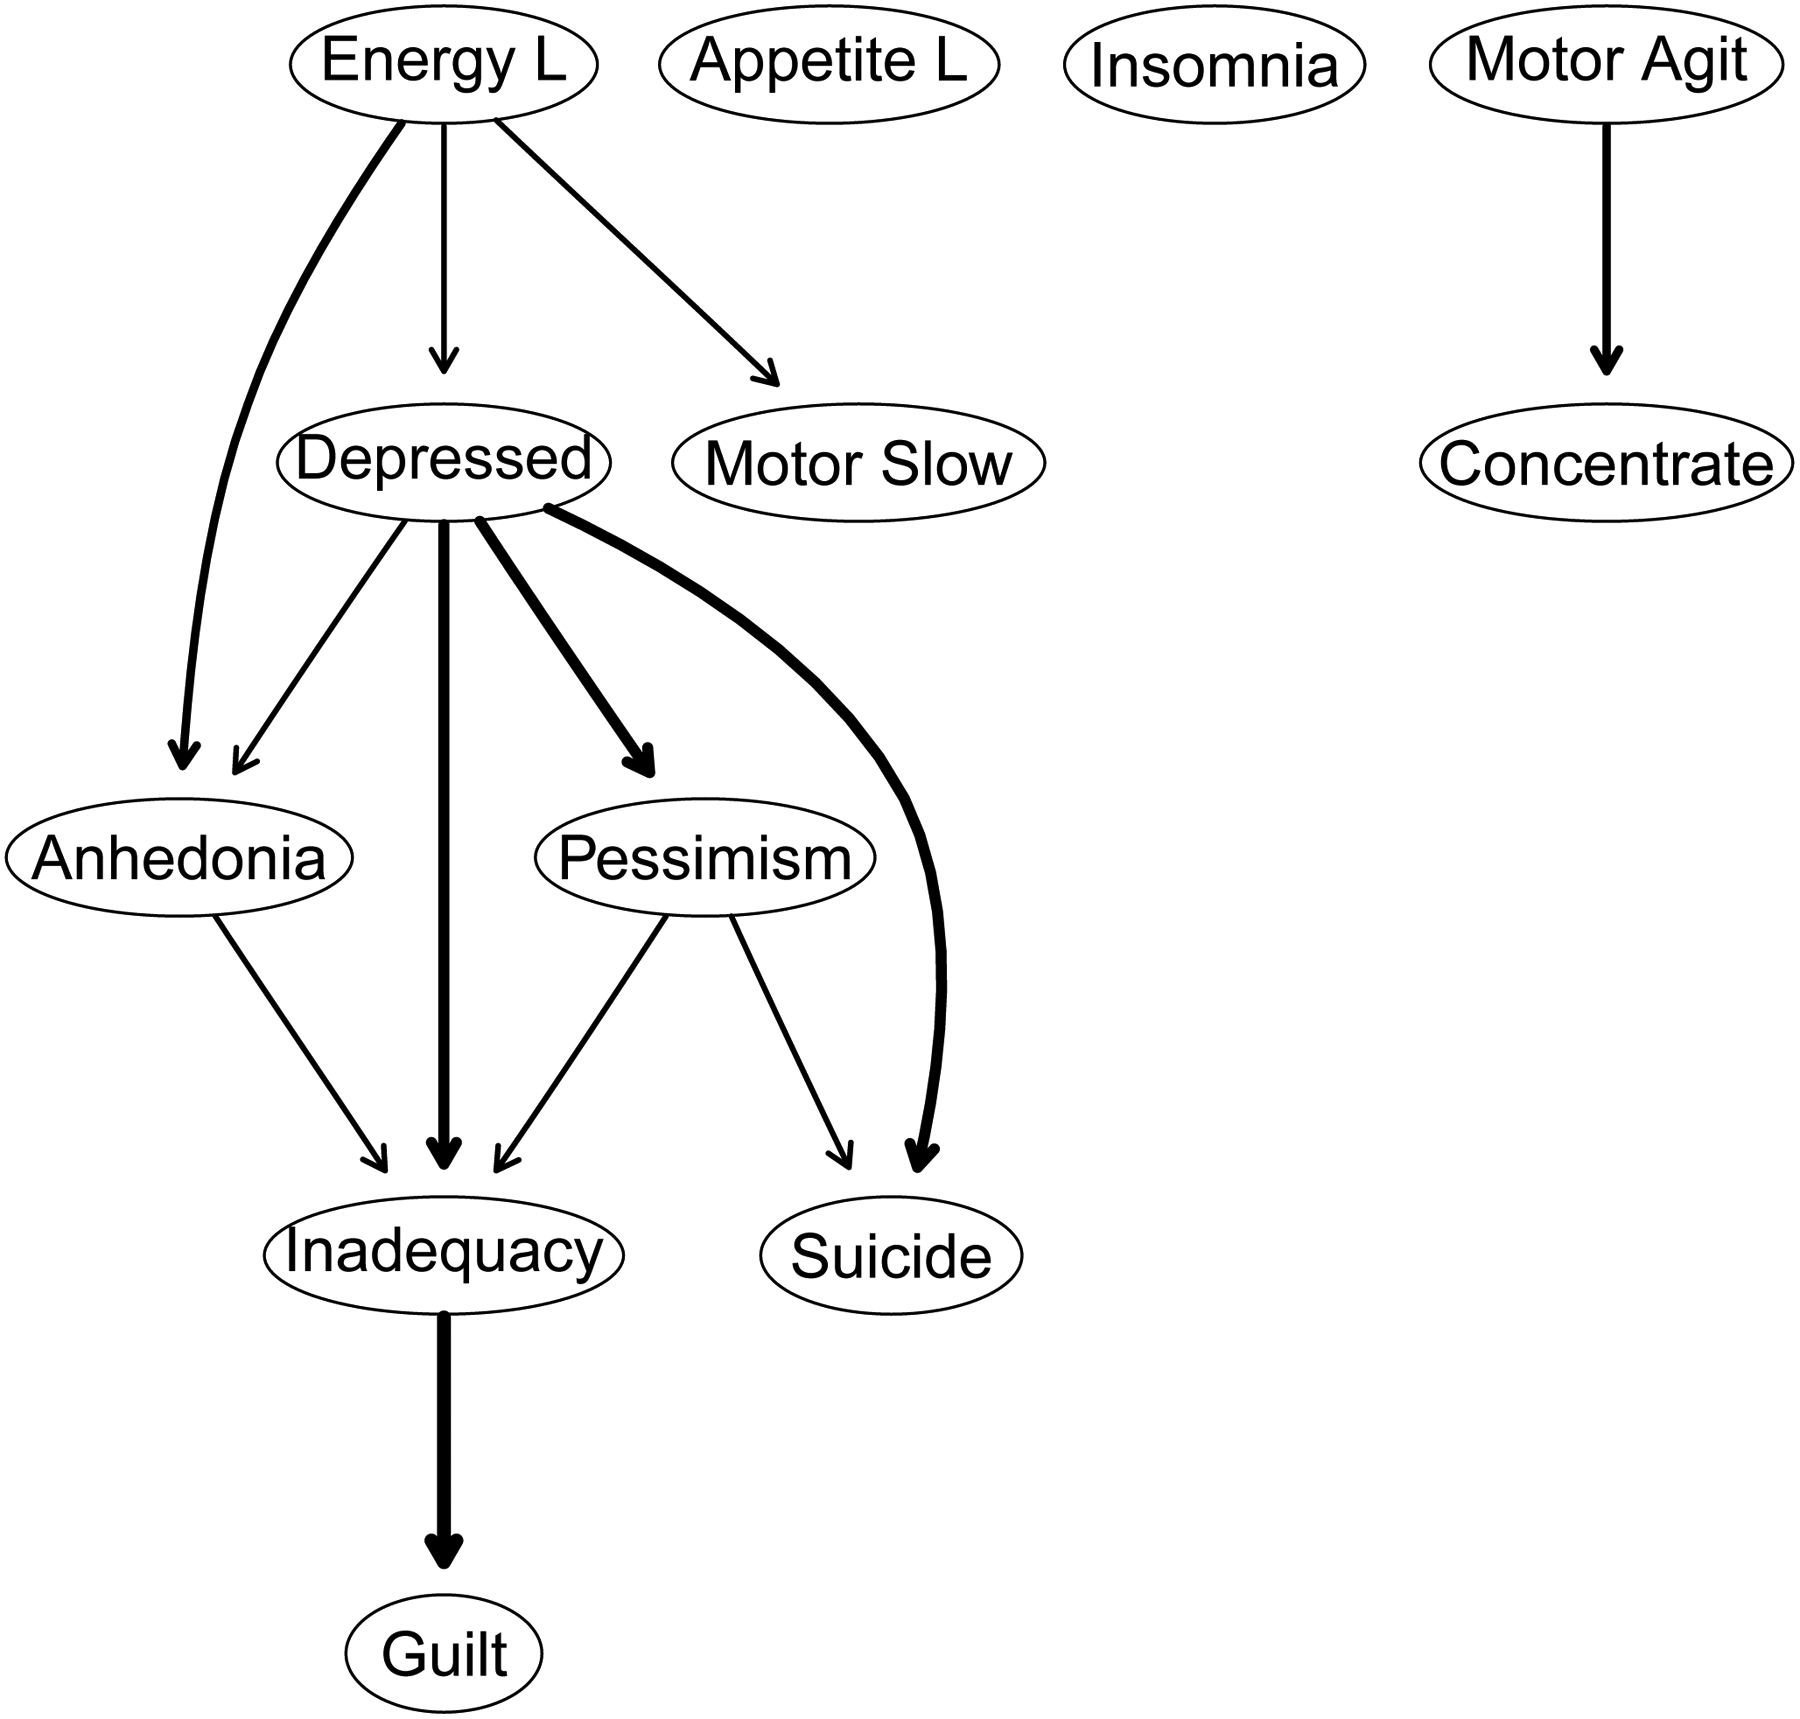
A directed acyclic graph (DAG) whereby edge thickness signifies confidence in the direction of prediction depicted. The nodes correspond to symptoms of depression.
The DAG shows a chain of symptoms dependent on the parent node of low energy which directly predicts anhedonia, depressed mood, and psychomotor slowing. That is, low energy has no incoming edges (i.e., in-degree = 0), but has three outgoing edges (i.e., out-degree = 3). Stated differently, the occurrence of anhedonia, sadness, or psychomotor slowing more likely depends on the presence of low energy rather than vice versa. Depressed mood has direct descendants: anhedonia, inadequacy, pessimism, and suicidality. There are two parents (paths) for anhedonia (low energy and depressed mood) and two for suicidality (depressed mood and pessimism). Guilt occurs only through inadequacy, which can arise via anhedonia, depressed mood, or pessimism. The three symptoms without any descendants – guilt, psychomotor slowing, and suicidality are not prerequisites for any other symptoms. Distinct from the main system are loss of appetite, insomnia, and psychomotor agitation that do not depend on the occurrence of any other symptoms, although the psychomotor agitation does have concentration impairment as its only descendant.
Mania Networks
Gaussian Graphical Model.
The regularized and non-regularized GGMs for the disaggregated 13 mania symptoms appear in Figure 3. For the regularized network, the confidence intervals for edge weights suggest reasonably precise estimates (Supplement B). Among the strongest edges (regularized partial correlations) were the relation between high energy and hyperactive (rp = .65); elated and grandiose (rp = .51); and between racing thoughts and pressured speech (rp = .34). The non-regularized GGM again omitted many weak edges that appeared in the regularized GGM but identified the same set of especially important relation between symptom pairs.
Figure 3.
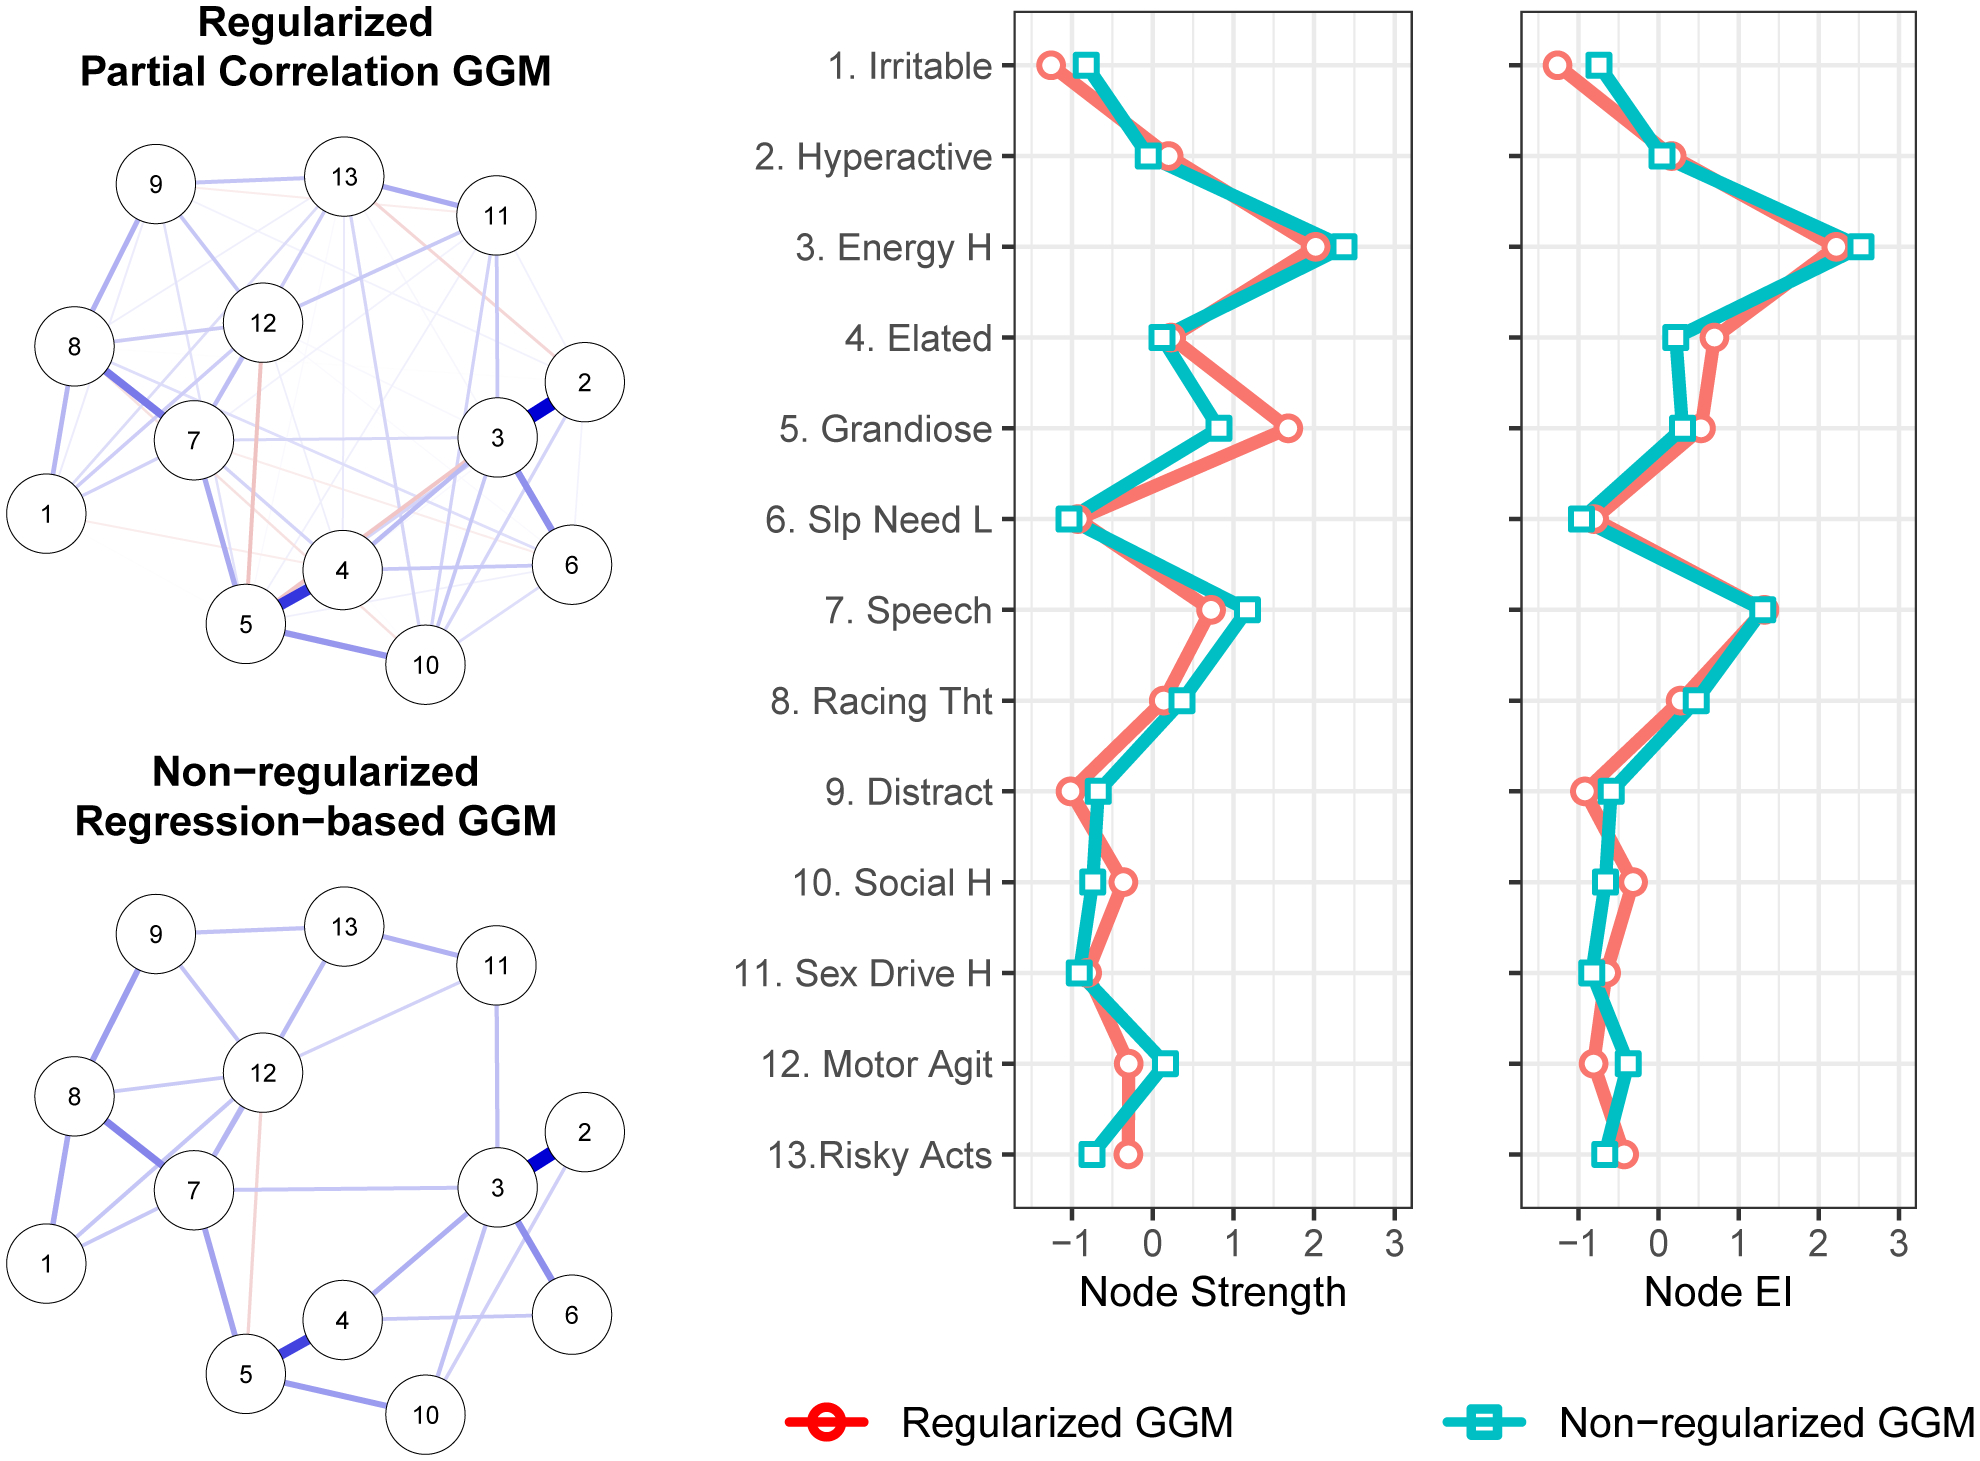
Gaussian graphical models (GGMs) whereby edge thickness signifies the magnitude of association connecting a pair of mania symptoms. Blue edges indicate positive associations. Red edges indicate negative associations. Centrality plots depict the standardized node strength and expected influence for the regularized and non-regularized networks.
In the regularized network, both strength centrality and expected influence were less stable than in the depression symptom network, but exceeded recommended levels of stability (i.e., ≥ .50; CS coefficients = .52 and .67, respectively; Supplement B). The symptoms with the highest strength centrality were high energy (1.694), grandiosity (1.583), and pressured speech (1.270). Bootstrapped difference tests (α = .05) indicated that these three symptoms were statistically indistinguishable in terms of strength centrality (Supplement B), but that high energy exhibited greater expected influence than did grandiosity, which had diminished expected influence relative to strength due to its negative association with psychomotor agitation (Supplement B). Moreover, high energy had significantly greater strength than did 10 of the remaining 12 symptoms, and greater expected influence than did 11 of the remaining 12 symptoms. The non-regularized network results closely parallel those of the regularized network, again identifying high energy as especially central.
In both the regularized and non-regularized networks, strength centrality, r(11)= .00 and r(11)= .11, respectively, and expected influence, r(11)= .12 and r(11)= .21, respectively, were very minimally correlated with the standard deviations for symptom severity. This suggests that variance differences across symptoms did not affect symptom centrality values.
Directed Acyclic Graph.
Figure 4 depicts the DAG for the 13 disaggregated mania symptoms computed via the Sachs et al. (2005) method. It indicates confidence in the direction of prediction. The DAG reveals two parent symptoms for a manic episode: high energy and grandiosity. The first symptom has four immediate descendants, and the second one has three. However, the pathway to a full-blown episode goes through pressured speech – a symptom having three symptomatic offspring (racing thoughts, psychomotor agitation, and risky activities). Distractibility, irritability, and high sex drive have no symptomatic offspring although the first two depend on racing thoughts and the third depends on risky activities.
Figure 4.
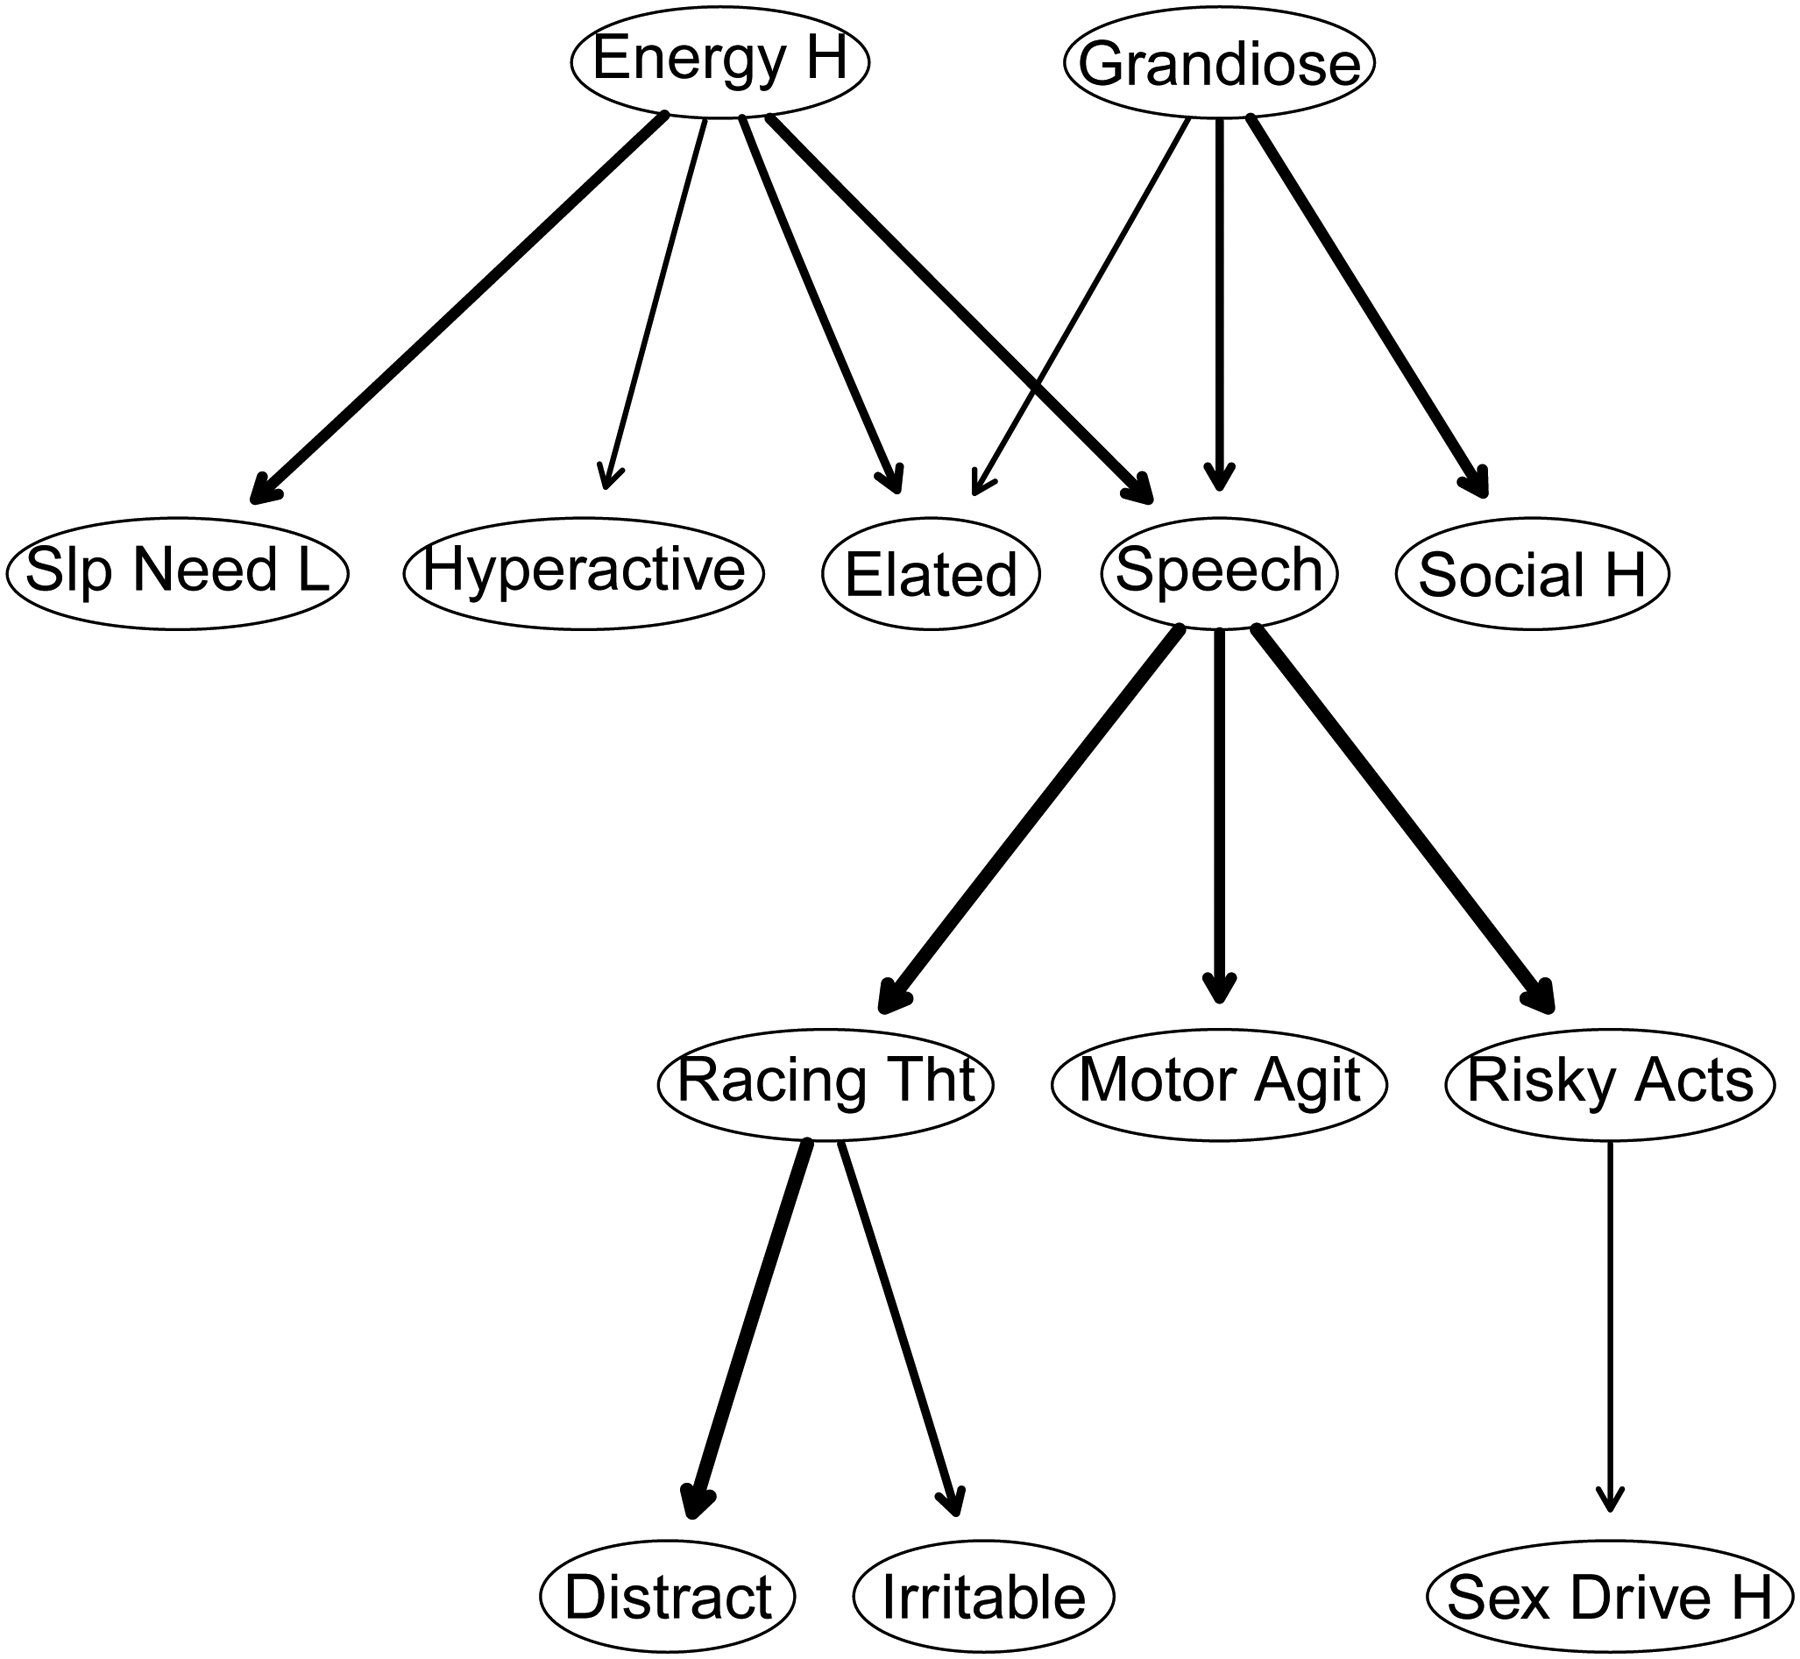
A directed acyclic graph (DAG) whereby edge thickness signifies confidence in the direction of prediction depicted. The nodes correspond to symptoms of mania.
Combined Depression and Mania Networks
Gaussian Graphical Model.
The regularized and non-regularized GGM for the 24 disaggregated depression and mania symptoms appears in Supplement C. Importantly, when performing bootstrap stability analyses for the combined regularized GGM, we found that the bootstrap iterations consistently returned non-positive definite correlation matrices, precluding network estimation in these bootstrap samples, and thus clear estimation of network stability. Accordingly, although we present the combined regularized GGM for transparency, it should be interpreted very cautiously. Nevertheless, both the regularized and non-regularized combined network revealed pattern of findings consistent the depression-only and mania-only networks (see Figures 1 and 2), including the high strength centrality of energy.
Directed acyclic graph.
DAGs for the combined symptom network appear in Supplement C. Consistent with the GGM, depression and mania were a distinguishable community of symptoms, sharing only distractibility as a terminus of both concentration difficulty and racing thoughts. Low and high energy again occupy prominent parental positions whereby the presence of symptomatic offspring implies the presence of abnormally low or high energy levels for the depression and mania clusters, respectively. In contrast to the DAG for mania symptoms alone, in the combined DAG, hyperactivity was a parental node of high energy. However, confidence in this direction was low, as indicated by the very thin edge connecting them.
Discussion
To our knowledge, this is the largest study of bipolar disorder symptom networks and only the third to apply the tools of network analysis to inform our understanding of this syndrome. In a sample of 486 patients, we separately analyzed symptoms of depression and symptoms of mania, computing regularized and non-regularized Gaussian Graphical Models (GGMS) and a Bayesian Directed Acyclic Graph (DAG) for both sets of symptoms.
Perhaps the most consistent findings across our analyses were those that indicate the potential importance of energy in bipolar disorder – low energy in depression and high energy in mania. In the GGMs of depression symptoms, low energy was among a subset of highly central symptoms and in bootstrap difference tests exhibited significantly greater strength and expected influence than the majority of the remaining symptoms. Low energy had robust direct associations with motor slowing, depression, anhedonia, insomnia, and concentration impairment.
The DAG provides further insight into these associations. In these analyses, low energy was the most important parent symptom, directly predicting anhedonia, depressed mood, and motor slowing which, in turn, predicted feelings of inadequacy, pessimism, and ultimately guilt and suicidal thoughts. That is, the presence of guilt, inadequacy, suicidality, pessimism, motor slowing, anhedonia, and depressed mood all presupposed the presence of low energy more than vice versa. These findings remained consistent when we examined a DAG comprising both mania and depression symptoms (see Supplement C).
The findings for mania mirrored those of depression. In the GGMs, high energy exhibited the highest strength and expected influence. In the regularized networks, where bootstrap differences evaluated differences in centrality, high energy was significantly greater in node strength than all symptoms but grandiosity and pressured speech, and all but pressured speech in expected influence. High energy had especially strong associations with elation, hyperactivity, and diminished need for sleep.
The DAG similarly identified high energy as a key parent node that directly predicted elation, hyperactivity, diminished need for sleep, and pressured speech. Moreover, all mania symptoms in the DAG were either directly or indirectly dependent on two key parent nodes: high energy and grandiosity. That is, high energy was not the sole important parent, but its importance was nevertheless apparent. For elevated energy, this pattern of findings remained consistent in a DAG that included both mania and depression symptoms. In contrast, the role of grandiosity was somewhat diminished in this analysis (see Supplement C). Given that grandiosity was also the symptom for which there was the most disagreement between GGM estimation methods and centrality indices (see Figure 3), the evidence for its potential importance was weaker than that of high energy.
Our findings regarding energy converge with those from several network analytic studies of mood disorders. In recent systematic reviews, Contreras et al. (2019) and Malgaroli et al. (2021) observed that low energy frequently emerges as a highly central symptom in depression networks. In a sample of adolescents with a bipolar spectrum disorder, Weintraub et al. (2020) found that symptoms of diminished and elevated energy were among the most central in a network that included both depression and mania symptoms (for a comparable analysis using data from the current study, see Supplement C). Koenders et al. (2015) similarly found loss of energy consistently exhibited high centrality across different subsets of patients with bipolar disorder.
Our findings also converge with results from other, non-network studies. For example, in a confirmatory factor analysis, Cheniaux et al. (2014) found that increased energy was the symptom most strongly associated with overall mania. Van Meter et al. (2016) found that having “too much energy” (p. 547) was the most prevalent symptom prior to an initial manic episode. In a study of the dynamic relationships among sleep, energy, behavioral activity, and mood throughout the day, Merikangas et al. (2019) observed that energy prospectively predicted motor activity which, in turn, predicted mood, thereby identifying energy and activity as potentially fruitful targets of intervention. Together with our analyses, these studies suggest that bipolar disorder may be as much a disorder of energy as of mood.
Accordingly, the role of energy in both mania and bipolar depression should be a high-priority area for research and intervention. It will be especially valuable to gather time-series data via ecological momentary assessment as Merikangas et al. (2019) and Curtiss et al. (2019) have done. Further research investigating the within-person structure of relations among all bipolar disorder symptoms can illuminate how they unfold over time.
It may also be fruitful to investigate the association of biological variables with the bipolar disorder symptom network. Researchers have hypothesized that, at least for some, bipolar disorder may be associated with dysregulations of mitochondrial energy production (Andreazza et al., 2018; Andreazza & Nierenberg, 2018; Nierenberg et al., 2013). Further research investigating the relation between this, and other biological dysregulations, and the subjective experience of energy may elucidate mechanisms affecting dramatic fluctuations in energy that may initiate symptomatic cascades that culminate in episodes of mania and depression.
We might wonder whether a patient’s mood state might “bias” their appraisal of their energy level.2 For example, (hypo)manic states may foster overestimates of one’s energy, whereas depressed states lead to underestimates. Yet in one sense a patient’s phenomenological reports of high or low energy are irrefragable. If patients say their energy is very high or very low, who are we to disagree, and on what basis might we do so? Nevertheless, the relation between phenomenology and psychobiology warrants further examination.
Beyond our findings regarding energy, a second consistent finding to emerge is the importance of depressed mood and pessimism, discouragement, or hopelessness about the future as predictors of suicidality. Suicidality, depressed mood, and pessimism were strongly interconnected in the GGMs, and the presence of suicidality was probabilistically dependent on the presence of both pessimism and depressed mood. Indeed, these two symptoms were the sole correlates of suicidality in the non-regularized GGM and the sole predictors of suicidality in the DAG. These findings dovetail with longitudinal studies showing that although the effect sizes for predictors of suicidal ideation are extremely modest, at best, hopelessness is the best predictor other than a prior suicide attempt (Franklin et al. 2017).
Finally, pressured speech also emerged as a symptom of some potential importance in our analyses. In the GGMs, it was consistently among the most central nodes, especially for expected influence, and it bridged the high centrality symptoms of high energy and grandiosity with other more peripheral symptoms, such as irritability, racing thoughts, and psychomotor agitation. Similarly, in the DAG, pressured speech was an offspring of high energy and grandiosity, and a parent of psychomotor agitation, risk behavior, racing thoughts, and, in turn, distractibility and irritability. This general pattern of findings emerged in the combined network of all bipolar disorder symptoms and in the network limited to DSM-5 criteria (Supplement E).
Limitations and Challenges
Several limitations and challenges are worth considering when interpreting our results. First, our GGMs are based on cross-sectional analyses and reflect conditional dependence associations among symptoms, not causal relations. Consequently, the implications of these analyses for assessing, diagnosing, and treating bipolar disorder are not straightforward. Although early work on network psychopathology expressed the hope that symptoms high on strength centrality may be suitable targets for intervention whose resolution would hasten recovery from illness (e.g., McNally, 2016), such hopes presupposed that these networks, while perhaps not establishing causal relations, would at least identify a ‘skeletal’ structure of the causal system of interest. Subsequent research has suggested this is unlikely to be the case for the kinds of complex systems we should expect to see in mental health research (Haslbeck et al., in press-b; Ryan, et al., 2019). Moreover, reservations have arisen about whether interventions are able to selectively target high-centrality symptoms in isolation from other symptoms, akin to a gene-knockout procedure (e.g., Bringmann et al., 2019; McNally, 2021). Accordingly, the findings presented here are perhaps best understood as a first step toward identifying phenomena that, if robust, can help guide and constrain the development of rigorous, and ideally formalized, theories about the structure of these causal systems; theories that, in turn, would have clearer implications for diagnosis and treatment than do the present analyses alone (Robinaugh et al., 2020a; 2020b).
Second, our Bayesian network analyses rest on several key assumptions, including the assumption of causal relations among symptoms, acyclicity, and comprehensive coverage of symptom components. There are reasons to suspect that these assumptions are violated. For example, sleep and energy almost certainly have bidirectional influence on one another. The full impact of violating the assumption of acyclicity in these analyses is unknown but, at a minimum, means that these analyses will fail to detect such cycles: feedback loops that may be critical to understanding dynamics of the syndrome. Hence, our findings can only be treated as a provisional sketch of a potentially causal system among bipolar disorder symptoms. As García-Velázquez et al. (2020) observed, acyclicity is a simplifying assumption that does suggest interventional hypotheses. For example, clinically targeting parent symptoms should be far more beneficial than only targeting descendants. They noted, “it seems wise to start with robust findings on directed dependence and only then build toward more complex models” (p. 247). Hence, rather than dismissing DAGs out of hand because of their assumption of acyclicity, one can regard them as preliminary, simplified sketches of potential causal associations. As Grosz et al. (2020) have argued, psychologists can best deepen understanding by abandoning the taboo against causal reasoning in nonexperimental, observational research. By drawing on diverse sources of evidence, observational as well as experimental, we can strengthen our abductive inferences about plausible causal explanations in psychopathology.
Third, for our primary analysis we conducted separate analyses for symptoms of depression and mania. We did so because several symptoms in these networks appear to have overlapping content (e.g., concentration difficulty and distractibility) and in some cases seem to tap opposing poles of the same construct (e.g., high vs. low energy; elated vs. depressed mood). Nodes with overlapping content can significantly distort network characteristics, such as centrality indices (Hallquist et al., 2019). Although examining these networks in isolation allowed us to avoid this methodological challenge, a complete understanding of the bipolar disorder symptom network will ultimately require an understanding of how nodes across the mania and depression networks relate to one another. Accordingly, in future research on the bipolar disorder symptom network, it will be critical to consider how best to assess these symptoms (e.g., whether they represent opposite poles of the same construct or distinguishable processes), how best to conceptualize and assess their relation to one another, and how to interpret network characteristics in the context of symptoms that plausible represent opposing dimensions. We suspect that intra-individual network analyses assessing the relationships among symptoms of depression and mania within individuals across different mood states will be critical to understanding the dynamics of these relationships.
Finally, it is worth noting that network findings for the DSM-5 diagnostic criteria for depression and mania differ somewhat from the disaggregated symptom networks that were the focus of our primary analysis (see Supplements D and E). For the DSM-5 mania networks, the findings were quite consistent with our primary analyses. Together with pressured speech, criterion A for mania, an aggregate criterion including elevated mood, energy, irritability, or hyperactivity, was consistently among the two most central symptoms in the regularized and non-regularized GGMs and was a key parent node in the DAG. In the DSM-5 depression regularized and non-regularized GGMs, low energy remained in a group of symptoms with higher centrality but was consistently less central than the criterion defined by depressed mood and pessimism. Similarly, in the DAG, low energy was a parent node only to psychomotor retardation or agitation, and, in turn, concentration. These results serve as a valuable reminder that the findings from network analyses depend upon the nodes included in the network, underscoring the importance of clarifying the components of the bipolar disorder symptom that should be the focus of future research and determining how best to assess them.
Conclusions
In summary, our findings indicate that energy, both high and low, may be especially important in the bipolar disorder symptom network. In future research, it will be valuable to determine whether these cross-sectional associations among symptoms replicate across other studies, especially in those with even larger sample sizes. Even more so, it will be valuable to investigate the relationships among these symptoms with intra-individual network analyses in large samples, so that the within-person associations among symptoms can be ascertained (e.g., Epskamp et al., 2018c; Epskamp et al., 2018d). Together, such studies would provide rich information about how symptoms of bipolar disorder relate to one another and a firm foundation upon which to investigate how they may operate as a causal system.
Supplementary Material
Footnotes
Two nodes can be highly correlated if one reliably causes the other (e.g., severe insomnia causing fatigue), but this does not signify topological overlap. Topological overlap occurs when two nodes are highly correlated with one another merely because they are synonymous (e.g., feeling sad and feeling blue). Needless to say, the absence of topological overlap between two highly correlated nodes is consistent with a causal interpretation of the association, especially when can draw on other sources of information (i.e., that sleep loss causes fatigue; Pearl & Mackenzie, 2018), but it does not confirm it. Another possibility, especially with self-report measures, is that patients who are fatigued, for example, during the past may infer that they must have experienced sleep loss.
One reviewer also asked whether frequency of endorsement of a symptom might induce spurious associations with other symptoms. To the best of our knowledge, there is no reason to believe that high mean scores on a symptom (or frequent endorsement of a symptom) will result in a spurious correlation between them. That is, an association between symptoms A and B will depend not only symptom A being present when symptom B is present, but also depend on symptom A’s absence when symptom B is absent – an unlikely occurrence based on frequency of endorsement alone. Accordingly, a symptom may be commonly present, but not necessarily correlated with other ones.
One reviewer asked whether correlations between symptom pairs might vary as a function of a patient’s mood state (e.g., manic versus depressed). This is likely, and attributable to range restriction arising from Berkson’s bias (i.e., conditionalizing on mood state; see Haslbeck et al., in press-a). The correlation matrices consisting of symptom-symptom associations as a function of mood state do, indeed, suggest such range restriction (Supplement F).
References
- American Psychiatric Association. (1980). Diagnostic and statistical manual of mental disorders (3rd Ed.). Washington, DC: Author [Google Scholar]
- American Psychiatric Association. (2013). Diagnostic and statistical manual of mental disorders (5th Ed.). Washington, DC: American Psychiatric Publishing. [Google Scholar]
- Andreazza AC, Duong A, & Young LT (2018). Bipolar disorder as a mitochondrial disease. Biological Psychiatry, 83(9), 720–721. 10.1016/j.biopsych.2017.09.018 [DOI] [PubMed] [Google Scholar]
- Andreazza AC, & Nierenberg AA (2018). Mitochondrial dysfunction: At the core of psychiatric disorders? Biological psychiatry, 83(9), 718–719. 10.1016/j.biopsych.2018.03.004 [DOI] [PubMed] [Google Scholar]
- Borgatti SP (2005). Centrality and network flow. Social Networks, 27(1), 55–71. doi: 10.1016/j.socnet.2004.11.008 [DOI] [Google Scholar]
- Borsboom D (2008). Psychometric perspectives on diagnostic systems. Journal of Clinical Psychology, 64(9), 1089–1108. 10.1002/jclp.20503 [DOI] [PubMed] [Google Scholar]
- Borsboom D (2017). A network theory of mental disorders. World Psychiatry, 16(1), 5–13. 10.1002/wps.20375 [DOI] [PMC free article] [PubMed] [Google Scholar]
- Borsboom D, & Cramer AOJ (2013). Network analysis: An Integrative approach to the structure of psychopathology. Annual Review of Clinical Psychology, 9, 91–121. 10.1146/annurev-clinpsy-050212-185608 [DOI] [PubMed] [Google Scholar]
- Bowden CL, Singh V, Thompson P, Gonzalez JM, Katz MM, Dahl M, Prihoda TJ, & Chang X (2007). Development of the Bipolar Inventory of Symptoms Scale. Acta Psychiatrica Scandinavica, 116(3), 189–194. 10.1111/j.1600-0447.2006.00955.x [DOI] [PubMed] [Google Scholar]
- Bowden CL, Singh V, Thompson PM, Gonzalez J, Prihoda TJ, Katz KM, Medina RA, Dahl M, Burnett TJ, Chang X (2005). Bipolar Inventory of Symptoms Scale (BISS). Department of Psychiatry, University of Texas Health Sciences Center. San Antonio, TX. [Google Scholar]
- Bringmann LF, Elmer E, Epskamp S, Krause RW, Schoch D, Wichers M, Wigman JMT, & Snippe E (2019). What do centrality measures measure in psychological networks? Journal of Abnormal Psychology, 128(8), 892–903. 10.1037/abn0000446 [DOI] [PubMed] [Google Scholar]
- Cheniaux E, Filgueiras A, da Silva RDA, Silveira LAS, Nunes ALS, & Landeira-Fernandez J (2014). Increased energy/activity, not mood changes, is the core feature of mania. Journal of Affective Disorders, 152(1), 256–261. http://dx.doi.org/101016/j.jad.2019.09.021 [DOI] [PubMed] [Google Scholar]
- Contreras A, Nieto I, Valiente C, Espinosa R, & Vazquez C (2019). The study of psychopathology from the network analysis perspective: A systematic review. Psychotherapy and Psychosomatics, 88(2), 71–83. doi: 10.1159/000497425 [DOI] [PubMed] [Google Scholar]
- Cramer AOJ, Borsboom D, Aggen SH, & Kendler KS (2012). The pathoplasticity of dysphoric episodes: Differential impact of stressful life events on the pattern of depressive symptom inter-correlations. Psychological Medicine, 42(5), 957–965. 10.1017/S003329171100211X [DOI] [PMC free article] [PubMed] [Google Scholar]
- Cramer AOJ, van Borkulo CD, Giltay EJ, van der Maas HLJ, Kendler KS, Scheffer M, & Borsboom D (2016). Major depression as a complex dynamic system. PloS ONE, 11(12): e0167490. doi: 10.1371/journal.pone.0167490. [DOI] [PMC free article] [PubMed] [Google Scholar]
- Cramer AOJ, Waldorp LJ, van der Maas HLJ, & Borsboom D (2010). Comorbidity: A network perspective. Behavioral and Brain Sciences, 33(2–3), 137–193. 10.1017/S0140525X09991567 [DOI] [PubMed] [Google Scholar]
- Curtiss J, Fulford D, Hofmann SG, & Gershon A (2019). Network dynamics of positive and negative affect in bipolar disorder. Journal of Affective Disorders, 249(4), 270–277. 10.1016/j.jad.2019.02.017 [DOI] [PMC free article] [PubMed] [Google Scholar]
- Epskamp S, Borsboom D, & Fried EI (2018a). Estimating psychological networks and their accuracy: A tutorial paper. Behavior Research Methods, 50(1), 195–212. doi: 10.3758/s13428-017-0862-1 [DOI] [PMC free article] [PubMed] [Google Scholar]
- Epskamp S, Cramer AOJ, Waldorp LJ, Schmittmann VD, & Borsboom D (2012). qgraph: Network visualization of relationships in psychometric data. Journal of Statistical Software, 48(4), 1–18. http://www.jstatsoft.org/ [Google Scholar]
- Epskamp S, & Fried EI (2018). A tutorial on regularized partial correlation networks. Psychological Methods, 23(4), 617–634. 10.1037/met0000167 [DOI] [PubMed] [Google Scholar]
- Epskamp S, Maris G, Waldorp LJ, & Borsboom D (2018b). Network psychometrics. In Irving P, Hughes D, & Booth T (Eds.), The Wiley handbook of psychometric testing, 2 volume set: A multidisciplinary reference on survey, scale and test development (pp. 953–986). New York: Wiley. [Google Scholar]
- Epskamp S, van Borkulo CD, van der Veen DC, Servaas MN, Isvoranu A-M, Riese H, & Cramer AOJ (2018c). Personalized network modeling in psychopathology: The importance of contemporaneous and temporal connections. Clinical Psychological Science, 6(3), 416–427. doi: 10.1177/2167702617744325 [DOI] [PMC free article] [PubMed] [Google Scholar]
- Epskamp S, Waldorp LJ, Mõttus R, & Borsboom D (2018d). The Gaussian graphical model in cross-sectional and time-series data. Multivariate Behavioral Research, 53(4), 453–480. http://www.tandfonline.com/loi/hmbr20 [DOI] [PubMed] [Google Scholar]
- Franklin JC, Ribeiro JD, Fox KR, Bentley KH, Kleiman EM, Huang X, Musacchio KM, Jaroszewski A, Chang BP, & Nock MK (2017). Risk factors for suicidal thoughts and behaviors: A meta-analysis of 50 years of research. Psychological Bulletin, 143(2), 187–232. 10.1037/bul0000084 [DOI] [PubMed] [Google Scholar]
- Fried EI, & Cramer AOJ (2017). Moving forward: Challenges and directions for psychopathological network theory and methodology. Perspectives on Psychological Science, 12(6), 999–1020. DOI: [DOI] [PubMed] [Google Scholar]
- Fried EI, van Borkulo CD, Cramer AOJ, Boschloo L, Schoevers RA, & Borsboom D (2017). Mental disorders as networks of problems: A review of recent insights. Social Psychiatry and Psychiatric Epidemiology, 52(1), 1–10. 10.1007/s00127-016-1319-z [DOI] [PMC free article] [PubMed] [Google Scholar]
- Friedman J, Hastie T, & Tibshirani R (2008). Sparse inverse covariance estimation with the graphical lasso. Biostatistics, 9(3), 432–441. doi: 10.1093/biostatistics/kxm045 [DOI] [PMC free article] [PubMed] [Google Scholar]
- Friedman J, Hastie T, & Tibshirani R (2014). Graphical Lasso estimation of Gaussian graphical models. http://www-stat.stanford.edu/~tibs/glasso). [DOI] [PMC free article] [PubMed]
- García-Velázquez R, Jokela M, & Rosenstrom TH (2020). Direction of dependence between specific symptoms of depression: A non-Gaussian analysis. Clinical Psychological Science, 8(2), 240–251. doi: 10.1177/21677026119875410 [DOI] [Google Scholar]
- Gonzalez JM, Bowden CL, Katz MM, Thompson P, Singh V, Prihoda TJ, & Dahl M (2008). Development of the Bipolar Inventory of Symptoms Scale: Concurrent validity, discriminant validity and retest reliability. International Journal of Methods in Psychiatric Research, 17(4), 198–209. 10.1002/mpr.262 [DOI] [PMC free article] [PubMed] [Google Scholar]
- Grosz MP, Rohrer JM, & Thoemmes F (2020). The taboo against explicit causal inference in nonexperimental psychology. Perspectives in Psychological Science, 15(5), 1243–1255. 10.1177/1745691620921521 [DOI] [PMC free article] [PubMed] [Google Scholar]
- Guze SB (1992). Why psychiatry is a branch of medicine. Oxford University Press: Oxford, UK. [Google Scholar]
- Hallquist MN, Wright AGC, & Molenaar PCM (2019). Problems with centrality measures in psychopathology symptom networks: Why network psychometrics cannot escape psychometric theory. Multivariate Behavioral Research. 10.1080/00273171.2019.1640103 [DOI] [PMC free article] [PubMed] [Google Scholar]
- Haslbeck J, Ryan O, & Dablander F (in press-a). The sum of all fears: Comparing networks based on symptom sum-scores. Psychological Methods. [DOI] [PubMed] [Google Scholar]
- Haslbeck J, Ryan O, Robinaugh D, Waldorp L, & Borsboom D (in press-b). Modeling psychopathology: From data models to formal theories. Psychological Methods. [DOI] [PMC free article] [PubMed] [Google Scholar]
- Jones PJ, Mair P, Riemann BC, Mugno BL, & McNally RJ (2018). A network perspective on comorbid depression in adolescents with obsessive-compulsive disorder. Journal of Anxiety Disorders, 53(1), 1–8. 10.1016/j.janxdis.2017.09.008 [DOI] [PubMed] [Google Scholar]
- Kendler KS (2012). The dappled nature of causes of psychiatric illness: Replacing the organic-functional/hardware-software dichotomy with empirically based pluralism. Molecular Psychiatry, 17(4), 433–440. 10.1038/mp.2011.182 [DOI] [PMC free article] [PubMed] [Google Scholar]
- Klerman GL (1978). The evolution of a scientific nosology. In Shershow JC (Ed.), Schizophrenia: Science and practice (pp. 99–121). Cambridge, MA: Harvard University Press. [Google Scholar]
- Koenders MA, de Kleijn R, Giltay EJ, Elzinga BM, Spinhoven P, & Spijker AT (2015). A network approach to bipolar symptomatology in patients with different course types. PLoS ONE, 10(10): e0141420 doi: 10.1371/journal.pone0141420 [DOI] [PMC free article] [PubMed] [Google Scholar]
- Malgaroli M, Calderon A, & Bonanno G (2021). Networks of major depressive disorder: A systematic review. Clinical Psychology Review. 10.1016/j.cpr.2021.102000 [DOI] [PubMed] [Google Scholar]
- McNally RJ (2016). Can network analysis transform psychopathology? Behaviour Research and Therapy, 86(11), 95–104. 10.1016/j.brat.2016.06.006 [DOI] [PubMed] [Google Scholar]
- McNally RJ (2021). Network analysis of psychopathology: Controversies and challenges. Annual Review of Clinical Psychology, 17, 31–53. 10.1146/annurev-clinpsy-081219-092850 [DOI] [PubMed] [Google Scholar]
- McNally RJ, Heeren A, & Robinaugh DJ (2017a). A Bayesian network analysis of posttraumatic stress disorder symptoms in adults reporting childhood sexual abuse. European Journal of Psychotraumatology, 8(sup3), 1341276. 10.1080/20008198.2017.1341276 [DOI] [PMC free article] [PubMed] [Google Scholar]
- McNally RJ, Mair P, Mugno BL, & Riemann BC (2017b). Comorbid obsessive-compulsive disorder and depression: A Bayesian network approach. Psychological Medicine, 47(7), 1204–1214. 10.1017/Aoo33291716003287 [DOI] [PubMed] [Google Scholar]
- McNally RJ, Robinaugh DJ, Wu GWY, Wang L, Deserno MK, & Borsboom D (2015). Mental disorders as causal systems: A network approach to posttraumatic stress disorder. Clinical Psychological Science, 3(6), 836–849. Doi: 10.1177/2167702614553230 [DOI] [Google Scholar]
- Merikangas KR, Swendsen J, Hickie IB, Cui L, Shou H, Merikangas AK, … & Zipunnikov V (2019). Real-time mobile monitoring of the dynamic associations among motor activity, energy, mood, and sleep in adults with bipolar disorder. JAMA psychiatry, 76(2), 190–198. 10.1001/jamapsychiatry.2018.3546 [DOI] [PMC free article] [PubMed] [Google Scholar]
- Nierenberg AA, Kansky C, Brennan BP, Shelton RC, Perlis R, & Iosifescu DV (2013). Mitochondrial modulators for bipolar disorder: a pathophysiologically informed paradigm for new drug development. Australian & New Zealand Journal of Psychiatry, 47(1), 26–42. doi.org.ezp-prod1.hul.harvard.edu/10.1177/0004867412449303 [DOI] [PubMed] [Google Scholar]
- Nierenberg AA, Sylvia LG, Leon AC, Reilly-Harrington NA, Shesler LW, … & the Bipolar CHOICE Study Group. (2014). Clinical and Health Outcomes Initiative in Comparative Effectiveness for Bipolar Disorder (Bipolar CHOICE): A pragmatic trial of complex treatment for a complex disorder. Clinical Trials, 11(1), 114–117.https://doi-org.ezp-prod1.hul.harvard.edu/10.1177/1740774513512184 [DOI] [PMC free article] [PubMed] [Google Scholar]
- Pearl J (2011). The mathematics of causal relations. In Shrout PE, Keyes KM, & Ornstein K (Eds.), Causality and psychopathology: Finding the determinants of disorders and their cures (pp. 47–65). Oxford, UK: Oxford University Press. [Google Scholar]
- Pearl J, & Mackenzie D (2018) The book of why: The new science of cause and effect. New York, NY: Basic Books. [Google Scholar]
- Regier DA, Narrow WE, Clarke DE, Kraemer HC, Kuramoto SJ, Kuhl EA, & Kupfer DJ (2013). DSM-5 field trials in the United States and Canada, Part II: Test-retest reliability of selected categorical diagnoses. American Journal of Psychiatry, 170(1), 59–70. 10.1176/appi.ajp.2012.12070999 [DOI] [PubMed] [Google Scholar]
- Robinaugh D, Haslbeck J, Ryan O, Fried EI, & Waldorp L (2020a). Invisible hands and fine calipers: A call to use formal theory as a toolkit for theory construction. https://psyarxiv.com/ugz7y [DOI] [PMC free article] [PubMed]
- Robinaugh DJ, Hoekstra RHA, Toner ER, & Borsboom D (2020b). The network approach to psychopathology: A review of the literature 2008–2018 and an agenda for future research. Psychological Medicine, 50(3), 353–366. 10.1017/S0033291719003404 [DOI] [PMC free article] [PubMed] [Google Scholar]
- Robinaugh DJ, Millner AJ, & McNally RJ (2016). Identifying highly influential nodes in the complicated grief network. Journal of Abnormal Psychology, 125(6), 747–757. 10.1037/abn0000181 [DOI] [PMC free article] [PubMed] [Google Scholar]
- Ryan O, Bringmann L, & Schuurman NK (2019). The challenge of generating causal hypotheses using network models. https://psyarxiv.com/ryg69
- Sachs K, Perez O, Pe’er D, Lauffenburger DA, & Nolan GP (2005). Causal protein-signaling networks derived from multiparameter single-cell data. Science, 308(5721), 523–529. 10.1126/science.1105809 [DOI] [PubMed] [Google Scholar]
- Scutari M (2010). Learning Bayesian networks with the BNLEARN package. Journal of Statistical Software, 35(3), 1–22. http://www.jstatsoft.org/21603108 [Google Scholar]
- Terluin B, de Boer MR, & de Vet HCW (2016). Differences in connection strength between mental symptoms might be explained by differences in variance. PLoS ONE, 11(11), e0155205. doi: 10.1371/journal.pone.0155205 [DOI] [PMC free article] [PubMed] [Google Scholar]
- Van Meter AR, Burke C, Youngstrom EA, Faedda GL, & Correll CU (2016). The bipolar prodrome: meta-analysis of symptom prevalence prior to initial or recurrent mood episodes. Journal of the American Academy of Child & Adolescent Psychiatry, 55(7), 543–555. 10.1016/j.jaac.2016.04.017 [DOI] [PubMed] [Google Scholar]
- Weintraub MJ, Schneck CD, & Miklowitz DJ (2020). Network analysis of mood symptoms in adolescents with or at high risk for bipolar disorder. Bipolar Disorders, 22(2), 128–138. 10.1111/bdi.12870 [DOI] [PMC free article] [PubMed] [Google Scholar]
- Williams DR, & Rast P (2020). Back to basics: Rethinking partial correlation network methodology. British Journal of Mathematical and Statistical Psychology, 73(2), 187–212. 10.1111/bmsp.12173 [DOI] [PMC free article] [PubMed] [Google Scholar]
- Williams DR, Rhemtulla M, Wysocki AC, & Rast P (2019). On nonregularized estimation of psychological networks. Multivariate Behavioral Research, 54(5), 719–750. 10.1080/00273171.2019.1575716 [DOI] [PMC free article] [PubMed] [Google Scholar]
Associated Data
This section collects any data citations, data availability statements, or supplementary materials included in this article.