

Summary
Mapping the spatial distribution and molecular identity of constituent cells is essential for understanding tissue dynamics in health and disease. We lack a comprehensive map of human distal airways, including the terminal and respiratory bronchioles (TRBs) implicated in respiratory diseases1–4. Here, using spatial transcriptomics and single cell profiling of microdissected distal airways, we identify previously uncharacterized, molecularly distinct TRB cell types. These include airway associated LGR5+ fibroblasts and TRB-specific alveolar type-0 (AT0) and TRB-secretory cells (TRB-SCs). Connectome maps and organoid-based co-cultures reveal that LGR5+ fibroblasts form a signalling hub in airway niche. AT0 and TRB-SCs are conserved in primates and emerge dynamically during human lung development. Using non-human primate lung injury model, and human organoids and tissue specimens, we show that alveolar type-2 cells (AT2) in regenerating lungs transiently acquire an AT0 state from which they can differentiate into either alveolar type-1 cells or TRB-SCs. This differentiation program is distinct from that identified in the mouse lung5–7. Our study revealed mechanisms driving bi-potential AT0 cell-state differentiation into normal or pathological states. In sum, our study revises human lung cell maps and lineage trajectories, and implicates a novel epithelial transitional state in primate lung regeneration and disease.
Human diseases are often accompanied by either ectopic or aberrant cell types or cell states. Recent technological advances in cell profiling at single-cell resolution have enabled us to comprehensively map a multitude of cells and their molecular features in complex tissues8–10. To date, most lung cell mapping studies have relied on dissociation of biopsy samples or cells collected from bronchial brushings, which do not represent the entirety of the lung and lack detailed spatial resolution11–18. Importantly, the cellular composition of the human terminal and respiratory bronchioles (TRBs) remain elusive. TRBs are located at the junction between airways and alveoli and constitute a transition zone thought to be critically involved in many respiratory diseases including idiopathic pulmonary fibrosis (IPF) and chronic obstructive pulmonary disease (COPD)1–3,19–21. Because TRBs are extremely small in both length (<2mm) and diameter (<1mm) it has been challenging to capture the cells present in these regions22 which, significantly, are quite distinct anatomically from the junctional region in the mouse lung.
Molecular survey of human distal lung
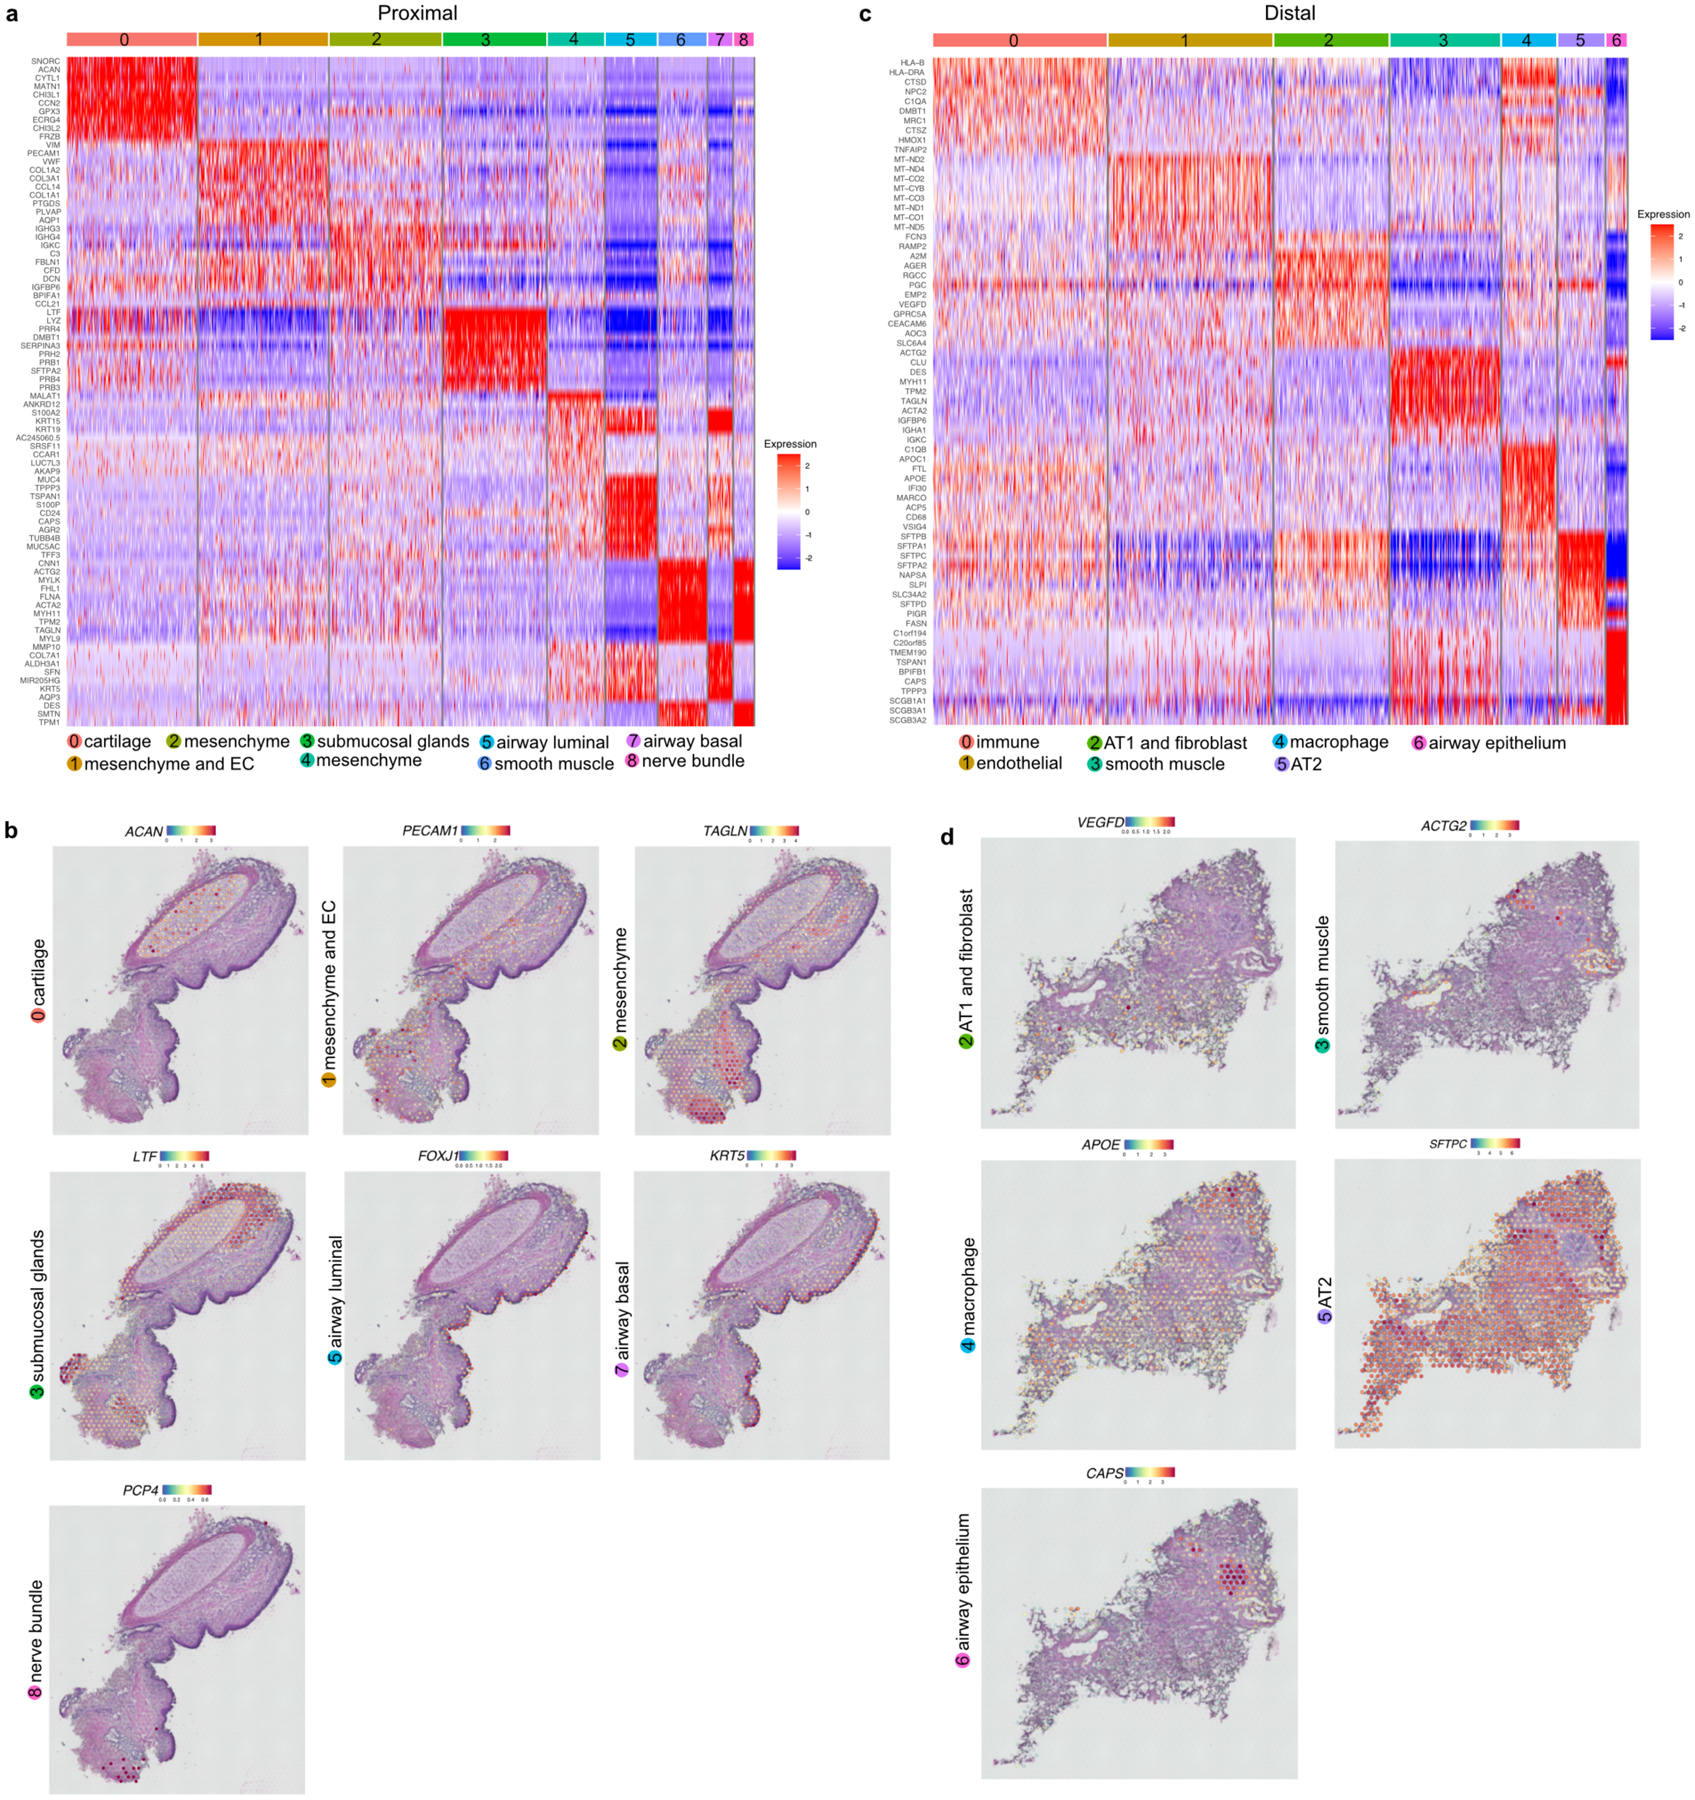
To establish molecularly and spatially defined cellular maps of human airways we undertook two parallel approaches. First, we performed spatial transcriptomic (ST) profiling of lung sections using Visium technology (Fig. 1a). Unsupervised clustering of ST spots on sections with a lobar bronchus generated 9 clusters including epithelial, mesenchymal, smooth muscle, cartilage, endothelial, and neuronal lineages (Fig. 1a, Extended Data Fig. 1a,b). We found that epithelial clusters 3, 5, and 7 correspond to airway submucosal glands, and basal and luminal epithelium, respectively (Fig. 1a, Extended Data Fig. 1a,b). Similarly, ST spots on sections of distal lung showed 7 clusters expressing markers characteristic of airway and alveolar epithelial, mesenchymal, smooth muscle, and endothelial lineages (Fig. 1a, Extended Data Fig. 1c,d).
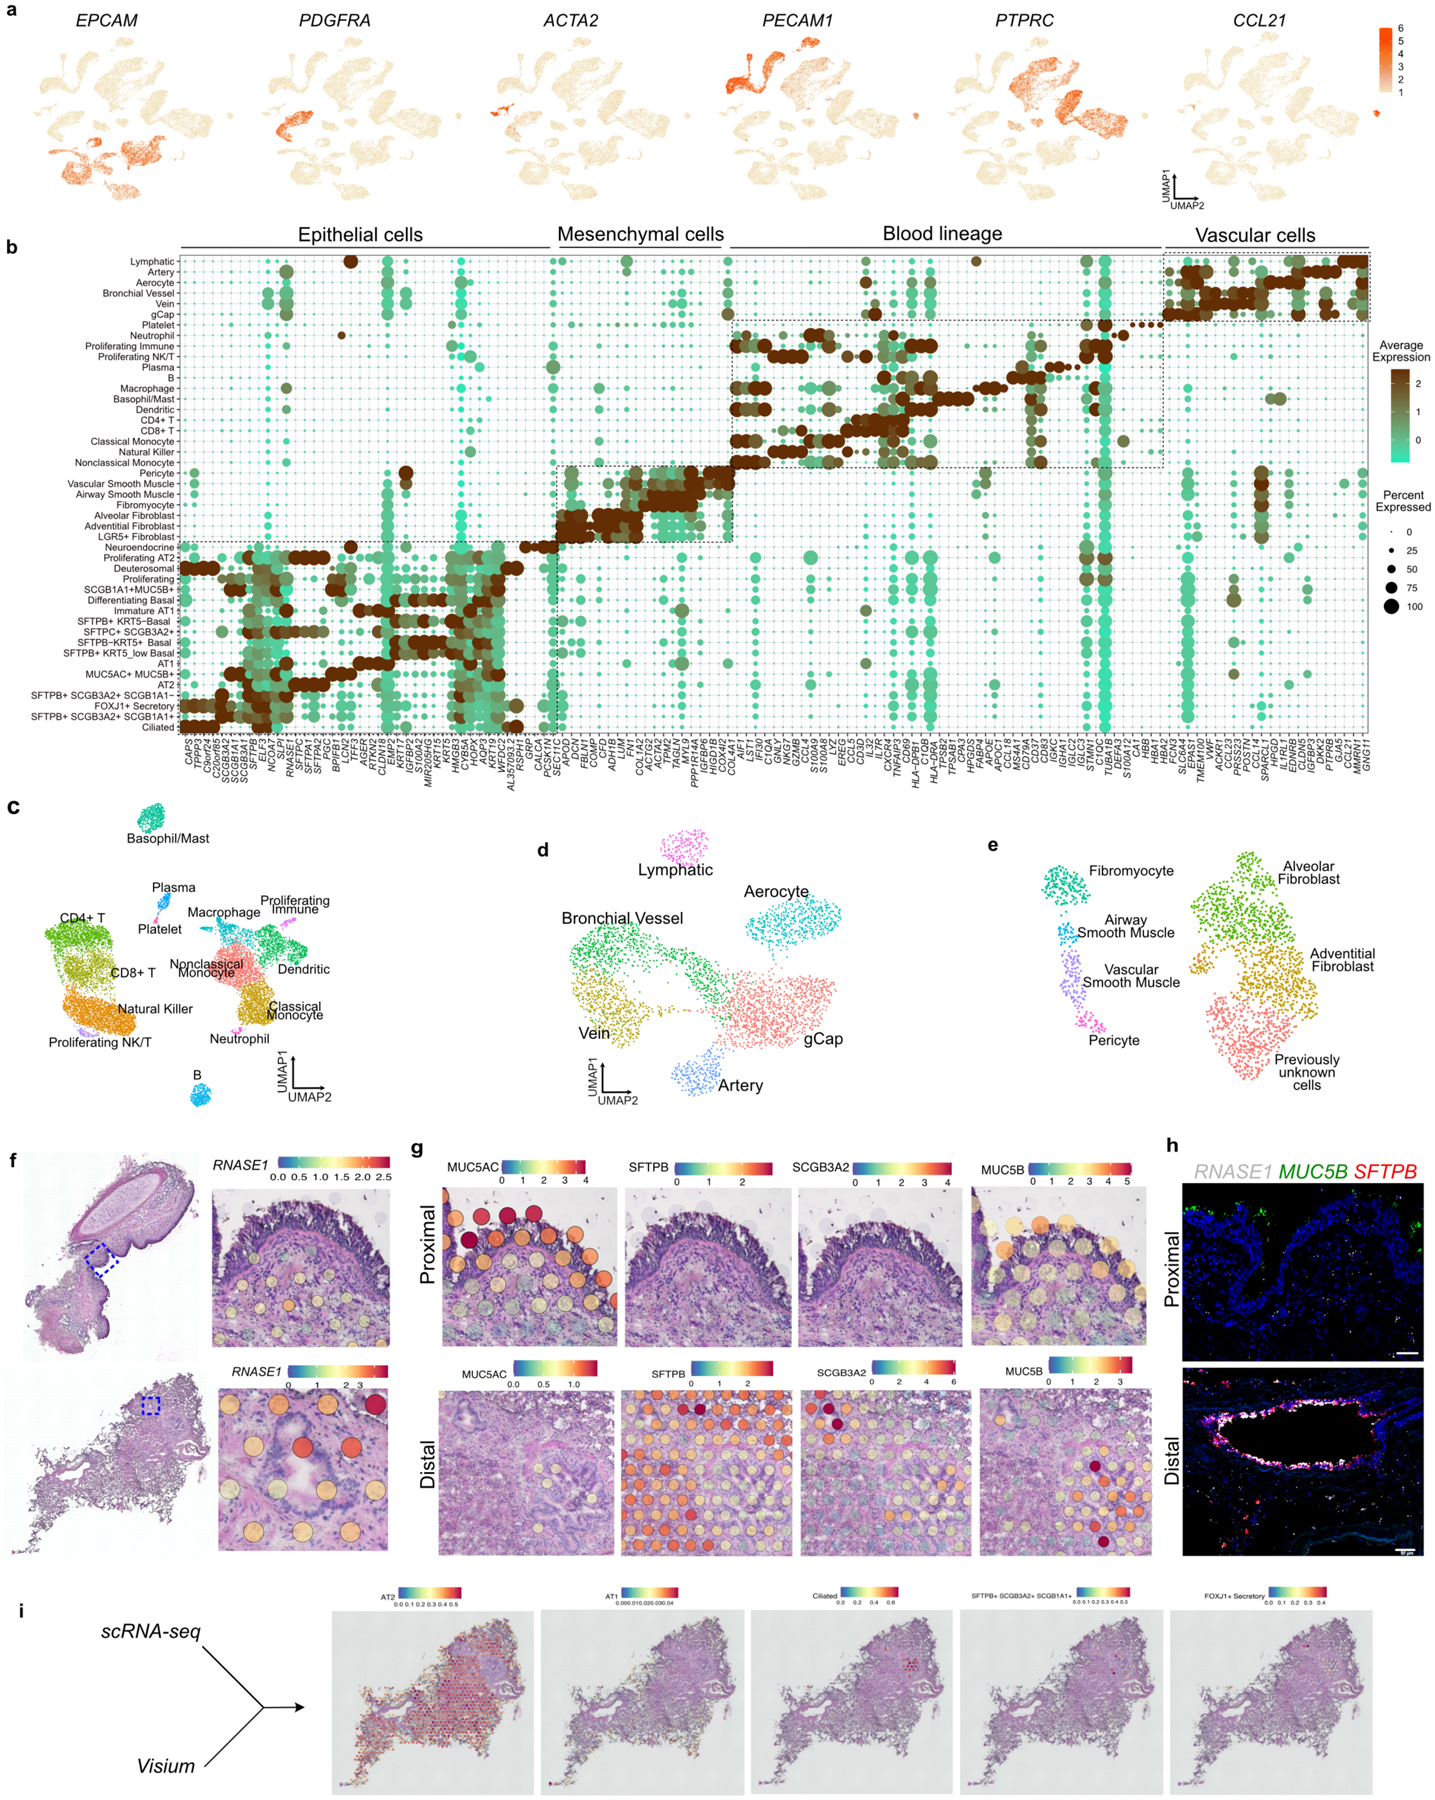
Figure. 1. Spatial and single-cell transcriptomics reveal previously uncharacterized epithelial cell-types in distal airways.
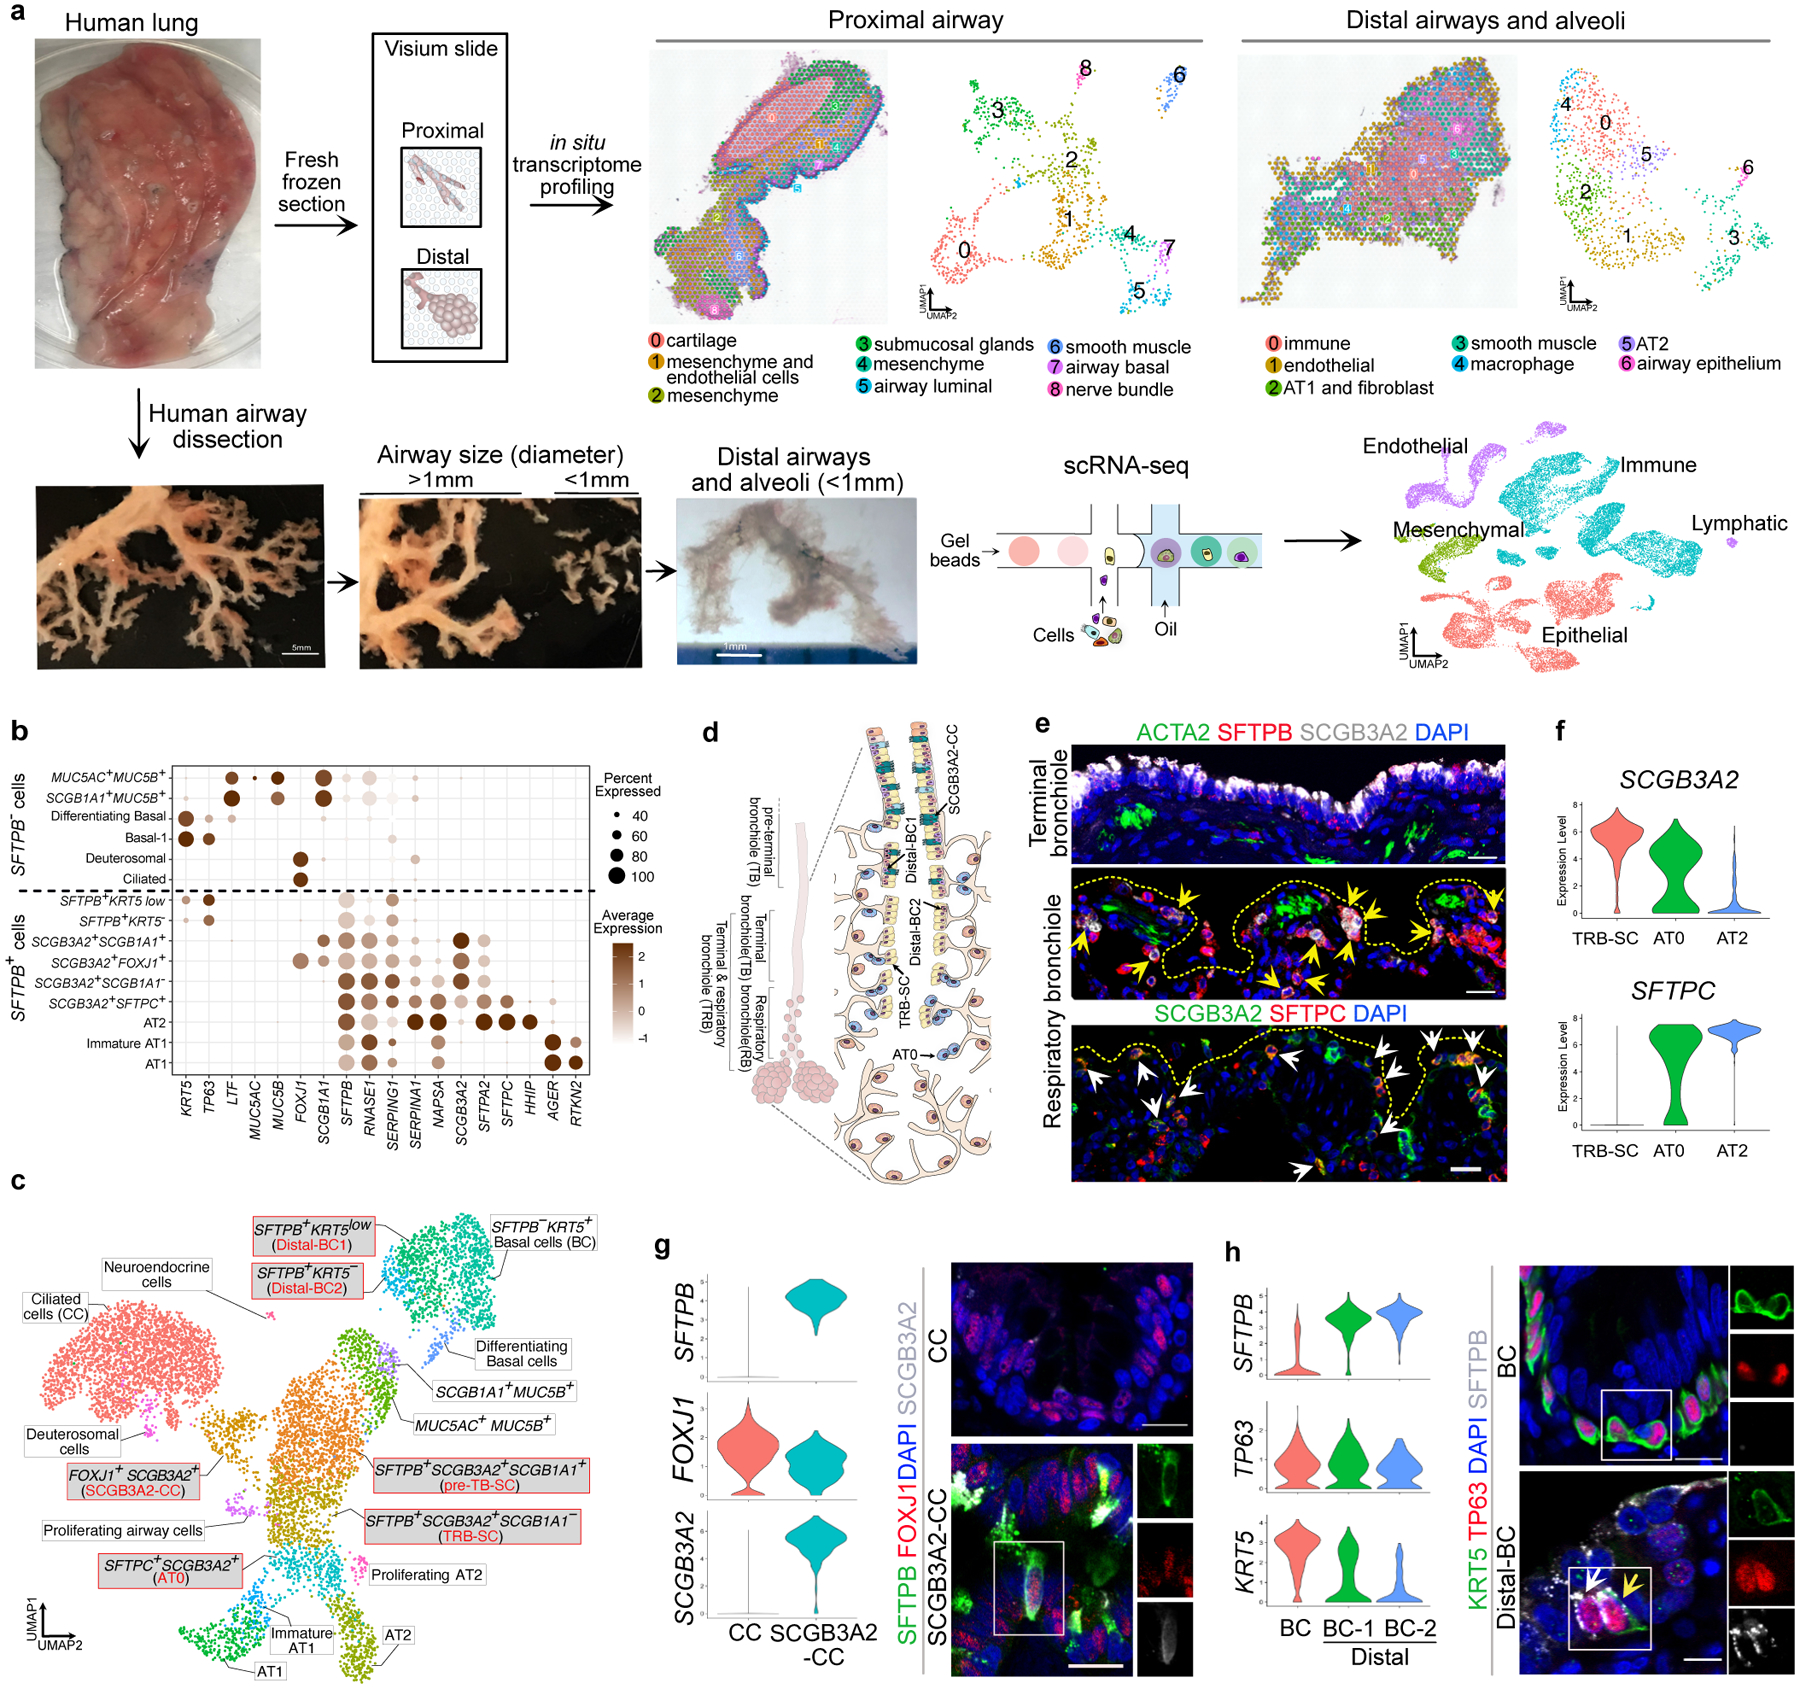
a. Schematic representation of experimental workflow for spatial transcriptomics (ST) (left upper panel) and distal airway dissection, dissociation, and capture for scRNA-seq (left bottom panel). In situ (left) and UMAP visualization of ST spot clusters obtained from the proximal airway and distal lung (right upper panel). UMAP visualization of major cell classes profiled by scRNA-seq (right bottom panel). b. Dot plot shows distal and proximal airway cell specific markers. c. UMAP indicates the annotation of epithelial cell types. d. Schematic representation of human distal airways. e. Immunostaining for ACTA2 (green), SFTPB (red) and SCGB3A2 (grey) (top and middle panels); SCGB3A2 (green) and SFTPC (red) (bottom panel). Top panel: terminal bronchiole and bottom two panels: respiratory bronchioles. Yellow arrows (middle panel) and white arrows (bottom panel) indicate SFTPB+ SCGB3A2+ and AT0 cells, respectively. Scale bar 20μm. Top and middle panels: maximum intensity projection of zstacks. f. Violin plots show the expression of indicated genes in TRB-SC, AT0 and AT2s. g. Violin plots show the expression of indicated genes in ciliated and SCGB3A2+-CC (left) and co-staining for SFTPB (green), FOXJ1 (red) and SCGB3A2 (grey) (right) in proximal (upper image) and distal airway (bottom image). Scale bar 20 μm (top), 10 μm (bottom). h. Violin plots show the expression of indicated genes in airway basal, distal-BC1 and distal-BC2 (left) and immunostaining for KRT5 (green), TP63 (red) and SFTPB (grey) in proximal (upper image) and distal airways (bottom image). White arrow indicates distal-BC1 and yellow arrow indicates distal-BC2. Scale bars 20 μm (top), 10 μm (bottom). g, h: Insets indicate individual channels of regions marked by white boxes. DAPI-nuclei (blue).
Second, we microdissected distal airways (<1 mm in diameter and contiguous with alveoli) from surrounding tissue (Fig. 1a). Following dissociation, single-cell transcriptome profiling was performed. Data from three donors were integrated and dimensional reduction was performed using Uniform Manifold Approximation and Projection (UMAP). We identified 21,700 cells clustered into 45 populations from endothelial, immune, epithelial and mesenchymal lineages (Fig. 1a, Extended Data Fig. 2a,b). The majority of the known endothelial (artery, vein, lymphatic, bronchial blood vessel, aerocytes and gCap) and immune (classical and non-classical monocyte, macrophage, neutrophil, plasma, basophil, B, CD4+ and CD8+ T, NK, and dendritic) and mesenchymal cell-types were captured11 (Extended Data Fig. 2b-e, Supplementary Table 1).
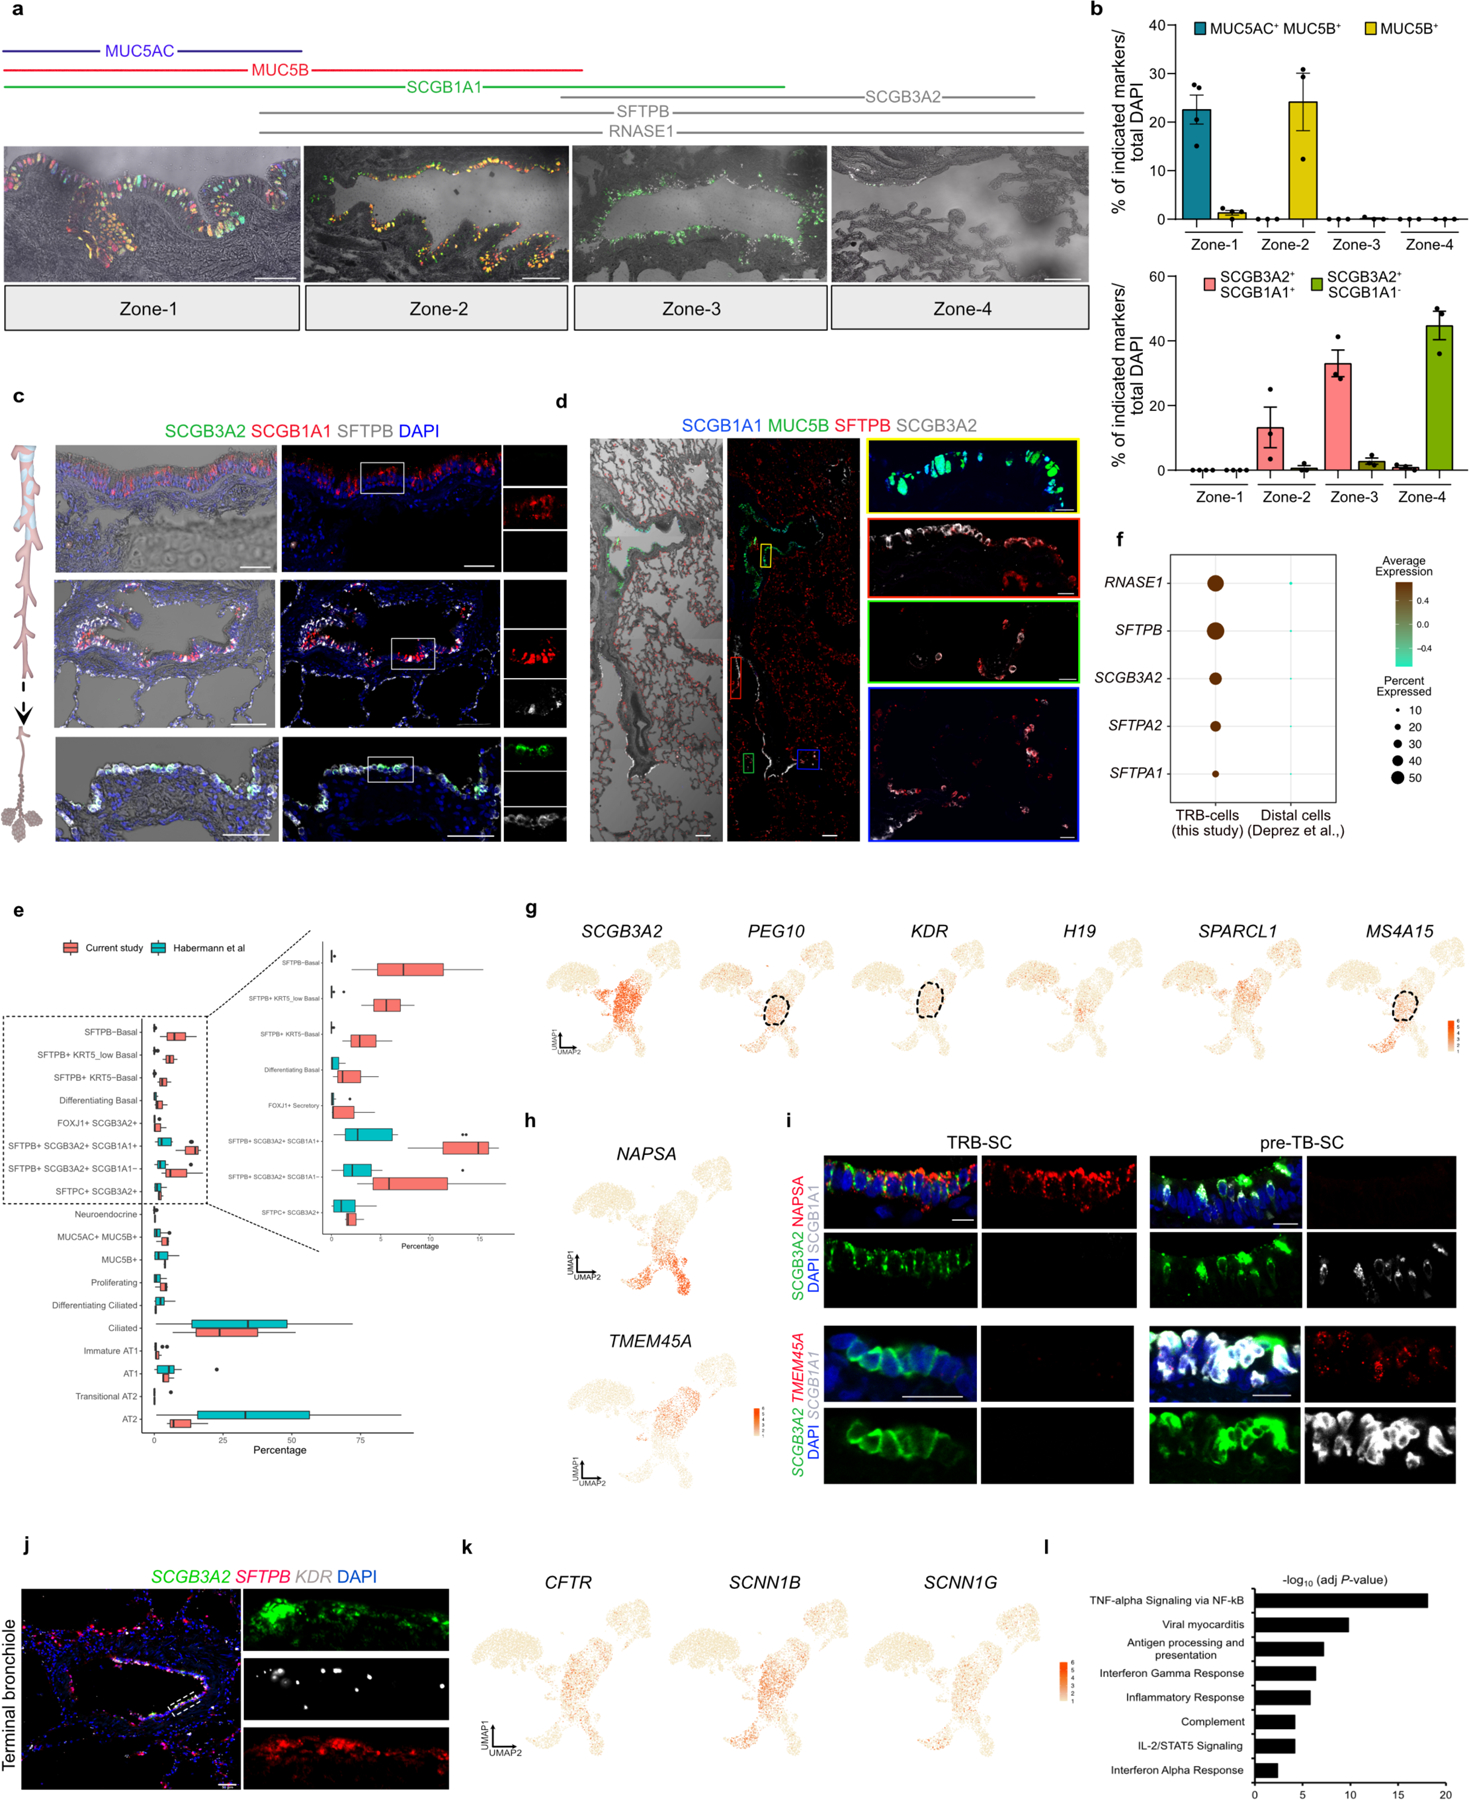
We identified 18 distinct epithelial cell clusters that segregated into two distinct populations based on the presence or absence of SFTPB expression. We refer to these as SFTPB− and SFTPB+ populations (Fig. 1b, Extended Data Fig. 2b). Transcripts for MUC5AC, MSLN and MUC13 were enriched in SFTPB− population whereas SFTPB, SFTPA1, SFTPA2, SCGB3A2, RNASE1 and NAPSA were in SFTPB+ populations (Fig. 1b, Supplementary Table 1). A direct comparison of the expression pattern of these genes with our above ST data and integrated analysis of scRNA-seq and ST data revealed that SFTPB− population markers correlated with proximal airways while those of the SFTPB+ population were present in distal airways (Fig. 1b, Extended Data Fig. 2f–i). In situ hybridization (FISH) for RNASE1, MUC5B, and SFTPB further validated these findings (Extended Data Fig. 2h). Immunostaining for SCGB3A2, SCGB1A1, MUC5AC, MUC5B, and SFTPB on lung sections and quantification confirmed that SFTPB+ population markers were exclusively present in distal bronchioles. Further, the expression pattern of SFTPB− and SFTPB+ population markers segregated airways into 4 histologically distinct zones (Extended Data Fig. 3a–d). Some of the cell types belonging to the SFTPB+ populations and located in TRBs are entirely absent from healthy human lung scRNA-seq data from previous studies (Fig. 1c, Extended Data Fig. 3e,f)12,23. Together, these data identify region-specific markers and previously uncharacterized cell types in human airways.
Unique distal airway epithelial cells
We found epithelial cell types that co-expressed SFTPB but differ in expression of SCGB1A1, FOXJ1, SCGB3A2 and SFTPC (Fig. 1b,c, Extended Data Fig. 2b). Further analysis revealed that each of these cell types show specific localization patterns within distal airways. First, one population that expresses SFTPB and SCGB3A2 but lacks SCGB1A1, FOXJ1, and SFTPC, is specific to TRBs and we termed them TRB-secretory cells (TRB-SCs) (Fig. 1c–e, Extended Data Fig. 3a–f). SFTPB+SCGB3A2+SCGB1A1+ cells are localized to distal airways proximal to TBs and therefore we refer to these cells as pre-TB secretory cells (pre-TB-SCs) (Fig. 1b–d, Extended Data Fig. 3a–d). They lack MUC5AC and MUC5B and their localization is specific to pre-TBs, necessitating new nomenclature. Expression of PEG10, MS4A15, NAPSA and H19, or lack of SPARCL1 and TMEM45A among others, distinguishes TRB-SCs from pre-TB-SCs (Fig. 1b, Extended Data Fig. 3g–i). Both TRB-SCs and pre-TB-SCs share many common transcripts for proteins known to regulate fluid balance (CFTR, SCNN1G and SCNN1B), VEGFR signalling (KDR) (Extended Data Fig. 3j,k). Pathway enrichment analysis reveals that TRB-SCs exhibit immunomodulatory functions such as inflammatory response, TNF-α signalling, and antigen processing and presentation (Extended Data Fig. 3l).
The third population is marked by the expression of SFTPB, SCGB3A2, and SFTPC and is associated with alveolar septae contiguous with respiratory bronchioles and rarely in distal alveolar sacs (Fig. 1d-f, Extended Data Fig. 4a-c). This population shares markers characteristic of both alveolar (SFTPC, AGER), and airway epithelial cells (SCGB3A2 and SOX2) (Fig. 1b, f, Extended Data Fig. 4a-d). Analysis of these cells for transcriptional regulators showed an overlap with those expressed by AT2s (ZNF385B, TFCP2L1 and ETV1) (Extended Data Fig. 4e). As these cells share transcriptional profiles and localization with canonical alveolar epithelial cells (AT2 and AT1), we have termed them type-0 alveolar epithelial cells (AT0s) (Fig. 1c-f, Extended Data Fig. 4a-e). Fourth, we observed a secretoryciliated “hybrid” cell type, characterized by the co-expression of SCGB3A2, SFTPB, and FOXJ1 (Extended Data Fig. 4f). These “hybrid” cells are distinct from differentiating ciliated (or deuterosomal) cells as they lack the expression of CDC20B and NEK2 among others23 (Extended Data Fig. 4f,g). Immunostaining and quantification for FOXJ1, SCGB3A2, and SFTPB reveals their localisation specific to zone-3 and 4 (Fig. 1c,d,g, Extended Data Fig. 4h). We refer to these cells as SCGB3A2-ciliated cells (SCGB3A2-CCs).
We observed four types of basal cell (BC) populations. One expresses high levels of TP63, KRT5, KRT17 and IL33, similar to previously known airway BCs (Fig. 1b,h, Extended Data Fig. 4i)11,15,23. A second population has reduced expression of TP63 and increased expression of secretory cell markers, such as LTF, SCGB1A1 and SOX21, suggesting that it is comprised of differentiating BCs (Extended Data Fig. 4j)11,12,23. The remaining two BC populations coexpress SFTPB and TP63 but they show decreasing (KRT5, AQP5, KRT15 and IL33) and increasing (SLC34A2, BST2, RNASE1, NKX2–1 and MUC1) expression pattern of various transcripts (Fig. 1b,f, Extended Data Fig. 4k). Based on immunolocalization and quantification analysis we referred to these cells as distal basal cell-1 (distal-BC-1) and distal basal cell-2 (distal-BC-2) (Fig. 1c,d,h, Extended Data Fig. 4l). Integrated transcriptomic analysis reveals that KRT5− distal-BC2 is distinct from the pathological basaloid cells found in IPF (Extended Data Fig. 4m)5,12–14. Significantly, all the above described cell types were missing from scRNA-seq data from previous studies of whole lung samples that contained all regions of the airways (Extended Data Fig. 4n,o)23. Additionally, transcription factor regulon analysis reveals distinct transcriptional networks in the above-described cells (Extended Data Fig. 5a,b).
We compared the phenotypic properties of distal and proximal airway epithelial cells ex vivo (Extended Data Fig. 6a). While there was no significant difference in colony forming efficiency, these two BC subsets maintained their respective gene expression signatures (Extended Data Fig. 6b–f). Basal cells from distal regions expressed SFTPB and RNASE1, and reduced KRT5 expression levels similar to their in vivo counterparts (Extended Data Fig. 6d,f). Further, air-liquid interface (ALI) based differentiation cultures revealed that proximal and distal basal cells generate luminal differentiated cells that correspond to their respective regions, suggesting that each possesses unique molecular programs which they maintain ex vivo (Extended Data Fig. 6e,g). Proximal and distal basal cell progeny in ALI differentiation cultures also maintain epithelial thickness and cilia length corresponding to their in vivo counterparts (Extended Data Fig. 6h–j). Taken together, we identify previously uncharacterized molecularly, spatially, and phenotypically distinct basal cell subsets in human lungs.
LGR5 marks a distinct mesenchymal niche
Multiple mesenchymal cell populations have been shown to occupy distinct niches and provide inductive signals to neighbouring cells in the lung11,12,24. We annotated fibroblasts in our scRNA-seq data by comparing them to previously described human lung reference datasets11. We observed seven previously identified populations: alveolar, adventitial and myofibroblasts, fibromyocytes, pericytes, and vascular and airway smooth muscle cells. Interestingly, we identified a fibroblast cluster that is unique to our dataset (Fig. 2a). These fibroblasts are significantly enriched for LGR5, F13A1, PDGFRA, WNT5A, RSPO1, DLL1, TGFBI and DIO2 (Fig. 2b,c). Analysis of ST data revealed the expression of genes, including FGF14, enriched in LGR5+ fibroblasts around the airways but not in alveolar regions (Extended Data Fig. 7a). RNA-FISH showed that LGR5+ fibroblasts are located in the sub-epithelial mesenchyme of airways including TRBs (Fig. 2d, Extended Data Fig. 7b,c). Pathway analysis shows that LGR5-expressing cells are enriched for WNT, PDGF, BDNF and TGFβ signalling pathways (Extended Data Fig. 7d). Further analysis revealed that LGR5+ fibroblasts are a source of FGF (FGF2, 7,10 and 14), BMP (BMP2, 4, 5, and 7), and WNT pathway ligands that signal through their cognate receptors (FGFR2–3, FZD6, and BMPR1B, and BMPR2) expressed in distal-BC12, and TRB-SCs. Conversely, distal-BC-1, distal-BC-2, and TRB-SCs express PDGF ligands whose receptors are expressed by the LGR5+ fibroblasts. These data suggest bi-directional signalling centred on LGR5+ fibroblasts and distal-BC1, distal-BC-2, and TRB-SCs (Extended Data Fig. 7d,e). Regulon activity further suggests that LGR5+ fibroblasts exhibit unique transcriptional regulation (Extended Data Fig. 7f,g).
Fig. 2. LGR5 marks a unique fibroblast population in airways.
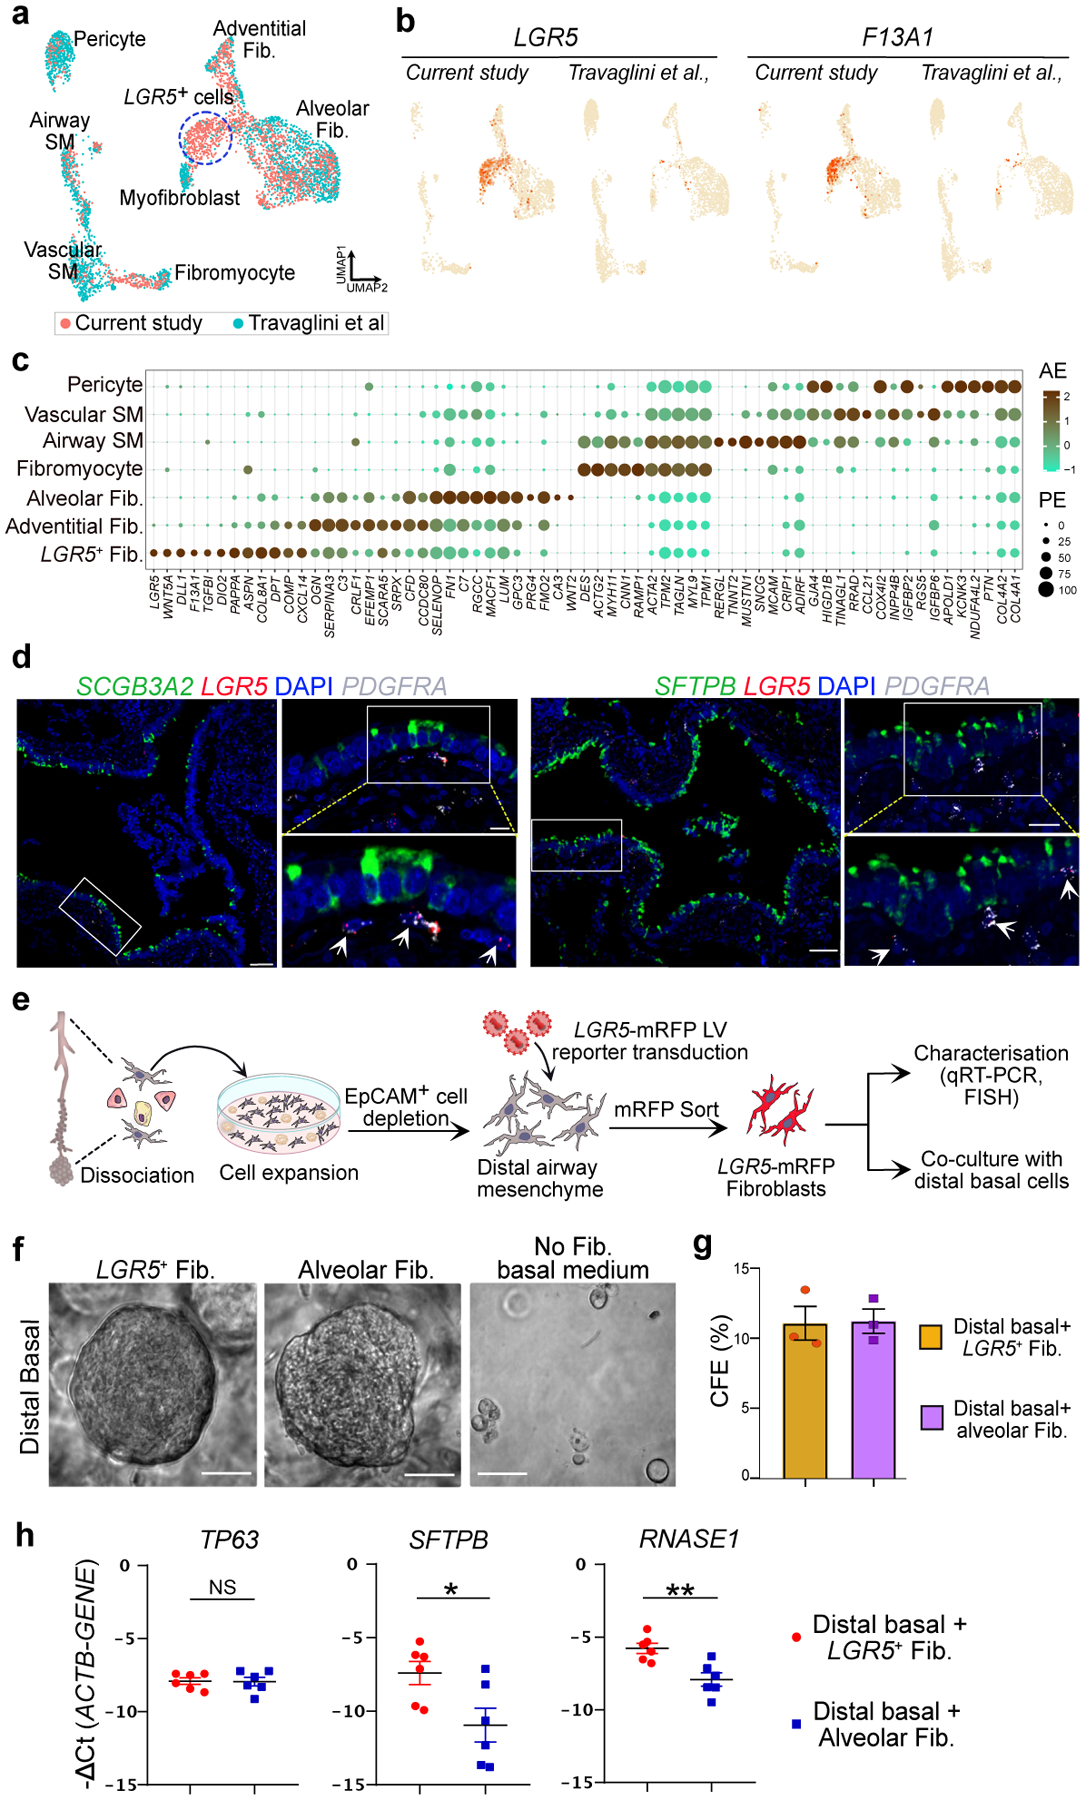
a. UMAP shows integration of mesenchymal cells from this study and data from Travaglini et al. b. UMAP shows the expression of LGR5 and F13A1 in the integrated dataset specifically in the newly identified cell population in this study. c. Dot plot show the relative expression of markers of mesenchymal cell types detected in this study. AE refers to Average Expression and PE is percent expressed. d. Representative RNA-FISH images showing the expression of SCGB3A2 (green), LGR5 (red) and PDGFRA (grey) (top) and SFTPB (green), LGR5 (red) and PDGFRA (grey) (bottom). Scale bar 20 μm and 50 μm. DAPI stains nuclei (blue). Insets show magnified regions. Maximum intensity projection of z-stacks are shown. e. Schematic depicting experimental workflow for LRG5+ fibroblast isolation, culture, characterisation and co-culture. f. Representative brightfield images of human basal cell organoids from distal airways cultured in indicated conditions at day 8. Scale bar: 500 μm. g. Quantification of the colony formation efficiency (CFE) of human distal basal organoids grown in indicated conditions at day 8. Data is presented as mean ± SEM. NS (p = 0.9231) (unpaired two-tailed t-test with Welch’s correction) (n=3). h. Relative mRNA expression of TP63, SFTPB, and RNASE1 in organoids that are grown in fibroblast co-cultures. Data is presented as mean ± SEM. NS (p = 0.9181), * (p = 0.0321), and ** (p = 0.0043) (unpaired two-tailed t-test with Welch’s correction) (n=6). In panels a and c, SM refers to smooth muscle.
Next, we sought to determine whether LGR5+ fibroblasts residing in the distal airways support the growth and maintenance of neighbouring BCs. To identify and purify LGR5+ fibroblasts, we generated and stably introduced a LGR5-promoter driven reporter construct (LGR5-mRFP) into fibroblasts derived from distal airways (Fig 2e, Extended data Fig. 8a,b, Supplementary Figure 1). LGR5-mRFP positive fibroblasts showed similar gene expression profiles to their native tissue counterparts (LGR5, WNT5A). Purified cells do not express alveolar fibroblast marker (CA3) indicating that our transgenic construct faithfully recapitulates its expression (Fig 2c,e, Extended data Fig. 8c,d). Co-culture of distal-BCs with LGR5-mRFP+ fibroblasts alone was sufficient to support their growth and to maintain their molecular characteristics, suggesting that LGR5+ fibroblasts serve as a niche for distal airway epithelial cells (Fig. 2e–h, Extended data Fig. 8e). Additionally, co-culture with LGR5-mRFP+ fibroblasts was sufficient to induce expression of distal airway markers in AT2s (Extended data Fig. 8f).
Distal airway cells in developing lungs
Human lung development goes through four distinct morphogenetic stages during gestation and postnatal development25–27. Recent studies have shown cells co-expressing SCGB3A2 and SFTPB in fetal lungs28. To ascertain the developmental emergence of the newly identified distal airway cells, we re-analysed scRNA-seq data set from human fetal lungs collected at 11.5 and 18 weeks post-conception28. Although respiratory bronchioles cannot be morphologically identified at these stages, we found cells analogous to TRB-SCs expressing SCGB3A2 and SFTPB (Extended Data Fig. 9a). However, other cell types such as SCGB3A2-CC, distal-BC1, distal-BC-2 and SFTPC+SCGB3A2+ cells were not detected (Extended Data Fig. 9a). We performed immunostaining on 19–20 weeks old fetal lungs and confirmed the presence of SFTPB+SCGB3A2+ cells in airways (Extended Data Fig. 9b,c). Unlike in adult lungs, SCGB3A2+ secretory cells were found lining intrapulmonary cartilaginous airways and were sparsely present even in extrapulmonary bronchi (Extended Data Fig. 9c,d). Similar to adult lungs, LGR5+ fibroblasts were lining the airways of fetal lungs (Extended data Fig. 9e). In postnatal lungs (7–12 months old) we found adult lung equivalent anatomic structures similar to pre-TBs and TRBs (marked by SCGB1A1, SCGB3A2, and SFTPB) (Extended Data Fig. 9f–h). Additionally, marker analysis revealed the presence of TRB-SCs (SFTPB, SCGB3A2), distal-BC-1 (KRT5+SFTPB+TP63+), distal-BC-2 (KRT5−SFTPB+TP63+), SCGB3A2-CCs (SFTPB, SCGB3A2 and FOXJ1) and AT0s (SFTPC+SCGB3A2+) (Extended Data Fig. 9i–m). Together, the localization patterns of all these cell populations are similar to those of adult tissues in postnatal lungs (Figs. 1, Extended Data Fig. 9g–m).
Organoids reveal human AT0 cell dynamics
Using multiple computational prediction algorithms (scVelo, Monocle3, PAGA, scEpath, and slingshot), we observed a strong cell trajectory originating from the AT2 population into mature AT1s or TRB-SCs through AT0s (Fig. 3a, Extended data Fig. 10a–d)29–34. Further analysis using MuTrans revealed that AT0s have high entropy and therefore lower stability (Extended data Fig. 10e)35. Differential gene expression signatures associated with pseudotime analysis revealed that AT0 markers appear transiently during transition of AT2 to AT1 or TRB-SCs (Extended data Fig. 10f–h). Together, in silico predictions suggest that AT2s can convert to AT0s, which can then generate both AT1s and TRB-BCs (Fig. 3a,b, Extended data Fig. 10).
Fig. 3. Dynamics of AT0 and unique cell trajectories in human alveolar epithelium.
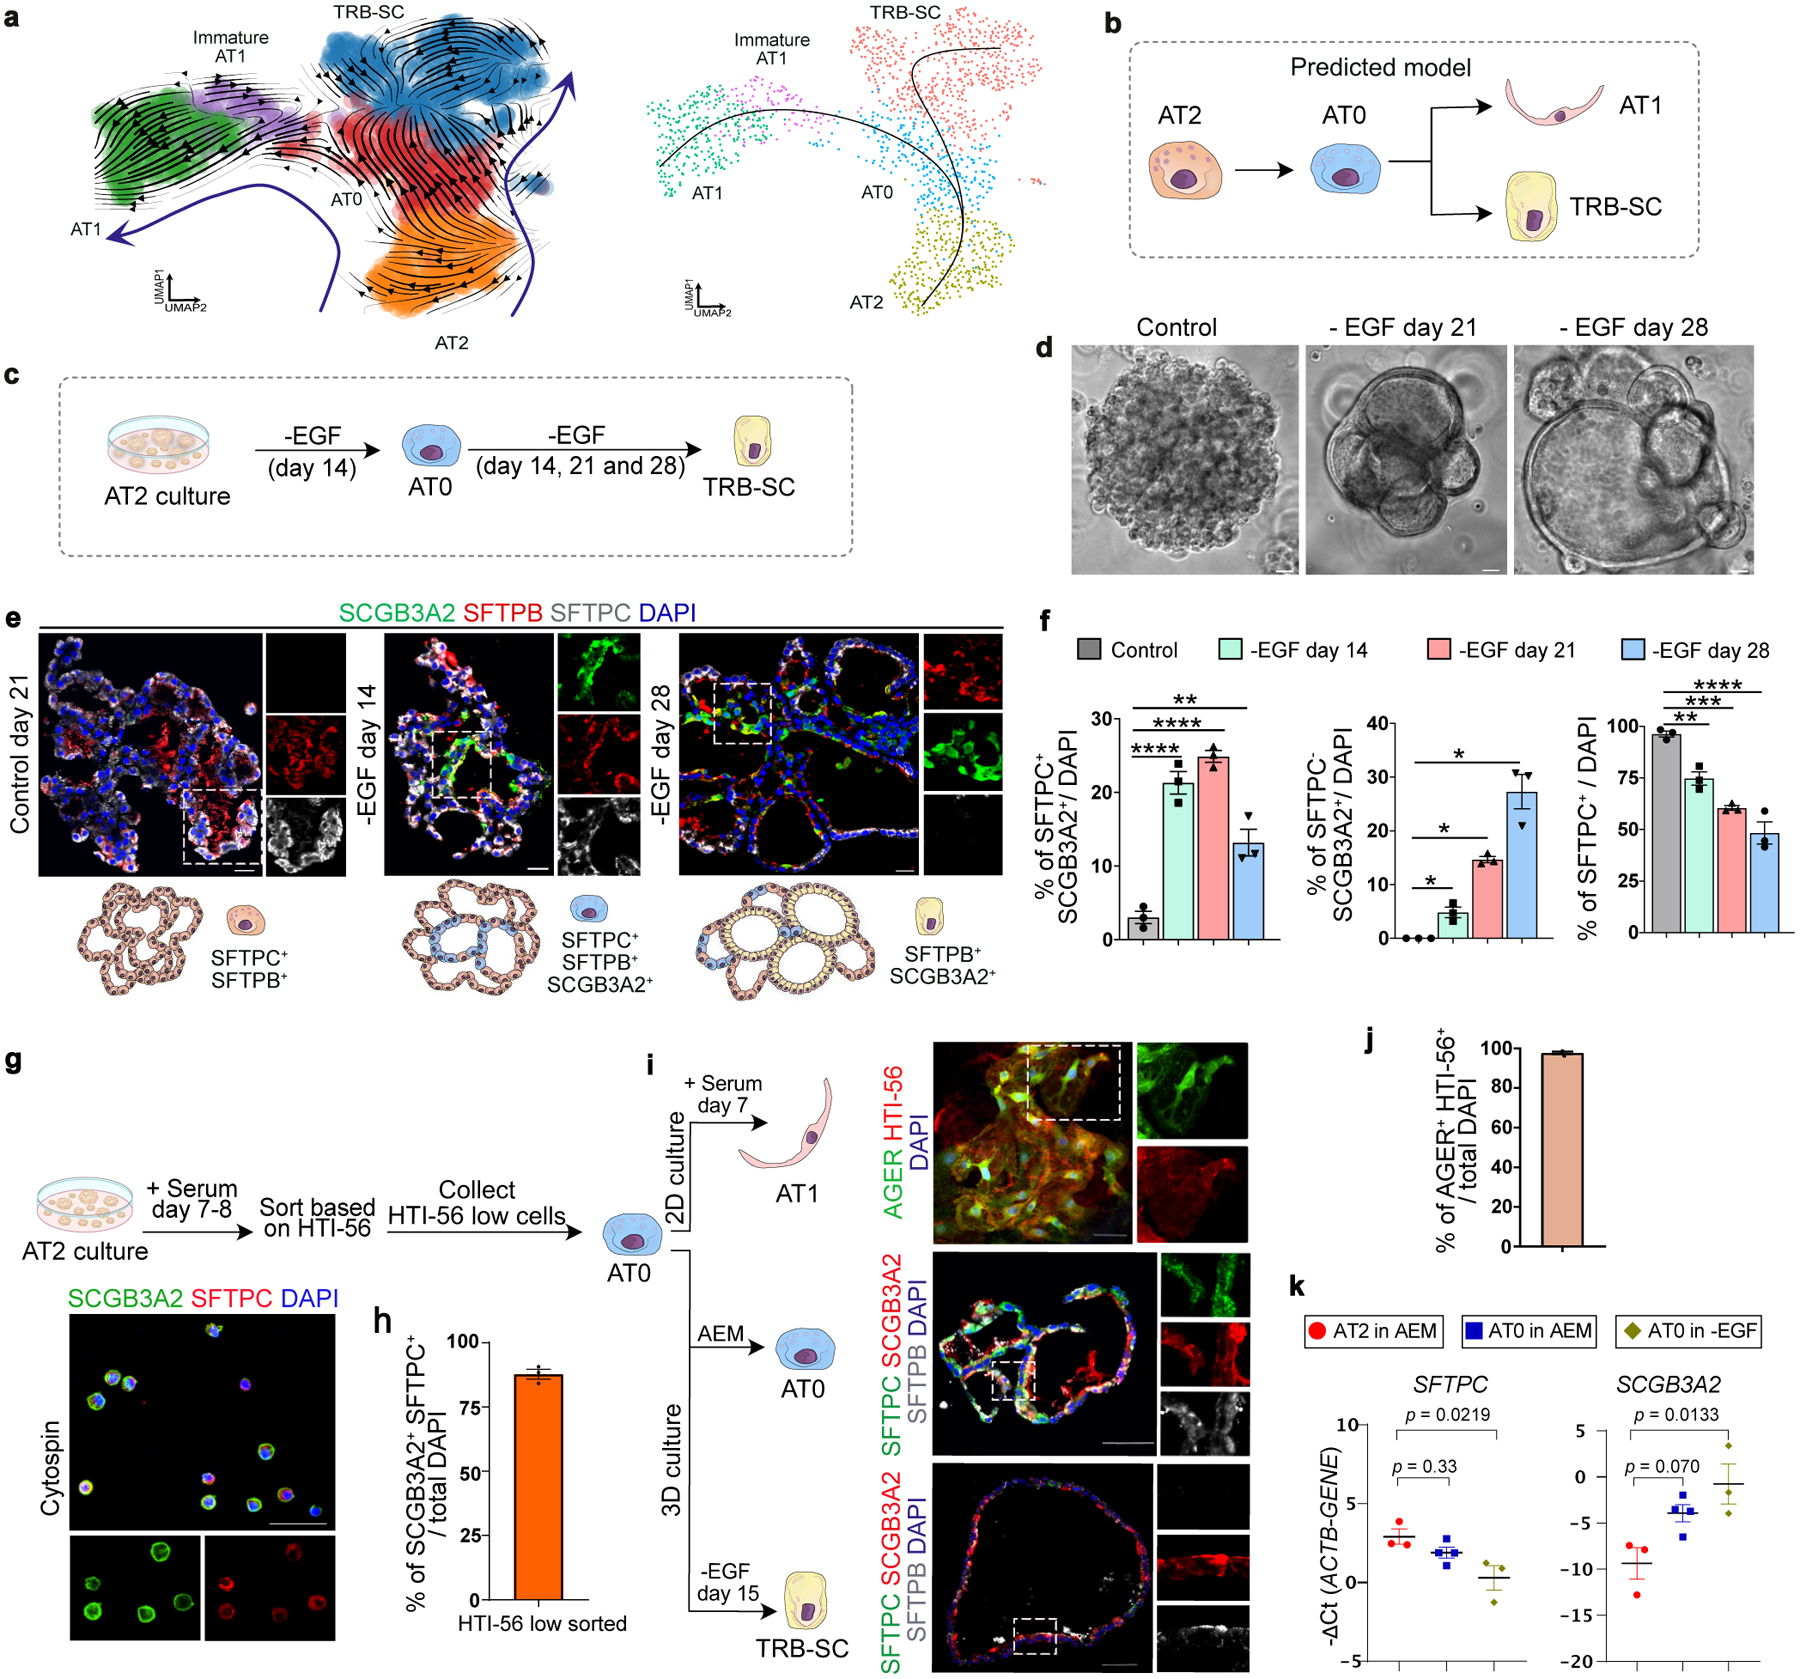
a. scVelo (left) and Slingshot (right) analysis on AT2, AT0, immature-AT1, AT1 and TRB-SCs from normal adult distal lung. Arrows indicate the predicted lineage trajectories. b. Schematic showing predicted model. c. Schematic depicting experimental workflow. d. Representative brightfield images show organoid morphology. Scale bar: 500 μm. e. Immunostaining for SCGB3A2 (green), SFTPB (red), and SFTPC (grey). Schematic in lower panel indicate the differences in cellular and morphological characteristics in organoids from different conditions. Scale bar: 20 μm. f. Quantification of SFTPC+ SCGB3A2+ (left), SFTPC− SCGB3A2+ cells (middle) and SFTPC+ (right). **** (p < 0.0001), ** (p = 0.0016) in left graph (Dunnett’s multiple comparisons test). * (p = 0.05) in middle graph (Mann-Whitney test, one tailed), ** (p = 0.0042), *** (p = 0.0002), **** (p < 0.0001) in right graph (Dunnett’s multiple comparisons test). (n=3). g. Schematic depicting the experimental workflow (top). Immunostaining for SCGB3A2 (green) and SFTPC (red) on sorted cells. Scale bar: 50 μm. h. Quantification of AT0 cell purity after sorting. (n=3). i. Immunostaining for AGER (green) and HTI-56 (red) on AT0s cultured in ADM (top), immunostaining for SFTPC (green), SCGB3A2 (red) and SFTPB (grey) on AT0s cultured in AEM (middle), or EGF depleted AEM (bottom). Scale bar: 50 μm. j. Quantification of AGER+ HTI-56+ cells in AT0s cultured in ADM. (n=3). k. Relative mRNA expression of SFTPC and SCGB3A2 in AT0s cultured in AEM and EGF depleted AEM. (Dunnett’s multiple comparisons test) (n=3, for AT2 in AEM and AT0 in EGF withdrawal; n=4, AT0 in AEM). e, g and i: Insets indicate individual channels of regions marked in white boxes.
We validated these predictions using human AT2-derived alveolosphere cultures36. To find culture conditions that induce an AT0 cell state in AT2s, we independently depleted the factors that are essential for AT2 growth and maintenance (EGF, FGF10, SB431542, CHIR99201) (Extended Data Fig. 11a). Immunofluorescence revealed that depletion of EGF or CHIR99201 but not FGF10 or SB431542 induced co-expression of SCGB3A2, SFTPC, and SFTPB, indicating that AT2s convert to AT0s in these conditions (Extended Data Fig. 11b). Removal of CHIR99201, but not EGF, resulted in reduced alveolosphere growth (data not shown). Therefore, we used EGF depletion conditions for further analysis (Fig. 3c). Upon EGF depletion, we found a gradual change in organoid morphology from a saccular to multi-luminal cystic architecture and cell state transitions (from AT2 to AT0 and TRB-SC) as revealed by analysis of SCGB3A2, SOX2, and SFTPB and SFTPC expression (Fig. 3d,e, Extended Data Fig. 11c). AT0 numbers peak at day-14, whereas TRB-SCs significantly increase from day-14 to day-28 following EGF depletion (Fig. 3e,f). These data support a model in which AT2s first convert to AT0s, which then progress to TRB-SCs which organize into 3D epithelial cysts that resemble bronchiolized structures seen in pathological states in human lungs37. We further confirmed these observations using Erlotinib, an EGFR-specific inhibitor (Extended data Fig. 11d). To delineate the intracellular signalling components that control AT2 to AT0 transition, we inhibited key regulators that correspond to multiple orthogonal branches downstream of EGFR. Our data demonstrate that blockade of RAF (BAY73–4506) and MEK (PD0325901), but not AKT (GSK690693) or JNK (SP600125) results in the induction of SCGB3A2 in AT2s (Extended data Fig. 11e).
AT2 to AT1 differentiation cultures revealed emergence of AT0s co-expressing SCGB3A2, SFTPC, and varying levels of HTI-56 (a surface marker for AT1s) (Extended data Fig. 11f). Cell sorting followed by markers analysis revealed that the HTI-56low population corresponds to AT0s (Fig. 3g, Extended data Fig. 11g). Purified AT0s either transitioned to AT1s upon the addition of serum or into TRB-SCs after EGF depletion (Fig. 3i). Interestingly, AT0s can proliferate and continue to express SFTPC and SCGB3A2 but do not revert to AT2s in AT2 expansion medium (Fig. 3i–k, Extended data fig. 11h).
To map the molecular profiles and cell state dynamics, we performed scRNA-seq analysis on AT2s cultured under different conditions. Single-cell transcriptome profiles revealed the presence of AT0, AT1, and TRB-SCs in EGF-depleted and serum treated organoids compared to controls (Extended Data Fig. 12a,b). A direct comparison of transcriptome profiles of AT0s obtained from serum addition or EGF depletion to that of in vivo AT0s revealed a strong correlation (R=0.55 in serum addition; R=0.41 in EGF depletion) (Extended data Fig. 12c). Together, these data demonstrate that AT2s can acquire a bipotential AT0 cell state to generate AT1s or TRB-SCs ex vivo.
Distal lung cell profiles of primates
The comparative anatomy of lungs from different species has revealed significant differences in the organization of distal airways. For instance, similar to humans, some animals, including monkey, ferret, and pigs have one or several generations of RBs, whereas in mice and rats these regions are absent38–42. Therefore, we checked for the presence of the above described distal epithelial cells in macaque lungs, known to have several generations of TRBs43. We analysed previously described snRNA-seq data from Cynomolgus monkey (Macaca fascicularis) lungs (Fig. 4a)44. We found cell populations that correspond to human TRB-SCs (SCGB3A2+SFTPB+), AT0 (SCGB3A2+SFTPB+SFTPC+), pre-TB-SCs (SCGB3A2+SFTPB+SCGB1A1+) as well as other known cell types (AT2, AT1, ciliated, and secretory) (Fig. 4b). Unlike in humans, SFTPB expression is absent in AT1s of monkey lungs, indicating species-specific differences (Fig. 4b). We validated these findings, by performing immunostaining on sections of rhesus monkey (Macaca Mulatta) lungs. Similar to human lungs, we found SCGB3A2+SFTPB+ cells specifically in the distal airways (Fig. 4c, Extended Data Fig. 13a). We found cells analogous to human TRB-SCs, distal-BC-1 (KRT5+SFTPB+TP63+) and distal-BC-2 (KRT5−SFTPB+TP63+), in distal airways of monkey lungs (Fig. 4c, Extended Data Fig. 13b). Similarly, AT0s were found in TRB regions but rarely in distal alveolar sacs (Fig. 4d).
Fig. 4. Revised lineage hierarchies in primate alveolar regeneration and disease.
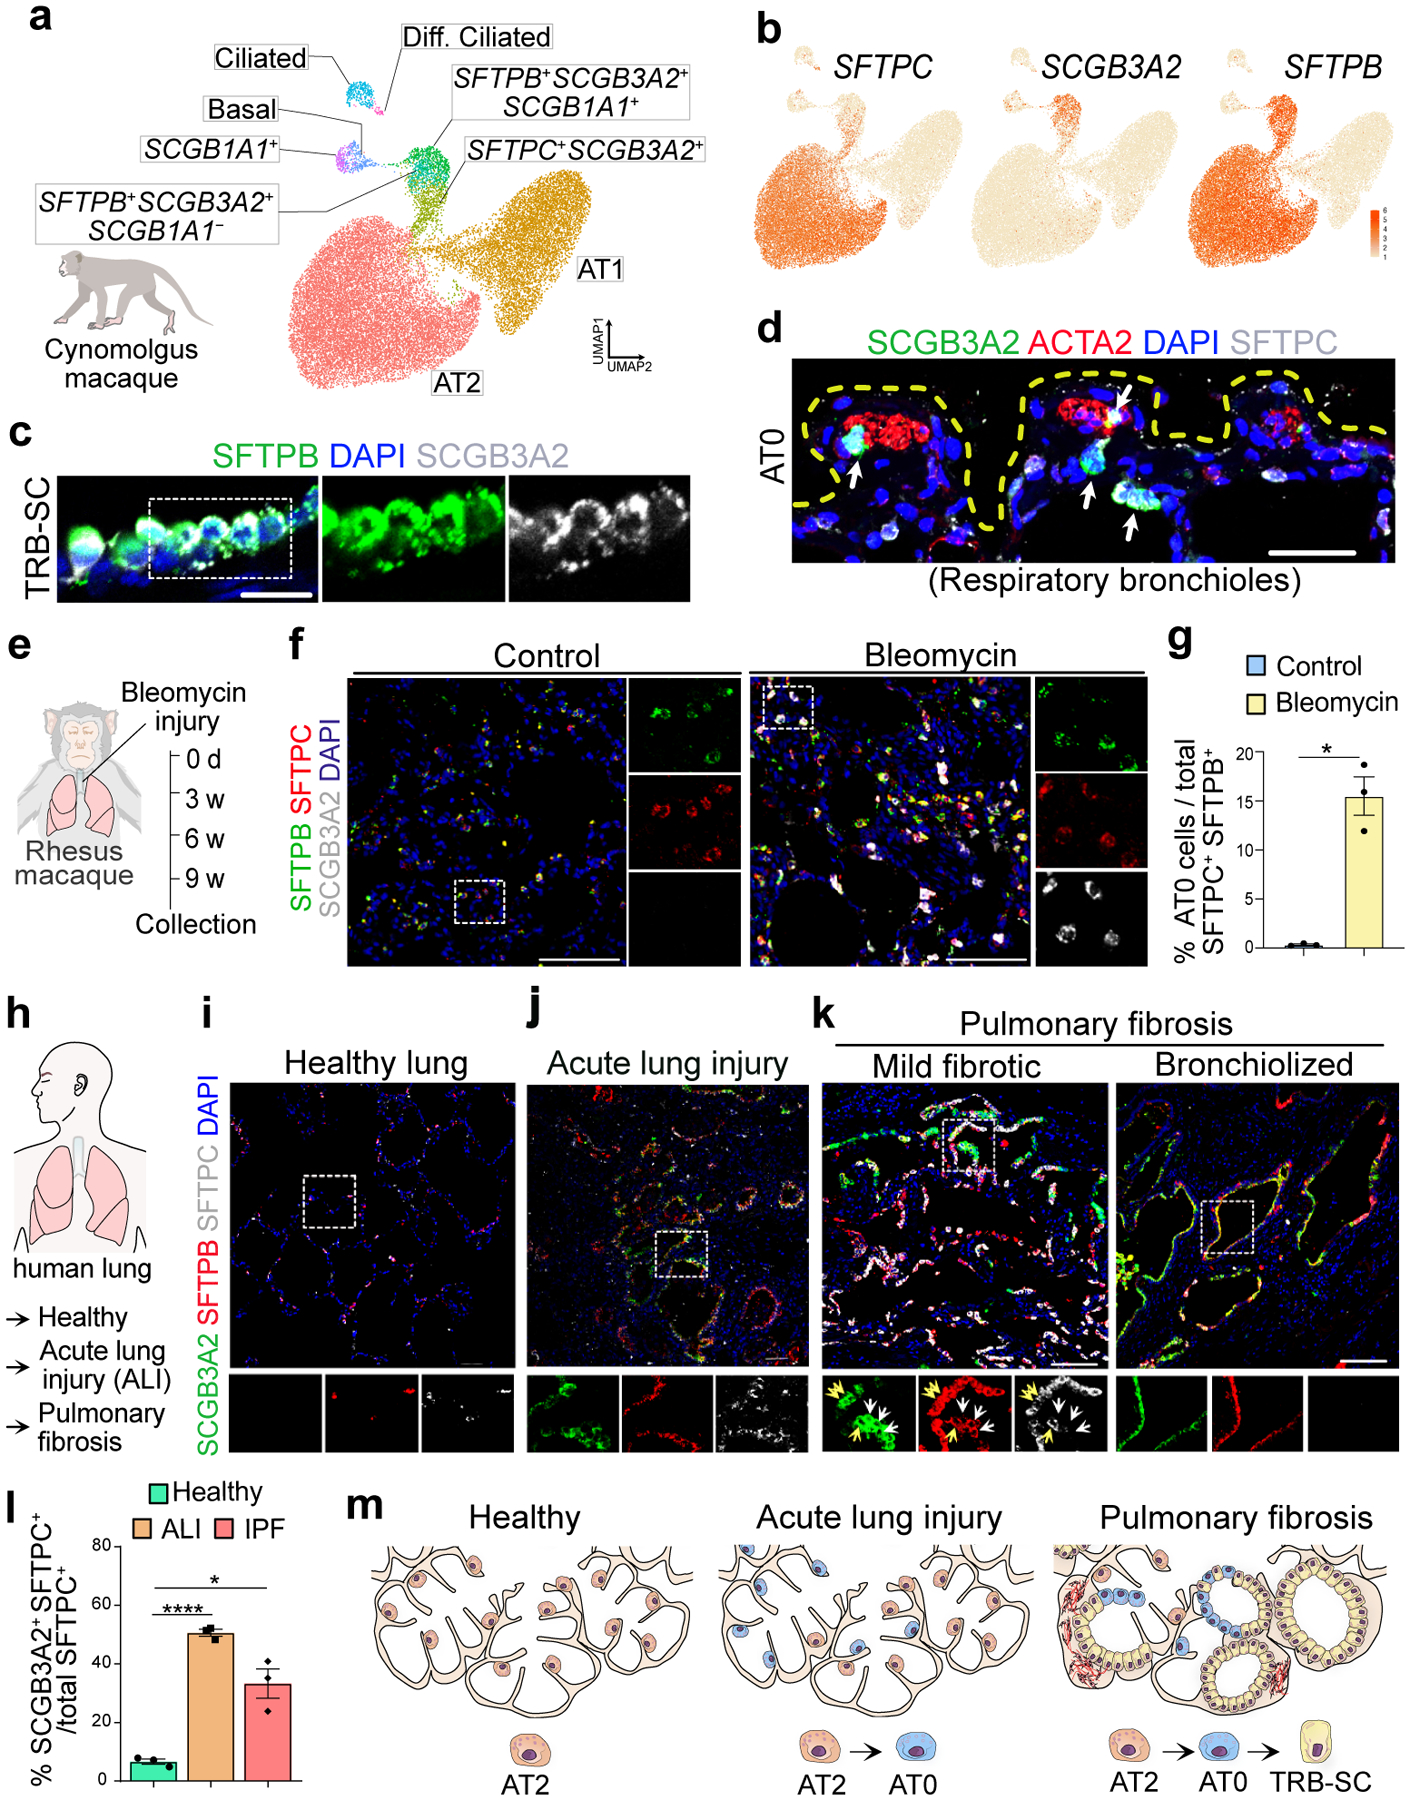
a. UMAPs show epithelial cells from Cynomolgus monkey lungs published in Ma et al. 2021. Diff. Ciliated refers to differentiating ciliated cells. b. UMAPs show the expression of indicated genes in epithelial cell types. c. Representative immunofluorescence images from TRB of Rhesus macaque show the expression of SFTPB (green) and SCGB3A2 (grey). Scale bar 20 μm. d. SCGB3A2 (green), ACTA2 (red) and SFTPC (grey). Scale bar 50 μm. e. Experimental workflow of bleomycin injury in Rhesus macaque. f. Immunostaining for SFTPB (green), SFTPC (red) and SCGB3A2 (grey) in control and bleomycin injured Rhesus macaque lungs. Scale bar 100 μm. DAPI stains nuclei (blue). g. Quantification of AT0 in control and bleomycin treated Rhesus macaque in alveolar region of the lung. p-value: ** (p = 0.0162) (unpaired two-tailed t-test with Welch’s correction). h. Schematic indicating the human normal and disease samples used. i-k. Immunostaining for SCGB3A2 (green), SFTPB (red), and SFTPC (grey) in healthy human lung (i), acute lung injury (j) and IPF mild fibrotic and bronchiolized regions (k). Yellow arrows indicate SFTPC+SFTPB+SCGB3A2+ (AT0) cells. White arrows indicate SFTPC−SFTPB+SCGB3A2+ (TRB-SCs). Scale bar: 50 and 100 μm. l. Quantification of AT0 in normal, acute lung injury and IPF human lungs. Only those images that had AT0s were selected for quantification. * (p = 0.0474), and **** (p < 0.0001) (Dunnett’s T3 multiple comparisons test) (n=3). m. Schematic showing revised cell lineages in healthy, ALI and IPF lung. In panels c, f, i, j and k, insets indicate individual colour channels of regions marked in white boxes.
AT0 dynamics in monkey lung injury-repair
To test whether AT2s acquire a transient AT0 state in response to injury, we administered bleomycin to monkeys to cause lung injury (Fig. 4e, f). Immunostaining for SCGB3A2, SFTPC, and SFTPB revealed the presence of numerous AT0s in distal alveolar sacs in damaged regions compared to uninjured regions (Fig. 4f, g, Extended Data Fig. 13c). These data suggest that an AT0 cell state emerges from AT2s during injury repair in non-human primate lungs.
AT0 cell dynamics in human lung diseases
To investigate whether AT2s acquire a transient AT0 state in injured human lungs, we analysed tissue sections from acute lung injury (ALI), IPF and COPD (emphysematous) (Fig. 4h). Immunostaining revealed the presence of numerous cells co-expressing SFTPC, SCGB3A2, and SFTPB in damaged alveolar tissues but not in controls (Fig. 4i–l). These data suggest that AT0s emerge in distal alveolar sacs in response to lung injury. Similarly, we observed numerous AT0s in lungs of patients with COPD, and IPF (Fig. 4k,l, Extended Data Fig. 13d). We detected cells resembling TRB-SCs (SCGB3A2+SFTPB+SFTPC−) in IPF but not in ALI and COPD lungs. The distribution of ectopic TRB-SCs and AT0s in IPF lungs correlated with distinct histological patterns (Extended Data Fig. 13e,f). AT0s were predominantly found in mild fibrotic regions that are contiguous with and interspersed between regions with normal AT2s, suggesting that AT2s were transitioning to AT0s. By contrast, TRB-SC-like cells were mostly found in severe fibrotic regions that resemble the classical histological descriptions of “bronchiolized regions” (Fig. 4m). We also found regions indicative of cells undergoing sequential transition from AT2 to AT0 and then to TRB-SCs (Fig. 4k). We find that AT0s in ALI tissue sections expressed Ki67, suggesting that they can replicate in these regions (Extended Data Fig. 13g,h). Together, these results suggest that AT2s can acquire a bi-potential AT0 cell state from which they can transition to either AT1s or TRB-SCs depending on the surrounding milieu (Fig. 3,4).
Discussion
Our comprehensive high-resolution spatial transcriptomics has uncovered seven molecularly distinct previously uncharacterized cell types, and provides a reference map for them in the distal airways including TRBs. Spatial and molecular profiling has allowed us to segregate lobar airways into four distinct zones, which vary in secretory cell composition. TRB cells express transcripts for CFTR, SCNN1B, and SCNN1G, key regulators of airway ion transport and fluid balance but not mucins45. Collectively, this suggests that distal airways in healthy lungs actively suppress mucous cell development, and participate in airway ion transport. Defects in these functions would have significant implications in muco-obstructive diseases such as cystic fibrosis and chronic bronchitis45. It will be important to unravel the dynamics of TRB-SCs during fetal lung development as small airway developmental defects are common in diseases such as bronchopulmonary dysplasia and congenital pulmonary airway malformations46,47. Newly found LGR5+ fibroblasts express unique molecular signatures including signaling ligands, suggesting a signaling hub centered on these mesenchymal cells.
We have identified a bi-potential cell type that we have termed AT0, to distinguish them from AT1s and AT2s. AT0s can be normally found in alveolar sacs in vicinity to TRBs. Interestingly, AT0-like state also emerges in distal alveoli following injury. It will be valuable to determine what controls whether AT0s exist as a relatively stable cell types in steady state lungs versus a transient cell state under conditions of injury and repair. Unlike mouse bronchioalveolar stem cells (BASCs), AT0s do not express classical club cell marker, SCGB1A1 but share molecular signatures with TRB-SCs, AT2, and AT148,49. We found evidence that AT2s can transiently acquire an AT0 cell state during their differentiation into AT1s. These lineage trajectories are very distinct from those seen in the alveolar region of the mouse lung, which involves a distinct transient state known as PATS (pre-alveolar type-1 transitional state)5–7. Our results suggest that AT0s also have the potential to give rise to TRB-SCs. Differentiation of human AT2s into TRB-SCs via the AT0 state in the organoid model system is accompanied by the reorganization of saccular structures into cystic entities that closely resemble bronchioles. This process raises the possibility that AT2s serve as a cellular source for ectopic bronchiolized structures found in human lung diseases37.
Future studies are needed to establish gene regulatory networks that control the differentiation of human AT0s into AT1 and TRB-SCs and to study how these are affected by disease associated genetic variants. Further, we need to establish the cellular maps across species including non-human primates. This will be valuable for establishing the mechanisms that are integral to the evolution of new cell types and their interaction with neighbouring cells. Practically, as the genome editing tools become more available, such comparative anatomic studies at a cellular resolution across species will be valuable for modelling human lung biology better than we have done with merely closest mouse species.
Methods
Human lung tissue collection
Excised sub transplant-quality human lung tissues from donors without pre-existing chronic lung diseases were obtained from the Marsico Lung Institute at the University of North Carolina at Chapel Hill under the University of North Carolina Biomedical Institutional Review Board-approved protocol (#03–1396). Informed consent was obtained from all participants where necessary. Healthy, IPF, COPD, acute lung injury tissues were obtained from Biorepository and precision pathology center (BRPC) at Duke University, Duke Institutional Review Board-approved protocol (Pro00082379). Informed consent was obtained for all specimens (where necessary) from donors or authorized representatives. All research using human lung tissue was performed in accordance with the approved protocols mentioned above. Donor details are provided in Supplementary Table 2.
Human fetal lung tissue preparation
Normal, de-identified human fetal lung tissue was obtained from University of Washington Laboratory of Developmental Biology. All research using this human fetal lung tissue was approved by the University of Michigan Institutional Review Board. Research using human fetal samples followed all relevant guidelines and regulations.
Tissue was shipped overnight in UW-Belzer’s solution on ice and immediately fixed in 10% Neutral Buffered Formalin for 24 hours at room temperature on a rocker. Tissue was then washed 3x (minimum of 15 minutes each), with UltraPure Distilled Water (Invitrogen, 10977–015), and dehydrated in the following alcohol series diluted with UltraPure Distilled Water (1 hour per step): 25% MeOH, 50% MeOH, 75% MeOH, 75% MeOH, 100% MeOH, 100% EtOH, 70% EtOH. Tissue was processed into paraffin blocks using an automated tissue processor (Leica ASP300) with 1-hour solution changes. Blocks were sectioned into 7 μm sections onto charged glass slides. Slides were stored at room temperature in a slide box with a silica desiccant packet with seams sealed in paraffin.
Human lung microdissection, tissue dissociation and scRNA-seq
Human lung airways were micro dissected and distal region was cut out to enrich airways measuring less than 1 mm in their outer diameter and contiguous alveoli. The dissected pieces were longitudinally cut open. Samples were then dissociated in two steps. Step 1: samples were incubated in an enzyme cocktail (Supplementary Table 2) for 15 min at 37°C followed by rigorous pipetting and incubation for 15 min at 37°C. After incubation, cells were centrifuged at 550 g for 10 min, supernatant was collected in a fresh 50 ml conical tube. Step 2: The cell pellet from step 1 was incubated with TrypLE™ Select Enzyme (Thermofisher, #12563029) at 37°C for 10 min followed by rigorous pipetting and incubation for 10 min at 37°C. The cells were filtered through a 100 μm strainer and rinsed with DMEM/F-12 containing 10% FBS medium. The supernatant from step 1 and step 2 were combined and centrifuged at 550 g for 10 min. The supernatant was removed and the cell pellet was resuspended in red blood cell lysis buffer (Millipore Sigma, #11814389001) for 5 min, washed with DMEM/F-12 containing 10% FBS and filtered through a 40 μm strainer. Total cells were centrifuged at 550 g for 10 min at 4°C. Cells were counted and used for gel bead emulsion (GEM) generation in 10x Chromium instrument. scRNA-seq libraries were prepared using 10x Genomics v3.1 single index kit as per manufacturer’s instructions. Libraries were sequenced on Illumina HiSeq X with 150 bp paired-end configuration.
Human AT2 and alveolar fibroblasts isolation
Human AT2 cells isolated as described previously36. Briefly, pleura was removed and the remaining human lung tissue (approximately 2g) washed with PBS containing 1% Antibiotic-Antimycotic. Tissue was digested with enzyme mixture (1.68 mg/ml Collagenase type I; 5U/ml Dispase; 10U/ml DNaseI) at 37°C for 1 h with rotation. The cells were filtered through a 100 μm strainer and rinsed with DMEM/F12+10% FBS medium through the strainer. The supernatant was removed after centrifugation at 450× g for 5 min and red blood cell lysis was performed for 10 min and samples were filtered through a 40 μm strainer. Total cells were centrifuged at 450 g for 5 min at 4°C and the cell pellet was processed for AT2 isolation.
AT2 isolation was performed as described previously36. Briefly, about 2–10 million total lung cells were suspended in MACS buffer and incubated with Human TruStain FcX (BioLegend, #422032) for 15min at 4°C followed by HTII-280 antibody for 1h at 4°C. The cells were washed and incubated with anti-mouse IgM microbeads for 15 min at 4°C. The cells were loaded into the LS column (Miltenyi Biotec, # 130–042-401) and labelled cells were collected magnetically. For FACS based purification of human AT2s, the total lung cell pellet was suspended in MACS buffer and epithelial cells were purified using Human-CD326 (EpCAM) microbeads as per manufacturer’s instructions. Purified EpCAM cells were stained with anti-CD326 (EpCAM) and HTII-280 antibodies, and LysoTracker™ Deep Red (ThermoFisher, # L12492) at 37°C for 25 min followed by secondary anti-mouse IgM-Alexa 488 (Thermo Fisher, #A-10680) for 10 min at 37°C. Sorting was performed using SONY SH800S sorter.
For alveolar fibroblasts enrichment, total cells were cultured in alveolar fibroblast enrichment medium, base medium (composition: 1% Glutamax (Thermo, #35050061), 2% B27 (Thermo, #17504044), 1% N2 (Thermo, #17502048 ), 15 mM HEPES (Thermo, #15630080), 1.25 mM N-acetylcysteine (Sigma, #A9165) and 1% Antibiotic-Antimycotic (Thermo, #A5955) in Advanced DMEM/F12 (Thermo, #12634028)) along with 1 μM BIRB796 (Tocris, #5989), 50 ng/ml human EGF (Gibco, #PHG0313), 10ng/ml PDGFRα (Biolegend, #712402 ), 10ng/ml Noggin (Biolegend, #597002). After the initial passage, alveolar fibroblasts were sorted using APC anti-human CD140a (PDGFRα) antibody.
Organoid culture and growth factor depletion
Human AT2 organoid cultures were performed as described previously36. Briefly, FACS sorted human AT2 (2–3 × 10³) cells were resuspended in AT2 expansion media (AEM) and mixed with an equal volume of growth factor-reduced matrigel (Corning #354230). Once the matrigel solidified ADM was added to the cultures and the medium was changed every third day. For the growth factor depletion experiment, Human AT2s (2–3 × 10³) from passage 2 (P2) or 3 (P3) were cultured in the matrigel bubble for 7–12 days in ADM. Once AT2s form small size organoids individual growth factors, EGF or FGF10 or SB431542 or CHIR99201 were removed and cultured for additional 14, 21 or 28 days. For EGFR inhibition, AT2 organoid cultures were treated with 2 μM Erlotinib hydrochloride (Sigma, #SML2156) for 7 days. AT2 organoid differentiation cultures were performed upon 15 – 21 days EGF depletion as described previously with small modification36. Differentiation media used in the current study does not contain EGF.
Organoid dissociation and scRNA-seq
Organoids from control (day 21) or EGF depletion (day 21) or ADM (day 10) condition were incubated with TrypLE select enzyme at 37°C for 10min. After 10 min, organoids were scooped out using cell scraper and matrigel was disrupted by pipetting. Organoids were again incubated at 37°C for 10 min followed by TrypLE inactivation using DMEM/F-12 containing 10% FBS medium. Single cell suspension was filtered through 40 μm strainer and dead cells were removed using dead cell removal kit (Miltenyi biotech, #130-090-101) according to manufacturer’s instructions. Single cells were resuspended in 0.04% BSA at 1000 cells/μl concentration and used for gel bead emulsion (GEM) generation in 10x chromium instrument. scRNA-seq libraries were prepared using 10x Genomics v3.1 dual index kit as per manufacturer’s instructions. Libraries were sequenced on NovaSeq 6000.
AT0 cell sorting, characterization and culture
To isolate AT0 cells from ex vivo cultures, AT2 organoids grown in AEM for 15 days were subjected to differentiation for 7–8 days by adding human serum (Sigma, # H4522) containing Alveolar Differentiation Medium (ADM). Post differentiation, organoids were dissociated using TrypLE at 37°C for 10 min. After 10 min, cell scraper was used to lift the organoids and matrigel was disrupted by pipetting. Organoids were collected and incubated with TrypLE at 37°C for 10 min followed by inactivation in DMEM/F-12 containing 10% FBS and cell suspension was filtered through 40 μm cell strainer. HTI-56 antibody was added to single cell suspension followed by incubation at 4°C for 1h on a rotating shaker. Cells were washed and incubated with anti-mouse IgG1-Alexa-647 antibody for 20 min at RT. Cells were sorted based on HTI-56 levels (Extended data Fig.13g) using SONY SH800S sorter. FACS data were analyzed using FlowJo v10. Sorted cell purity was validated using cytospin analysis. Briefly, flow sorted cells were fixed with 4% paraformaldehyde (PFA) for 10 min and washed three times with PBS. Cytospin preparations were performed by rotation at 1000g for 5 min. Cytospin slides were immunostained for AT0 markers (SCGB3A2 and SFTPC) as described in immunostaining section.
Sorted AT0 cells were used for 2D or 3D cultures. For 2D, AT0s were seeded on transwell membrane (Corning, #3470) coated for 1h at 37°C with 5% matrigel. For differentiation, AT0 cells were allowed to settle on the membrane overnight in AEM followed by switching the medium to ADM for 7 days. Medium was added to both lower and upper chamber of the transwell and medium was changed every second day. For 3D, sorted AT0 (3–5 × 10³) cells were resuspend in AEM and mixed with an equal volume of growth factor-reduced matrigel. Once the matrigel solidified AEM or EGF depleted AEM was added to the cultures and the medium was changed every third day until further analysis. At the end of the cultures cells from transwell membranes or 3D organoids were used for RNA isolation or histological analysis.
Small molecule based EGFR pathway inhibition
For small molecule inhibition experiments, human AT2 cells (2.5×10⁴) from P2 or P3 passage were cultured in 96 or 24 well plates pre-coated with 10% matrigel for 1 hr at 37°C. AT2 cells were grown in AEM for 2–3 days and cells were then treated with 0.25 μM AKT inhibitor (GSK690693, Selleckchem, #S1113), 5μM JNK inhibitor(SP600125, Selleckchem, # Nsc75890), Raf inhibitor, (Regorafenib (BAY 73-4506), Selleckchem, #S1178) or 5μM MEK inhibitor (Mirdametinib (PD0325901), Selleckchem, #S1036) for 5 days for RNA isolation and quantitative RT-PCR. For immunofluorescence analysis, cultures were treated with indicated inhibitors for 7 days.
Basal cell cultures and Air Liquid Interface cultures
Basal cells from large airways were isolated and cultured as described previously15. Briefly, Large Airway Epithelial (LAE) cells were isolated from the cartilaginous airways by protease digestion as provided by the UNC Tissue Procurement. LAEs were co-cultured with mitomycin-treated 3T3 J2 cells on collagen-coated tissue culture plastic dishes in DMEM medium supplemented with 10 μM Y-27632 (Enzo Life Science). At 70–90% confluence, LAE cells were passaged twice for expansion. Epithelial cells from TRB regions were obtained by microdissection and protease digestion as described in section (Human lung microdissection, tissue dissociation and scRNA-seq). TRB dissociate was cultured in AEM for the first passage and EpCAM+ cells were sorted using MACS column as per manufacturer’s instruction. For further passages and organoid assays basal cells from both large airway and TRB-region were cultured in PneumaCult™-Ex Plus Medium (STEMCELL Technologies, #05040) or PneumaCult™ Airway Organoid Kit (STEMCELL Technologies, #05060) medium as per manufacturer’s instructions. Basal cells grown in PneumaCult™-Ex Plus Medium both from large airway and TRB region were then used for Air Liquid Interface cultures (ALI). All the ALI-cultures were performed for 28 days using PneumaCult™-ALI-S Medium (STEMCELL Technologies, #05050) according to manufacturer’s instructions. At the end of the cultures, ALI membranes were used for RNA isolation or histological analysis. For cilia length measurements, cilia were digitally traced on the scanned images of fully differentiated proximal and distal airway epithelium cytospin preparations followed by May-Giesma stainings.
Distal airway fibroblast cultures
For LGR5+ fibroblasts cultures, human intralobar airways were micro dissected, and the distal region was cut out to enrich airways measuring 1–2 mm in their outer diameter and contiguous alveoli. Dissected tissue was dissociated using protease mix (4 mg/ml pronase, 5 U/ml dispase, 1 mg/ml collagenease type IV, and 0.33 U/ml DNase I, Collagenase type I) as described above in section (Human lung microdissection, tissue dissociation and scRNA-seq). Dissociated cell suspension was cultured in LGR5 fibroblast enrichment medium containing base medium along with 3 μM CHIR99021 (Cayman, #13122), 1 μM BIRB796 (Tocris, #5989), 50 ng/ml human EGF (Gibco, #PHG0313), 10ng/ml PDGFRα, 10ng/ml Noggin, and 10ng/ml FGF10 (BioLegend, #559306). After initial passage, mesenchymal cells were isolated by depleting the epithelial cells using EpCAM magnetic beads.
LGR5-mRFP reporter plasmid construction and lentivirus production
The human LGR5 promoter (Chr12: 71438377–71440081; GRCh38.p13 primary assembly) region was PCR amplified from human genomic DNA (Applied Biosystems, Part #360486) using Q5 DNA polymerase (NEB, # M0491) according to the manufacturer’s instructions (See Supplementary Table 4 for primer sequences). PCR amplified promoter was cloned into pLKO-scramble-h2b-mrfp1-cbfre-egfp plasmid backbone50. Firstly, cbfre-egfp region was excised from the parent plasmid using XbaI-NheI enzymes, followed by self-ligation using T4 DNA ligase (NEB, # M0202M). PCR amplified LGR5 promoter fragment was HiFi (NEB HIFI-assembly master mix, NEB, # E2621L) assembled into the modified plasmid by replacing PGK-H2B cassette using SacII-AgeI to generate pLKO-LGR5-mRFP plasmid. Primers used for PCR are listed in Supplementary Table 4. For lentivirus production, HEK293T cells were grown to 70–80% confluence in a 10 cm plate. Cells were transfected with 10 μg of transfer plasmid, 6.7 μg of packaging psPAX2 (Addgene, Plasmid #12260), and envelope pCMV-VSV-G (Addgene, Plasmid #8454) plasmids with PEI Max (1:4) (Polysciences, #24765). After overnight transfection, cells were supplemented with DMEM medium containing 5% FBS and 1% penicillin/streptomycin. Viral supernatant was harvested 48 and 72 h post-transfection. The lentivirus containing supernatant was filtered through a 0.45 μm filter and the virus was concentrated using Lenti-X™ Concentrator (Takara, #631231) according to manufacturer’s instructions. The viral pellet was reconstituted in PBS. To generate LGR5-mRFP+ reporter lines, fibroblasts grown in LGR5+ fibroblasts enrichment medium were transduced with the lentivirus using 4 μg/ml polybrene (Sigma, #TR-1003-G). On day-7 post-transduction, cells were dissociated using TrypLE select enzyme and sorted for mRFP (Supplementary Fig. 1). Enriched LGR5+ fibroblasts were further validated by qRT-PCR for markers specific these cells.
Distal basal cell co-cultures with LGR5+ fibroblasts or alveolar fibroblasts
For co-culture experiments, human basal cells from distal airways or AT2s (3 × 10³) were mixed with LGR5-mRFP fibroblasts or alveolar PDGFRα+ fibroblasts (2.5 × 10⁴) and resuspend in BM and mixed with equal amount of growth factor-reduced matrigel. Organoids were grown in organoid co-culture medium (BM containing, 1 μM BIRB796, 50 ng/ml human EGF, 10 ng/ml human FGF10) and the medium was changed every other day for 8–10 days. For no feeder cultures, human basal cells from TRB region or AT2s (3 × 10³) were resuspended in serum free base medium and mixed with an equal amount of growth factor-reduced matrigel and grown in grown in organoid co-culture medium.
Organoid fixation and sectioning
Organoids were fixed with 4% PFA at 4°C for 2 h or at room temperature for 1 h, respectively. Submersion cultures of organoids were first immersed in 1% low melting agarose (Sigma) and fixed with 4% PFA at room temperature for 30 min. For OCT frozen blocks, organoids were washed with PBS, embedded in OCT and cryosectioned (8–10 μm).
Animal care and procedures for monkey.
Adult male rhesus macaque monkeys were maintained at California National Primate Research Center. All protocols were approved by the University of California, Davis Institutional Animal Care and Use Committee in compliance with the Animal Welfare Act and Public Health Service Policy on Human Care and Use of Laboratory Animals. All experiments involving monkeys were performed strictly adhering to the approved guidelines. Monkeys selected for these studies were from the California National Primate Research Center colony born rhesus macaques. Care and housing of animals before, during, and after treatment was performed by the California National Primate Research Center, which is accredited by the Association for Accreditation and Assessment of Laboratory Animal Care (AAALAC).
For bleomycin-induced lung injury, adult male rhesus macaque monkeys from the California National Primate Research Center colony received a single intratracheal instillation of bleomycin sulphate (1 mg/kg, Selleckchem, Houston, TX) in saline. Necropsy was conducted at either 6 or 9 weeks post-instillation. Left caudal lobes were inflation fixed in 4% paraformaldehyde and paraffin-embedded for sectioning and immunofluorescence.
Immunostaining
Paraffin sections were first dewaxed and rehydrated before antigen retrieval. OCT sections were defrosted and washed with PBS. Antigen retrieval was performed using 10 mM sodium citrate (pH 6.0) or Tris-EDTA (pH 9.0) buffer either in a water bath for 15 min at 95°C or in a pressure cooker. Sections were washed with PBS, permeabilized, and incubated with 1% BSA and 0.1% Triton X-100 in PBS for 30 min at room temperature (RT) followed by primary antibodies for 2h at RT or at 4°C overnight. Sections were then washed three times with 0.1% Triton X-100 in PBS (PBST) for 5 min each, incubated with secondary antibodies in blocking buffer for 1 h at room temperature, washed with PBST 3 times, and mounted using Fluor G reagent with DAPI. Autofluorescence was quenched using TrueVIEW autofluorescence quenching kit (Vector labs # SP-8500) or TrueBlack (Biotium, #23007). Slides were mounted using Fluor G without DAPI when DyLight 405 secondary antibodies were used. Immunostaining was performed on at least three biological replicates for all adult human studies; two for monkey (normal and bleomycin-injured); two for human fetal and pediatric tissues.
Antibodies used
Rabbit anti-Prosurfactant protein C (Millipore, #ab3786, 1:500), Goat anti- RAGE/AGER (R&D systems, #AF1145, 1:250), Mouse anti-SFTPB (Thermo fisher, # MA1–204, 1:500), Rabbit anti-SFTPB (Thermo fisher, #PA5–42000, 1:500), Goat anti-UGRP1 (R&D systems, # AF3545, 1:500), Rat anti-CC10 (R&D, MAB4218, 1:500), Rabbit anti-p63 (Genetex, #GTX102425, 1:500), Mouse anti-p63 (Clone 4A4, a kind gift from Dr. Frank Mckeon, 1:20, originally described in Kumar et al., Cell. 2011), Chicken anti-KRT5 (Biolegend, #905903, 1:500), Mouse anti-HTI-56 (Terrace Biotech, #TB-29AHT1–56, 1:250 for IF and 1:100 for FACS), Rat anti-Ki67 (Thermo Fisher, #14–5698-82, 1:200), Rabbit anti-Ki67 (Millipore, #AB9260, 1:200), Goat anti-SOX2 (R&D systems, #AF2018, 1:500), Rabbit anti-MUC5B (Santa Cruz, #sc-20119, 1:500), Mouse anti-MU5AC (Thermo scientific, #MS-145-P, 1:500), Mouse anti-FOXJ1 (Thermo Fisher, # 14–9965-82, 1:200), Mouse anti-HTII-280 (Terrace Biotech, #TB-27AHT2–280, 1:500 for IF and 1:60 for FACS and MACS), APC anti-human CD140a (PDGFRα) antibody (BioLegend, #323512, 1:100), Mouse anti-Napsin A (clone MRQ60; Cell Marque, # 760–4867; 1:250), Alexa Fluor 488 donkey anti-rabbit IgG (Thermo fisher scientific, A21206, 1:500), Alexa Fluor 594 donkey anti-rabbit IgG (Thermo fisher scientific, A21207, 1:500), Alexa Fluor 647 donkey anti-rabbit IgG (Thermo fisher scientific, A-31573, 1:500), Alexa Fluor 594 donkey anti-goat IgG (Thermo fisher scientific, A11058, 1:500), Alexa Fluor 488 donkey anti-goat IgG (Thermo fisher scientific, A11055, 1:500), Alexa Fluor 647 donkey anti-goat IgG (Thermo fisher scientific, A-21447, 1:500), Alexa Fluor 488 donkey anti-rat IgG (Thermo fisher scientific, A-21208, 1:500), Alexa Fluor 594 donkey anti-rat IgG (Thermo fisher scientific, A-21209, 1:500), Alexa Fluor 647 donkey anti-rat IgG (Jackson Immunoresearch, 712–605-150, 1:500), Alexa Fluor 488 donkey anti-mouse IgG (Thermo fisher scientific, A-21202, 1:500), Alexa Fluor 594 donkey anti-mouse IgG (Thermo fisher scientific, A-21203, 1:500), Alexa Fluor 647 donkey anti-mouse IgG (Thermo fisher scientific, A-31571, 1:500), Alexa Fluor 488 AffiniPure Donkey Anti-Chicken IgY (Jackson Immunoresearch, 703–545-155, 1:500), DyLight 405 AffiniPure Donkey Anti-rat IgG (Jackson Immunoresearch, 712–475-153, 1:500), Mouse anti-IgM beads (Miltenyi Biotec, # 130–047-302, 1:10), and CD326 (EpCAM) MicroBeads, human (Miltenyi Biotec, # 130–061-101, 1:10).
Quantification of epithelial cell types across airway zones
Four panels of immunofluorescence were performed on serial sections of normal human lungs (panel 1: SCGB3A2, SFTPB and SCGB1A1; panel 2: SCGB1A1, MUC5B and MUC5AC; panel 3: KRT5, TP63 and SFTPB; panel 4: FOXJ1, SCGB3A2 and SFTPB). Airway zones were identified based on panels 1 and 2. SFTPB− regions were used for zone 1, MUC5B+ and MUC5AC− regions for zone 2, SCGB1A1+, SCGB3A2+, MUC5B− and MUC5AC− regions for zone 3 and SCGB1A1−, SCGB3A2+, MUC5B− and MUC5AC− regions for zone 4. Occasionally, very small number (around 2–4 cells in a field of view) of upper zonal cells, such as SCGB1A1+ in zone 4, were present. But zones were not reclassified owing to the presence of a small number of extra-zonal cells. z-stacks of images were taken for manual quantification on Fiji (ImageJ) software. While quantifying basal cells, only the TP63+ cells in the basal layer were counted and parabasal cells were not accounted for. DAPI (nuclei) was used to estimate the total number of epithelial cells in the region of interest. At least n=3 donor lungs were used for quantifying cells in all zones except zone 4 (n=4).
RNA fluorescence in situ hybridization (RNA-FISH)
RNA-FISH was performed on paraffin-embedded 5–10μm tissue sections using the RNAscope Multiplex Fluorescent Assay v2 according to the manufacturer’s instructions (Advanced Cell Diagnostics). Tissue sections were deparaffinized with xylene (2 changes × 5 min) and 100% ethanol (2 changes × 1 min), and then incubated with hydrogen peroxide for 10 min, followed by target retrieval in boiling water for 15 min, and incubation with Protease Plus for 15 min at 40°C. Slides were hybridized with custom probes [Hs-SFTPB (544251), Hs-SCGB3A2 (544951 and 549951-C2), Hs-SCGB1A1 (469971-C3), Hs-TMEM45A (402221), Hs-LGR5 (311021-C2), and Hs-PDGFRA (604481-C3)] at 40°C for 2 h, and signals were amplified according to the manufacturer’s instructions. Opal dyes were diluted at 1:1000 (for TMEM45A and LGR5), 1:750 (PDGFRA) and 1:3000 (for SFTPB, SCGB3A2 AND SCGB1A1) in the manufacturer provided diluent solution during amplification. The positive and negative control probes were used as a control to test for RNA quality and unanticipated background, respectively.
RNA-FISH was performed on cytospin samples using the RNAscope Multiplex Fluorescent Assay v2 according to the manufacturer’s instructions with minor modifications as described below. Cells were fixed in 4% PFA for 10 minutes and washed twice in sterile PBS. Fixed cells were cytospin onto Superfrost Plus slides and dehydrated using 50%, 70% and 100% ethyl alcohol solutions and stored at −20°C. Stored slides were rehydrated using the same alcohol solutions and were incubated in sterile PBS for 10 minutes at RT. Endogenous peroxidase activity was quenched with 10 minutes of hydrogen peroxide treatment at RT followed by enzymatic digestion using RNAScope Protease III (diluted 1:15 in PBS) for 10 minutes at RT. Rest of the assay was performed as described above for paraffin sections.
Proximity ligation in situ hybridization (PLISH) was performed for RNASE1, SFTPB and MUC5B as described previously51. Briefly, fixed-frozen human lung sections were fixed with 4.0% formaldehyde for 20 min, treated with 20 μg/mL proteinase K for 9 min at 37°C, and dehydrated with up-series of ethanol. The sections were incubated with gene-specific probes (Supplementary Table 3) in hybridization buffer (1 M sodium trichloroacetate, 50 mM Tris [pH 7.4], 5 mM EDTA, 0.2 mg/mL heparin and 1 mg/ml tRNA) for 2 h at 37°C. Common bridge and circle probes were added to the section and incubated for 1 h followed by T4 DNA ligase reaction for 2 h. Rolling circle amplification was performed by using phi29 polymerase (#30221, Lucigen) for 16 h at 37°C. Fluorophore-conjugated detection probe was applied and incubated for 30 min at 37°C. Sections were mounted in medium containing DAPI.
RNA isolation and RT-qPCR
Cells were lysed in TRIzol reagent (Thermo Fisher, # 15596026) and total RNA was extracted using Direct-zol RNA Microprep kit (Zymo, # R2061). In case of AT2 or basal cells co-cultured with fibroblasts, organoids were dissociated and stained (with EpCAM) followed by sorting and lysis in TRIzol. cDNA was synthesised from a maximum of 1 ug total RNA using SuperScript™ III First-Strand Synthesis SuperMix kit (Thermo Fisher, # 18080400) using oligo dT primers. qPCR was performed using PowerUp™ SYBR™ Green Master Mix (Thermo Fisher, # A25742) on StepOne Plus Real-Time PCR System (Applied Biosystems). Primer sequences were sourced from Origene and are listed in Supplementary Table 4. Analysis was performed as described previously52. Results are provided as −ΔCt(Ct ACTB - Ct target gene). Only biological replicates were shown on the plots and were obtained by averaging N > 1 technical replicates each.
Spatial Transcriptomics
Spatial transcriptomics was performed using Visium Spatial Gene Expression assay (10x Genomics) as per manufacturer’s recommendation. Briefly, small pieces of the human lung were incubated in OCT at 4°C for 30 min and frozen in OCT and stored at −80°C. 10 μm sections were placed onto Visium Gateway gene expression slide and stored with desiccants at −80°C until staining and library preparation. Prior to the main experiment, permeabilization time for spatial transcriptomics assay was calculated to be 30 min using the Visium Spatial Tissue Optimization slide by Duke University’s Molecular Genomics core facility. H&E staining was performed on the Visium slide and imaged using 10X objective on Keyence BZ-X810 microscope. Tissue sections were permeabilized immediately to capture RNA molecules onto barcoded spots on the slide. Libraries were then prepared and sequenced (150 bp pairedend) on Illumina NovaSeq 6000.
scRNA-seq data processing and analysis
FASTQ files were processed using Cellranger v5.0.1 (10x Genomics) software using GRCh38 (GENCODE v32/Ensembl 98) genome as a reference. Unique molecular identifier (UMI) counts were further analyzed using in R using Seurat v3.2.1 package53. Background signal from UMI counts data was filtered using SoupX package54. Low quality cells were filtered based on UMI counts, number of transcripts detected and mitochondrial transcripts fraction. Background corrected UMI counts were normalized using SCTransform v0.3.155. Integration anchors were calculated for data from 3 donors using FindIntegrationAnchors() command with 10,000 anchor features. Data were integrated using IntegrateData() command. Principle component analysis was performed, and the number of significant dimensions were estimated by plotting standard deviations of principal components using ElbowPlot() function. Cell clusters were identified using Shared Nearest Neighbors (SNN) based algorithm. Uniform manifold approximation and projection (UMAP) rendering was performed to visualize the clusters. Major cell classes were identified based on enrichment for EPCAM (epithelial), PECAM1 (endothelial), PTPRC (immune), PDGFRA/PDGFRB/ACTA2 (mesenchymal) genes. Cells belonging to each major class were subset using subset() function. Each subset was further filtered to remove duplets. Immune and endothelial cell class subsets were re-clustered and specific cell types were identified based on markers described in Travaglini et al11. Epithelial cell subset was re-clustered and specific cell types were identified based on the expression of SCGB1A1, MUC5B, MUC5AC, KRT5, TP63, SCGB3A2, CALCA, SFTPC, SFTPB, AGER, MYRF, FOXJ1, NEK2 and MKI67.
Mesenchymal cells from Donors 1 and 3 were integrated with those from Patient #3 (droplet based scRNA-seq) in Travaglini et al11. Mesenchymal cell subset data were normalized and 10,000 variable genes were identified from each donor. 500 integration anchors were calculated using FindIntegrationAnchors() command and data were integrated. Integrated data were scaled, and dimensionality reduction was performed using RunPCA() and RunUMAP() commands. SNN based clusters were identified and clusters were labelled using annotations provided. Cell cluster with minimal overlap with cells from Travaglini et al11, was labelled LGR5+ fibroblast. Based on this analysis, mesenchymal subset from donors 1, 2 and 3 were re-clustered and identified.
Data from the three donors were re-integrated using only the filtered and annotated cell barcodes (from all cell classes).
Cell type markers were identified using the FindAllMarkers() command. Cell type markers were used as input to Enrichr56 to identify cell type enriched pathways. Heatmaps were plotted using pheatmap v1.0.12 package after calculating z-scores of average gene expression in each cluster.
Pre-analysed data from Habermann et al.,12 were downloaded from github https://github.com/tgen/banovichlab/tree/master/pulmonary_fibrosis/10x_scRNA-Seq_2019. IPF epithelial cells were subset using the provided annotation. They were further integrated with normal epithelial cells profiled in this study. Integrated data were normalized. Differential gene expression between IPF basaloid cells and distal-BC2 cells was obtained from “RNA” assay (as defined in the Seurat object) using FindMarkers() command. Volcano plot was generated using Enhanced Volcano package.
Similarly, normal epithelial cells from Habermann et al.,12 were integrated with the epithelial cells profiled in this study. Cell type annotation was performed on the integrated data based on previously mentioned markers. Box plot was generated to show the cell type representation from each donor using ggplot2 package.
Counts and metadata from Deprez et al.,23 were downloaded from https://cells.ucsc.edu/. Epithelial cells from the airway surface (Basal, Suprabasal, Suprabasal N, Cycling Basal, Secretory, Secretory N, Multiciliated, Multiciliated N, Deuterosomal, Ionocyte, Brush cells and Ionocyte) excluding the submucosal glands were used for further analysis. Surface epithelial cells from distal airways were compared to those (Ciliated, MUC5B+, MUC5AC+MUC5B+, Differentiating Basal, SFTPB−KRT5+ Basal, SFTPC+SCGB3A2+, SFTPB+SCGB3A2+SCGB1A1+, FOXJ1+SCGB3A2+, SFTPB+KRT5− Basal, Deuterosomal, SFTPB+KRT5_low Basal, SFTPB+SCGB3A2+SCGB1A1−) from the current study. Average expression of RNASE1, SFTPB, SCGB3A2, SFTPA1 and SFTPA2 in the two groups was plotted using Dotplot() command.
List of human transcription factors (TF) annotated in Lambert et al.,57 were downloaded from http://humantfs.ccbr.utoronto.ca/download.php. Analysis of transcription factor regulatory network in epithelial and mesenchymal cells was performed using SCENIC package58. Results were visualized as a heatmap using ComplexHeatmap v2.2.0 package. Z-scores of average expression of TFs enriched in LGR5+ fibroblasts were plotted alongside using ComplexHeatmap package.
snRNA-seq data from Cynomolgous monkey lungs was downloaded from GSA (CRA002577). Raw counts data from young and old monkey lungs were normalized and variable genes were identified. Data were integrated using FindIntegrationAnchors() command. Epithelial cell from the integrated data were identified based on EPCAM expression. Epithelial cells were subset and re-clustered. Revised clusters were identified based on their enrichment for SCGB1A1, KRT5, TP63, SCGB3A2, SFTPC, SFTPB, AGER, FOXJ1.
Cell-cell interaction analysis was performed using CellChat v1.1.059. LGR5+ fibroblast, distal-BC-1 and 2, and TRB-SC cell types were used for interaction analysis.
scRNA-seq data from human fetal lungs were downloaded from EMBL-EBI Array Express database (accession #E-MTAB-8221). Based on provided cell type annotations, epithelial cells from distal and airway regions were subset and used for further analysis. Top 50 enriched genes in TRB-SC cells from our current study was used to calculate the TRB-SC score.
Cellular lineage inference
Read counting pipeline velocyto.py was run on the Cellranger output files to generate .loom files, which were read in R using SeuratWrappers v0.2.0 and Velocyto v0.6 packages29. AT2, AT1, Immature AT1, AT0 and TRB-SC cell clusters were subset to create a new object henceforth referred to as “C4_velo”. Using the method shown in sceasy R package, ‘spliced’, ‘unspliced’ and ‘ambiguous’ assays and associated metadata (including cell type annotation) of C4_velo object were saved as a h5ad file. h5ad file was read in a jupyter notebook using scVelo package. Data were filtered and normalized. Moments were calculated using scvelo.pp.moments() command with number of pcs=20 and number of neighbours = 30 as options. Velocity estimation was performed using scvelo.tl.velocity() command in the default stochastic mode. PAGA estimation was then performed using scvelo.tl.paga() using default parameters. Combined scVelo and PAGA plot was generated using scvelo.pl.paga() command with alpha=.1, min_edge_width=2 and node_size_scale=1.5 as options.
AT2, AT1, Immature AT1, AT0 and TRB-SC cell clusters were subset from the epithelial subset of integrated Seurat object, with SoupX corrected counts. Principle component analysis was performed, and the number of significant dimensions were estimated by plotting standard deviations of principal components using ElbowPlot() function. UMAP embeddings were recalculated. This subset object henceforth referred to as “C4”. UMAP values calculated here were also used in “C4_velo” object described previously. Trajectory prediction was performed using slingshot v1.4.0 algorithm30 using UMAP embeddings of C4 object as the input.
Cell Data Set (CDS) object was manually created from C4 Seurat object by transferring the expression matrix, UMAP and PCA values, and associated metadata (including cell type annotation) for trajectory analysis using Monocle3 v0.2.3 algorithm. learn_graph() command was run with use_partition=TRUE option to identify the trajectories. An AT2 cell was manually selected after calling order_cells() command to be the origin for the pseudotime plot.
Counts and cell type annotation data from C4 Seurat object were exported to MATLAB .mat format using R.matlab v3.6.2 package. scEpath analysis was performed using default parameters in MATLAB. ETV5 gene was input to define the cell cluster from where cellular trajectories begin.
C4 Seurat object was converted to anndata format using sceasy::convertFormat() command. Both raw and normalised counts were transferred. Anndata object was read into a jupyter notebook using scanpy package. MuTrans analysis was performed on this object using these parameters: choice_distance= cosine, perplex=100, k_cluster=6, reduction_coord= umap and weight_scale=True.
Anndata object described above for Mutrans analysis was read into a jupyter notebook using scanpy package. Data was normalised and log-transformed. sc.pp.neighbors() command was run with the options n_neighbors=30 and n_pcs=20. Diffusion map was estimated using scanpy.tl.diffmap() with default parameters. Neighbour estimation was repeated with options use_rep=‘X_diffmap’ and n_neighbors=30. PAGA graph was calculated using scanpy.tl.paga() using default parameters. PAGA graph was plotted with a threshold of 0.02.
C4 Seurat object was used for pseudotime analysis. Trajectories predicted by Slingshot algorithm above, were used. Mitochondrial and ribosomal genes were removed before identifying genes that vary along pseudotime using gam() command of gam v1.20 R package as described in Strunz et al.6. Among the pseudotime variant genes, 10–40 genes enriched in each of the cell clusters for used to generate a heatmap using pheatmap v1.012 package. Smoothened line plots showing variation of individual genes were generated using the code provided in Strunz et al6.
Organoid scRNA-seq
scRNA-seq data from organoid cultures were demultiplexed using Cellranger v6.0.1 mkfastq wrapper (10x Genomics) for bcl2fastq2 (Illumina). FASTQ files were processed using Cellranger v6.0.1 (10x Genomics) software using GRCh38 (GENCODE v32/Ensembl 98) genome as a reference. Unique molecular identifier (UMI) counts were further analyzed using in R using Seurat v3.2.1 package. Data from EGF depletion, serum addition and control conditions were merged using merge() function. Data were normalized, variable genes identified and scaled before principal component analysis. Dimensional reduction was performed using RunUMAP() function. Genes enriched in TRB-SCs or AT0 cells when compared to AT2 and AT1 cells in human biopsy data were identified and top 20 of those were used to calculate TRB-SC or AT0 score respectively in organoids. Top 20 genes enriched in AT2 and AT1 cells from the same dataset were used to calculate AT2 or AT1 score respectively in organoids.
Comparison of scRNA-seq data from cultured and in vivo AT0 cells
Cell clusters with highest AT0 score in EGF depleted and serum treated cultures were considered to be AT0s. Cell cluster with highest AT2 score in control organoids were considered AT2s. Gene expression in AT0s relative to AT2s was calculated by FindMarkers() command in Seurat with the options min.pct = 0.2 and logfc.threshold = 0.1. Similarly, gene expression in in vivo AT0s relative to in vivo AT2s was calculated. Only the genes identified in both in vivo and organoid datasets were used for further analysis. Pearson correlation between cultured AT0s and in vivo AT0s was calculated using cor() function in R.
Spatial Transcriptomics data processing and analysis
Fiducial dots on H&E image were manually aligned using Loupe browser v5.0.1 (10x Genomics). Fastq files and aligned H&E images were processed with Spaceranger v1.2.2 software (10x Genomics) using GRCh38 (GENCODE v32/Ensembl 98) genome as reference. Spot UMI table and reference H&E image were further analysed using Seurat v4.0.1 on R. Data were normalized using SCTransform v0.3.2 algorithm. Spatial gene expression was visualized using SpatialFeaturePlot() command. For better visualization, ST dots were superimposed manually on high resolution H&E image. Dimensional reduction was performed using RunPCA() and RunUMAP() commands and spots were clustered based on SSN algorithm. Markers for each cluster were identified using the FindAllMarkers() command and heatmaps were plotted using doHeatmap() function.
scRNA-seq data on distal airways generated in this study were integrated with ST data using Seurat package. SCTransform assay of the scRNA-seq object was used to find anchors using FindTransferAnchors() command. Predicted positions of cells were obtained using TransferData() command and visualised using SpatialFeaturePlot() command.
Image acquisition, processing and quantification
All confocal images were collected using Olympus Confocal Microscope FV3000 equipped with 10X, 20X, 40X and 60x objectives using Fluoview FV31S-SW v2.1.1.98. Experiments were performed on at least three biological replicates unless stated otherwise and representative images were shown. For organoid number and size quantification, images were obtained using 1.25x objective, all other phase contrast images were taken at 10x or 20x objective using Zeiss Axiovert 200 microscope using Zen 2012 Blue Edition software. For quantification of AT0 and TRB-SCs, five to seven organoid sections were used from control and EGF depleted conditions. Images were processed using Fiji or Olympus Fluoview software.
Statistics and reproducibility
All data shown in this work, except spatial transcriptomics (Visium), have been performed at least twice with consistent results. The presented data were performed on biologically independent samples. Sample size was not predetermined. Unless otherwise indicated, data were presented as means with standard error (SEM) to indicate the variation within each experiment. Statistical analyses were performed in Excel, GraphPad Prism and R. Unless otherwise indicated, two-tailed t-test was used for assessing significance.
Data Availability
scRNA-seq data generated in this study are available from GEO under accession code GSE178360 (human airways) and GSE178519 (organoids). Spatial transcriptomics data generated in this are available under accession code GSE178361.
snRNA-seq data from monkey lungs44 is available at Genome Sequence Archive (GSA: CRA002577). Human lung scRNA-seq datasets from Travaglini et al11 are available on synapse (https://www.synapse.org/#!Synapse:syn21041850 ), Habermann et al12 on GEO (accession # GSE135893), Deprez et al23 on UCSC cell browser (and also European Genome-Phenome Archive # EGAD00001005714), Miller et al28 on EMBL-EBI Array Express database (accession #E-MTAB-8221).
Source data are provided with this paper.
Code availability
All analyses performed in this study used pre-existing packages mentioned in the methods. No custom code was generated.
Extended Data
Extended Data Fig. 1. Spatial transcriptomics of cartilaginous airway and distal lung.
Heatmap shows differentially expressed genes in each cluster of ST assay from proximal airway. b. ST spots show expression of indicated genes from proximal airway. c. Heatmap indicates differentially expressed genes in each cluster of ST assay from the distal lung. d. ST spots indicate the expression of indicated genes from the distal lung.
Extended Data Fig. 2. scRNA-seq of human distal airways and alveoli.
a. UMAPs show the expression of cell class specific marker genes. b. Dot plot indicates expression of cell type specific markers. c. UMAP shows the annotation of cell types from blood (c), endothelial (d), and mesenchymal (e) lineages. f. H&E reference sections and ST spots show the expression of RNASE1 in proximal (top) and distal airway (bottom). g. ST spots show the expression of MUC5AC, SFTPB, MUC5B and SCGB3A2 in proximal and distal airways as indicated. h. PLISH for RNASE1 (grey), MUC5B (green) and SFTPB (red) in proximal (top) and distal airways (bottom). Scale bar: 50 μm. i. Visualisation of indicated epithelial cell transcriptomic signatures on ST tissue section from distal lung.
Extended Data Fig. 3. Molecularly distinct cell types and zones in human airway.
a. Immunostaining for MUC5B (blue), MUC5AC (red), SCGB1A1 (green) and SCGB3A2 (grey) (bottom panel). Lines illustrate described zones. Scale bar: 100 μm. b. Quantification of distal airway epithelial cell types across the airway zones. Data is presented as mean ± SEM. (n=4 for zone-1 and n=3 for zones-2, 3 and 4). c. Co-staining for SCGB3A2 (green), SCGB1A1 (red), SFTPB (grey) in different regions of the human airway. Scale bar: 100 μm. d. Staining for SCGB1A1 (blue), MUC5B (green), SFTPB (red) and SCGB3A2 (grey) in different regions of the airway. Scale bar: 100 μm (main panel) and 20 μm (inset). e. Box plot showing the difference in cell populations identified in this study (red bar) and Habermann et al., (turquoise bar). Line in the box: median; box edges: 25/75 percentile; whiskers: 1.5 times interquartile range; points: outliers. f. Dot plot shows expression of indicated genes in TRB-epithelial cells (this study) but not in Deprez et al., scRNA-seq data from airway epithelial cells (annotated as distal airway). In panels c and d, images were stitched to show large area. Insets show zoomed images of regions highlighted in boxes. g. UMAP plots show the expression of indicated genes in epithelial cells. h. UMAP plots show the expression of indicated genes in epithelial cells. i. (top) Immunostaining for SCGB3A2 (green), SCGB1A1 (grey) and NAPSA (red) showing the expression of NAPSA in TRB-SC and TB-SC. Scale bar: 10 and 20 μm. (bottom) RNA-FISH for SCGB3A2 (green), TMEM45A (red) and SCGB1A1 (grey) showing the expression of TMEM45A in TRB-SC and TB-SC. Scale bar: 20 μm. j. PLISH for SCGB3A2 (green), SFTPB (red) and KDR (grey). Scale bar 50 μm. k. UMAPs show the expression of indicated genes in epithelial cell types. l. Bar plot showing the pathways enriched in TRB-SCs.
Extended Data Fig. 4. Gene expression signatures and pathway analysis of AT0s, distal-BCs and SCGB3A2-CCs.
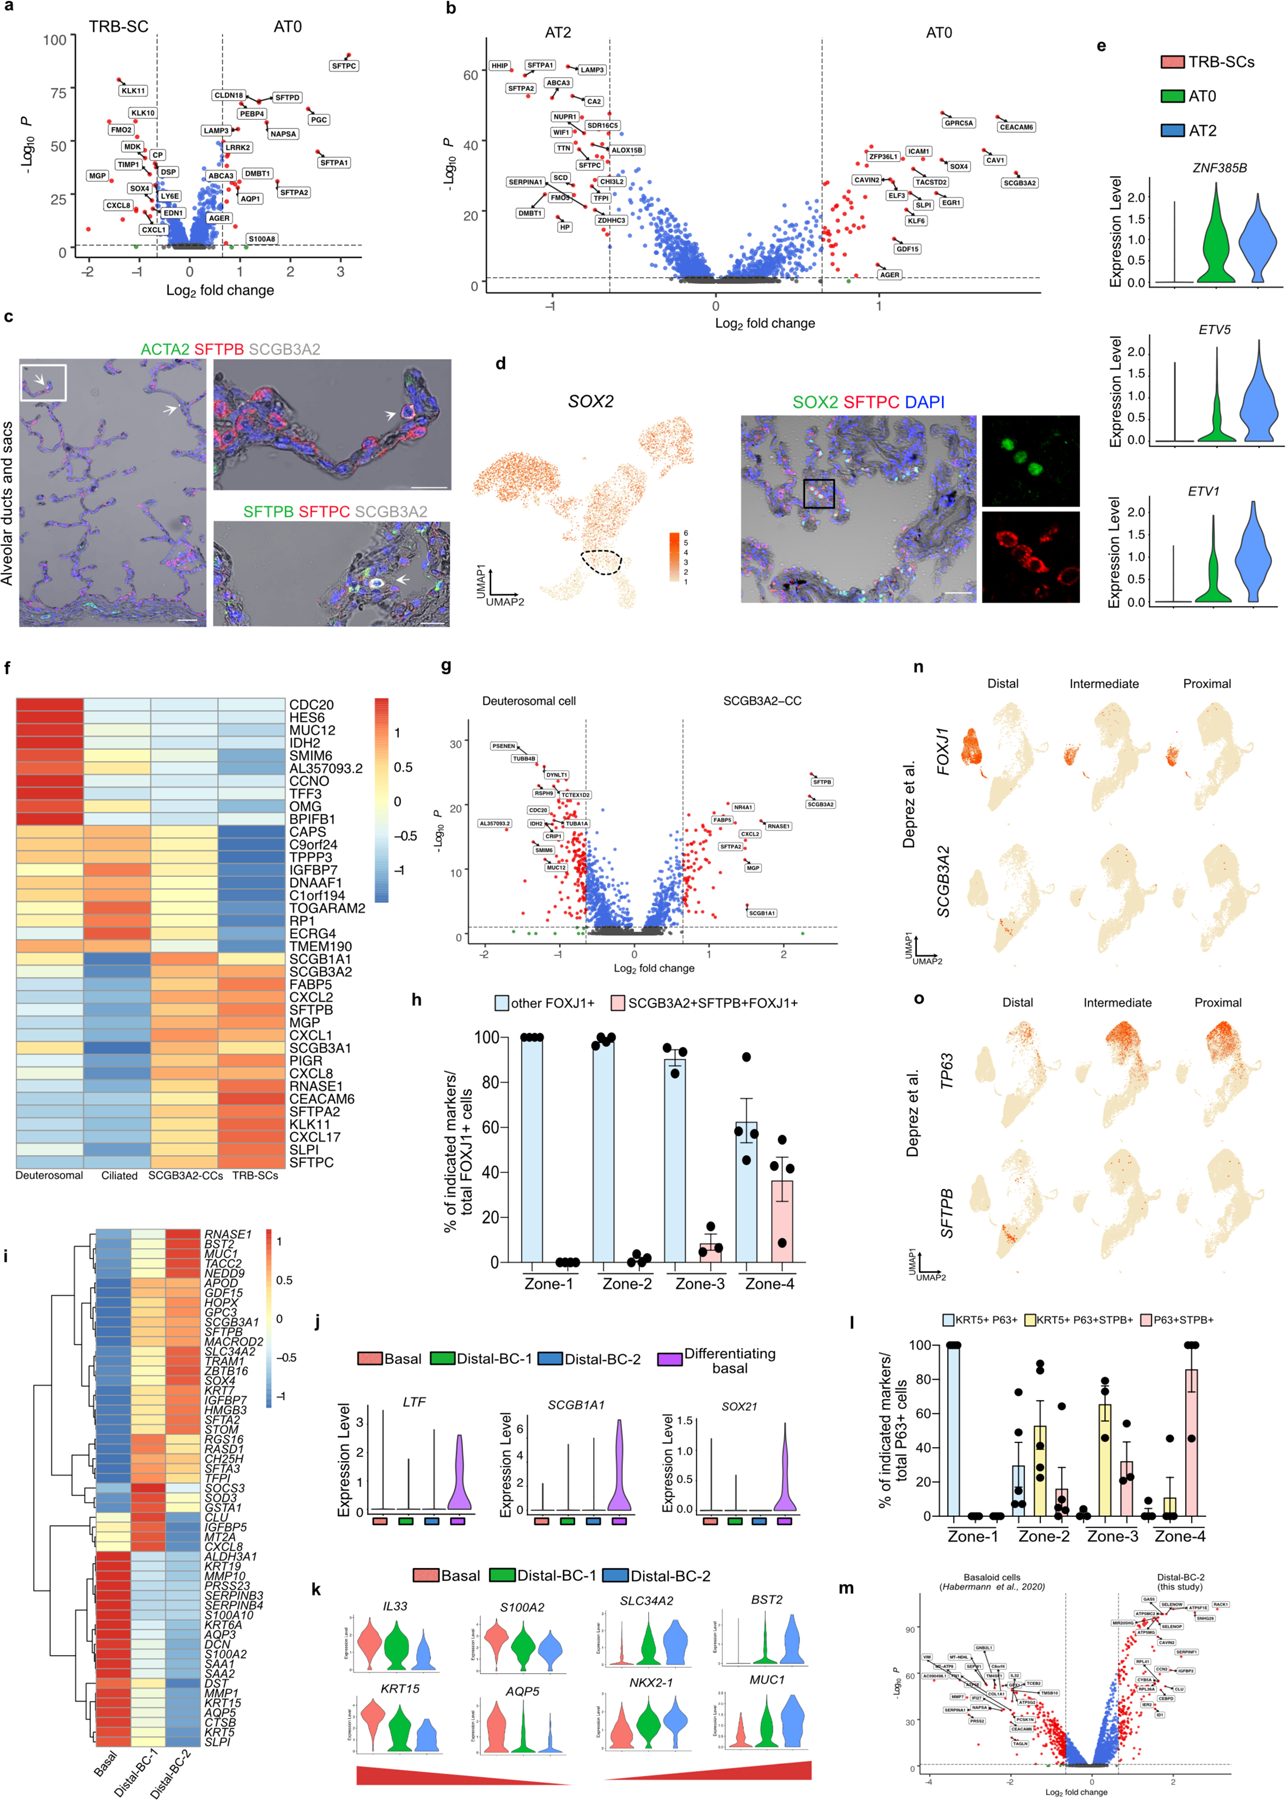
a. Volcano plot shows differential gene expression between TRB-SC and AT0s. b. Volcano plot shows differential gene expression between AT2 and AT0s. c. Immunostaining for ACTA2 (green), SFTPB (red) and SCGB3A2 (grey) (left and top right) showing rare AT0s found in alveolar septae in normal lungs. Immunostaining for SFTPB (green), SFTPC (red) and SCGB3A2 (grey) (bottom right) showing alveolar sacs. Scale bar: 50 and 20 μm. d. UMAP plot and immunostaining for SOX2 (green), SFTPC (red) show the expression of SOX2 in AT0s near respiratory bronchioles. Scale bar: 50 μm. Inset: individual channels of regions indicated by a black box. e. Violin plots show expression patterns of genes encoding indicated transcription factors in TRB-SC, AT0, and AT2s. f. Heatmap shows expression of indicated genes in deuterosomal, ciliated, SCGB3A2-CC and TRB-SC cell populations. (Scale shows z-score). g. Volcano plot shows differential gene expression between SCGB3A2-CC and deuterosomal cell populations. h. Quantification of SCGB3A2-CC cell type across the airway zones. Data is presented as mean ± SEM (n=4 for zones-1, 2 and 4; n=3 for zone-3). i. Heatmap shows expression of indicated genes in basal, distal-BC1 and distal-BC2 cell populations. (rows were hierarchically clustered and scale shows z-score). j. Violin plot shows the expression of indicated genes in basal cell populations. k. Violin plot demonstrates the expression of indicated genes in different basal cell populations. l. Quantification of distal basal cell types across the airway zones. Data is presented as mean ± SEM (n=4 for zone-1, n=5 for zone-2, n=3 for zone-3 and n=4 for zone-4). m. Volcano plot shows differential gene expression between IPF basaloid (from Habermann et al.,) and distal-BC2 cell populations. n and o. UMAPs show the expression of TP63, SFTPB and FOXJ1 and SCGB3A2 in distal, intermediate and proximal airway cells profiled in Deprez et al.
Extended Data Fig. 5. Transcriptional regulation of TRB-specific epithelial cells.
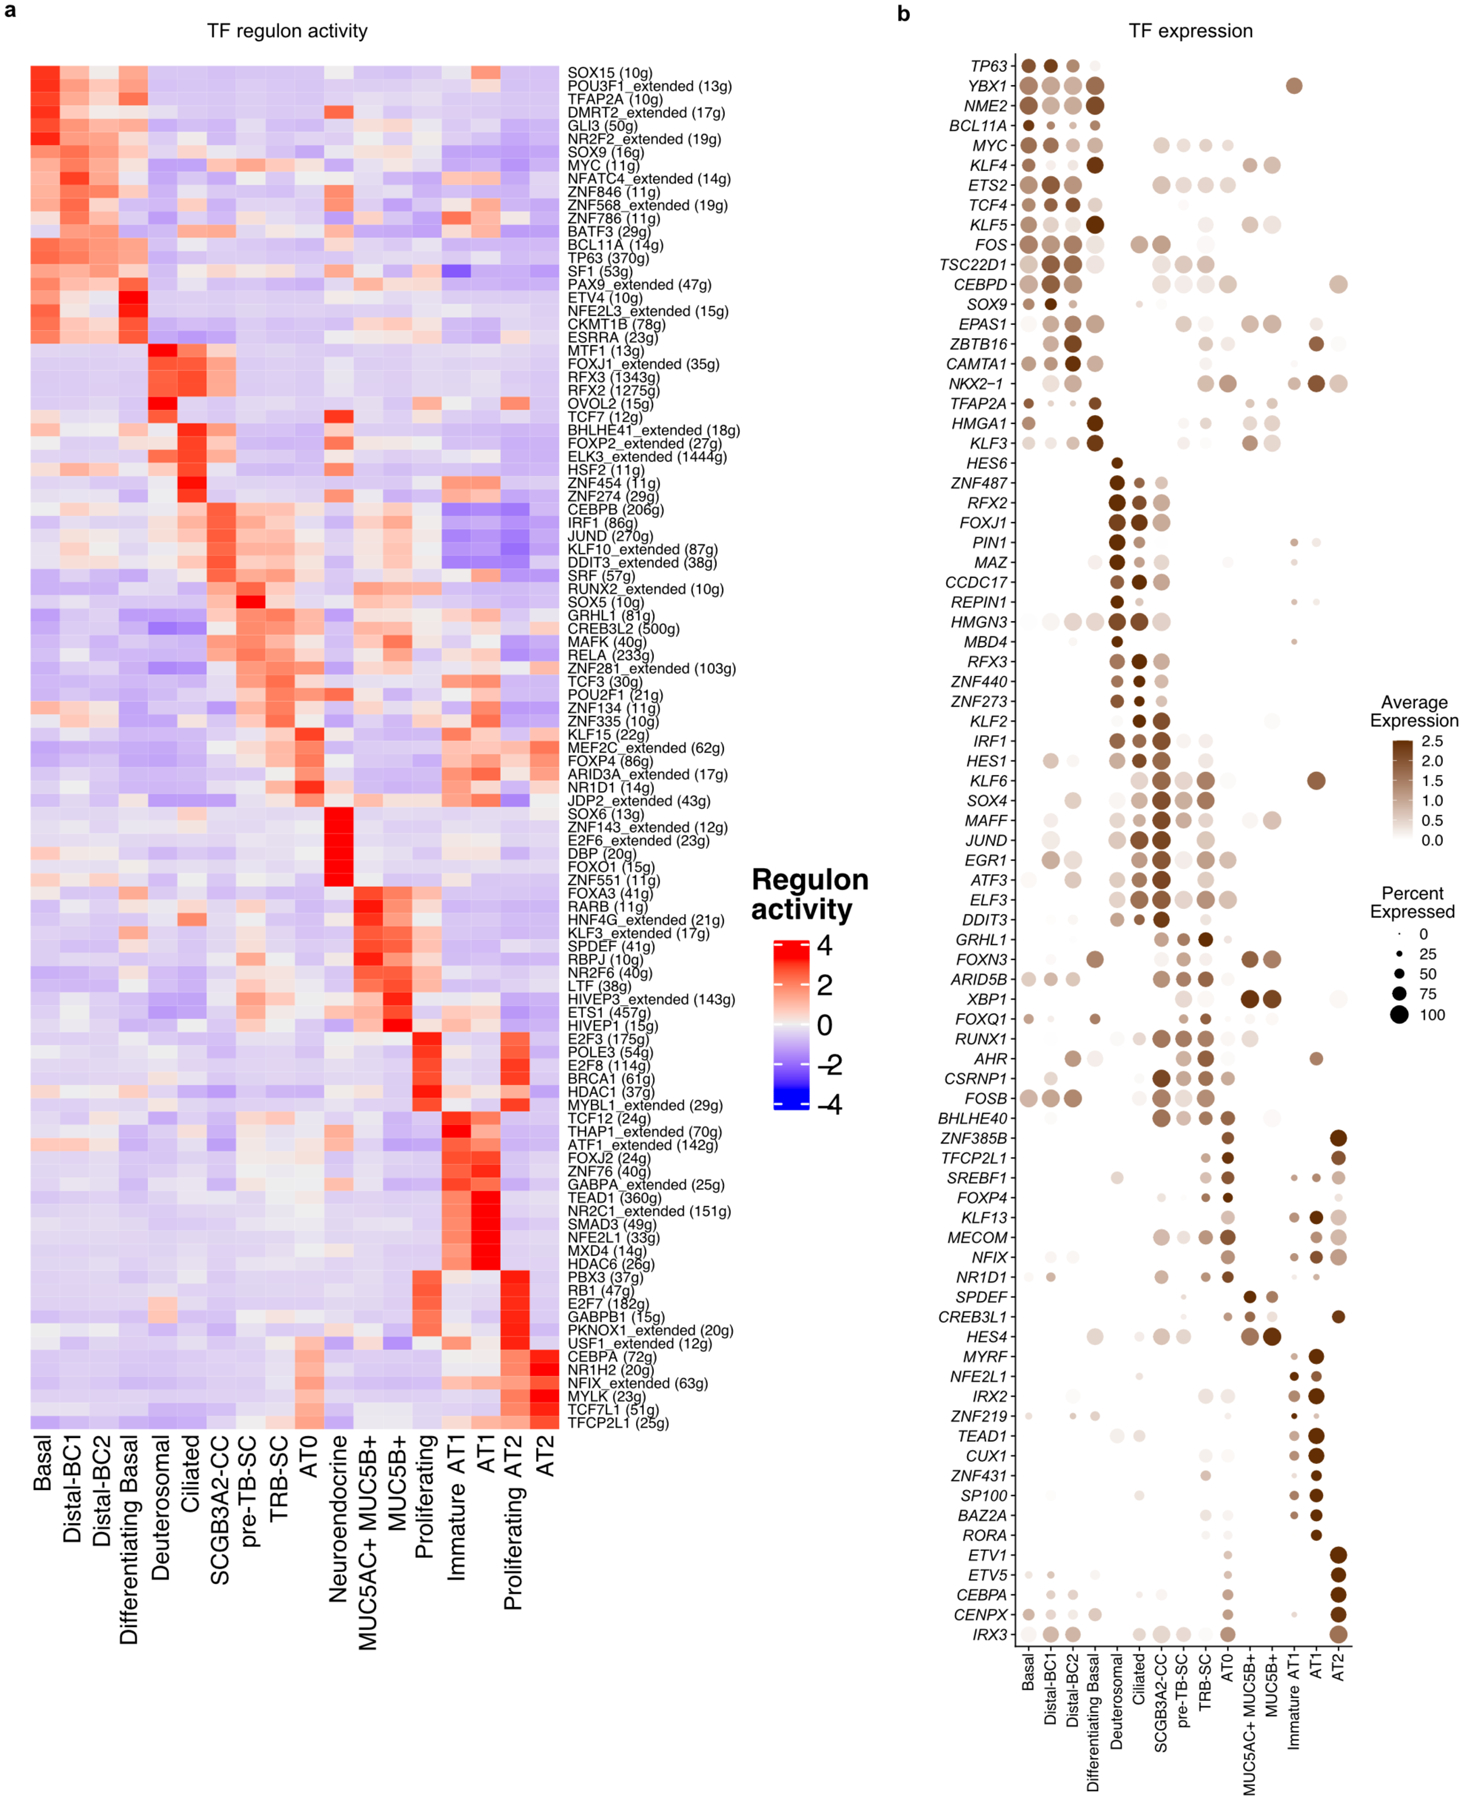
a. Heatmap showing the enrichment of transcription factor regulons in epithelial cell types. b. Dot plots indicate the expression of transcription factors in epithelial cell types.
Extended Data Fig. 6. Molecular and phenotypic differences of basal cells isolated from proximal and distal airways.
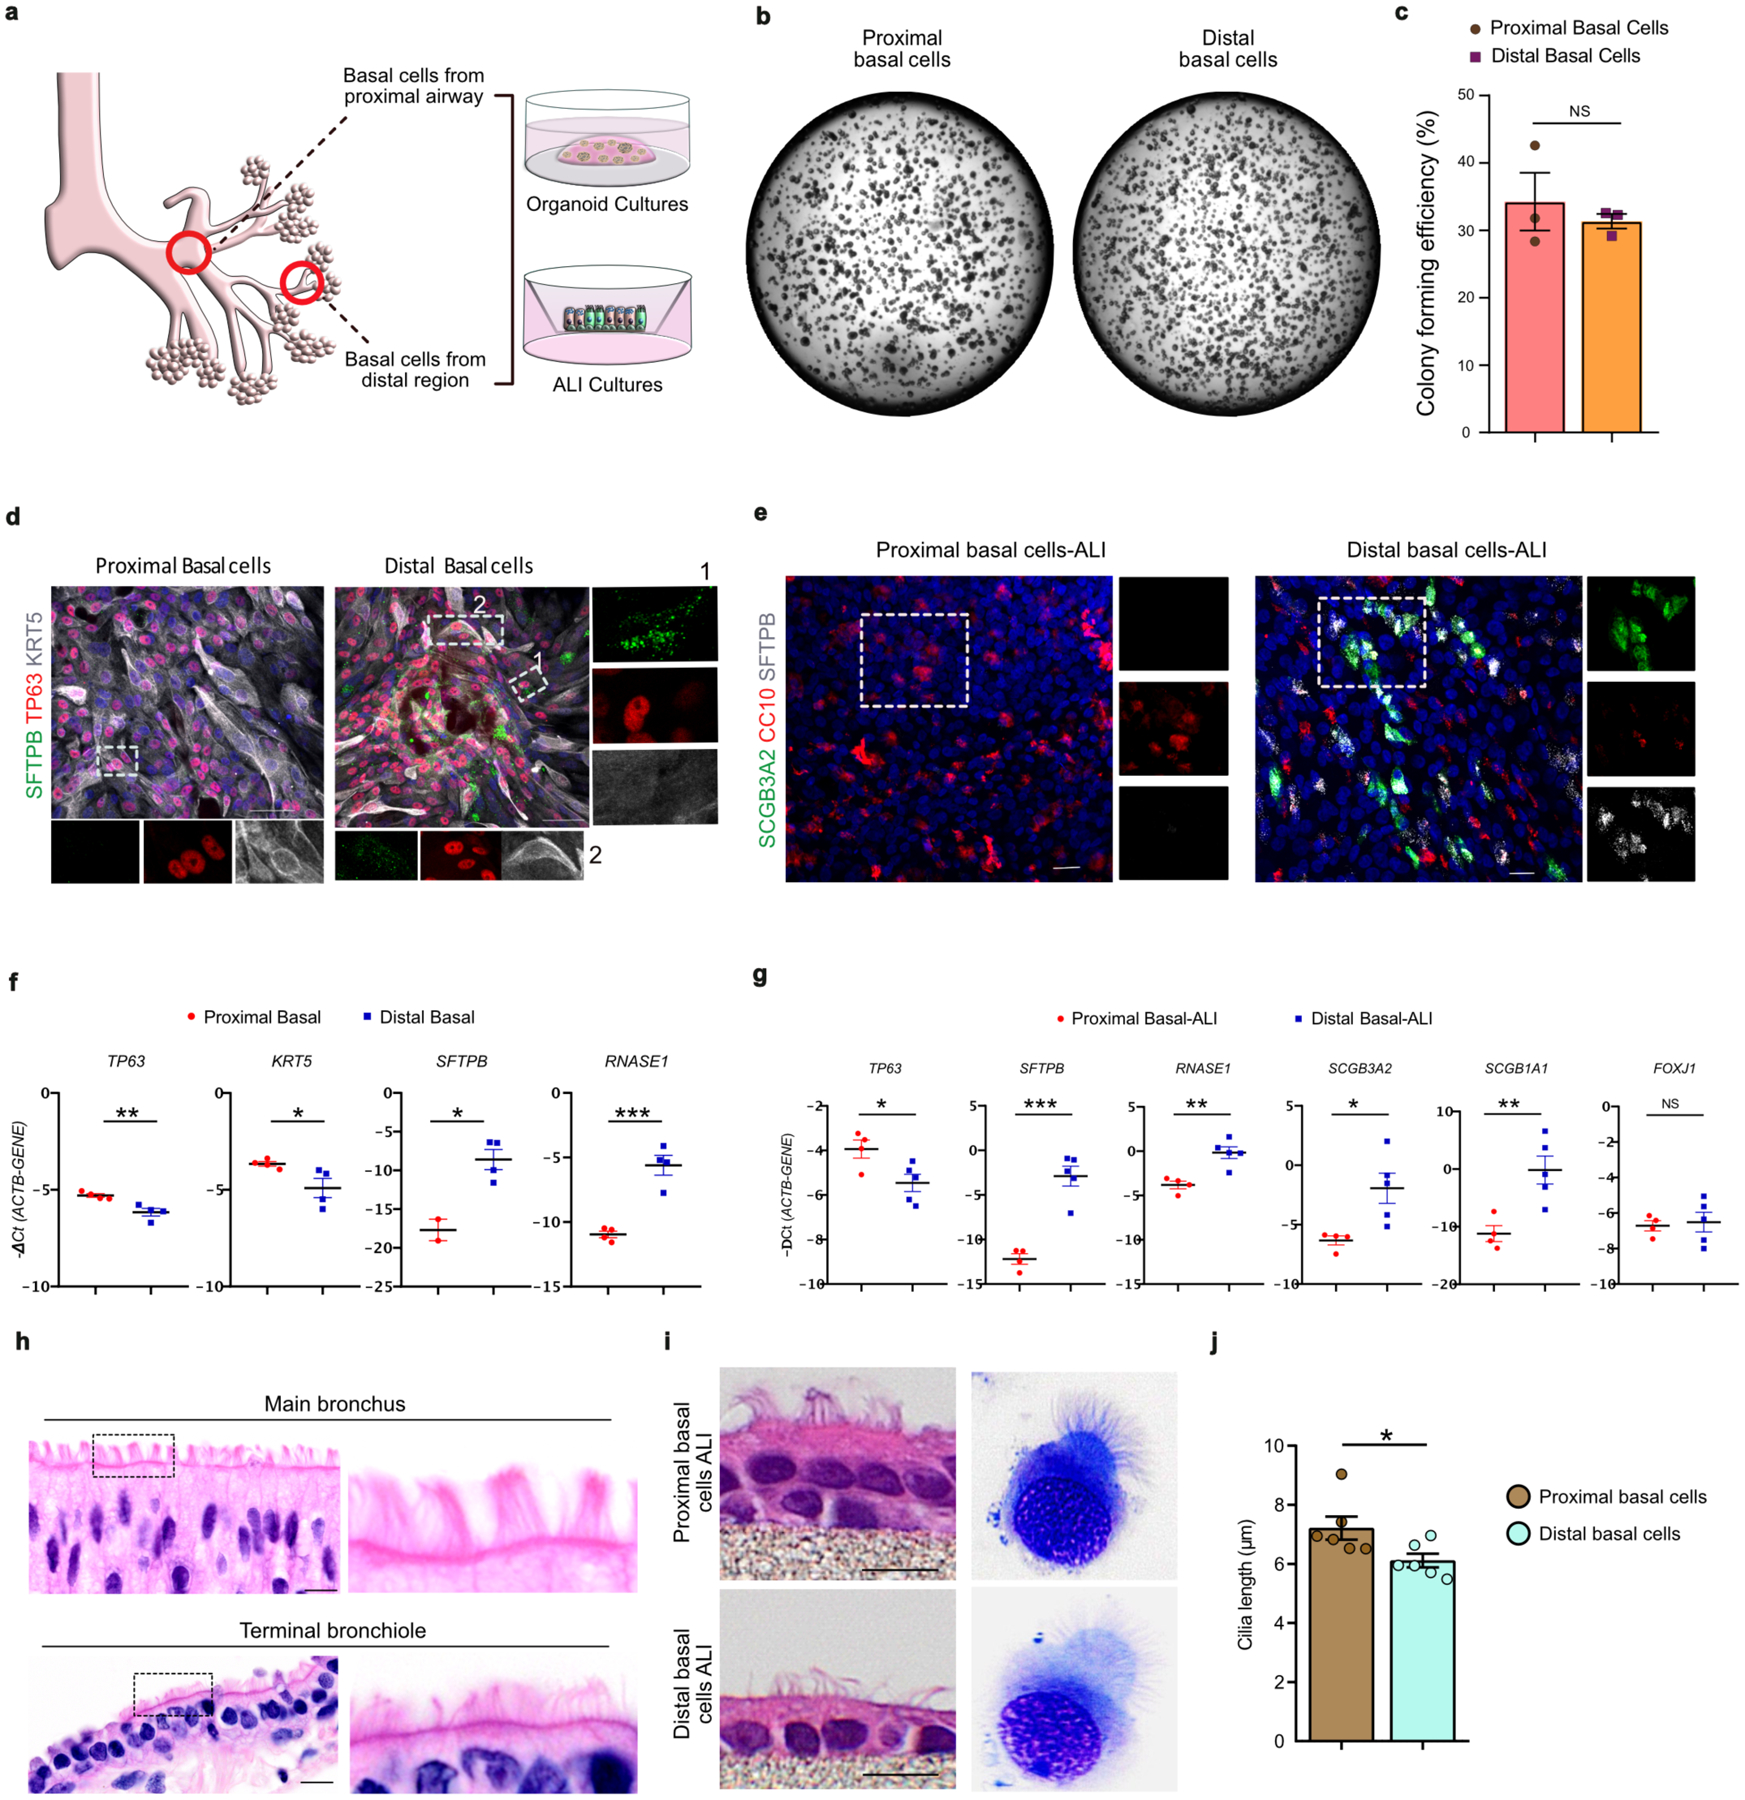
a. Schematic depicting the location of airway for sampling the basal cells (top, proximal airways and bottom, distal airways) for organoid cultures and Air liquid interface (ALI) cultures. b. Representative basal cell organoid images of proximal and distal airways. c. Quantification of the colony formation efficiency (CFE). Data is presented as mean ± SEM. NS (p = 0.5462) (unpaired two-tailed t-test) (n=3). d. SFTPB (green), TP63 (red) and CK5 expression (grey) on 2D cultures. Scale bar 50 μm. e. Representative whole mount immunostaining image for SCGB3A2 (green), SCGB1A1 (red) and SFTPB (red) expression in basal cell ALI culture of proximal and distal airways at day 28. Scale bar: 20 μm. f. Relative mRNA expression of TP63, SFTPB, KRT5 and RNASE1 in basal cell cultures. Data is presented as mean ± SEM. (** p = 0.0073 for TP63), (* p = 0.0490 for KRT5), (* p = 0.0130 for SFTPB) and (*** p = 0.0006 for RNASE1) (unpaired two-tailed t-test) (n=3, distal airway; n=4, proximal airway, SFTPB mRNA was not detected in two biological replicates of proximal airway). g. Relative mRNA expression of TP63, SFTPB, RNASE1, SCGB1A1, SCGB3A2, and FOXJ1 in basal cell ALI culture of proximal and distal airways at day 28. Data is presented as mean ± SEM. (* p = 0.0312 for TP63), (*** p = 0.0003 for SFTPB), (** p = 0.0028 for RNASE1), (* p = 0.0234 for SCGB3A2), (** p = 0.0071 for SCGB1A1), and (NS p = 0.75 for FOXJ1) (unpaired two-tailed t-test with Welch’s correction) (n=5, distal airway; n=4, proximal airway). h. Representative histology images showing the difference in ciliary length in proximal and distal airways. Scale bar: 10 μm. i. Representative histology images showing the difference in ciliary length in basal cell ALI culture proximal and distal airways at day 28. Scale bar: 10 μm. j. Quantification of cilia length and cilia beating frequency in basal cell ALI culture of proximal and distal airways. Data is presented as mean ± SEM. * (p = 0.0359) (unpaired two-tailed t-test) (n=6).
Extended Data Fig. 7. Transcriptional and signalling activity of newly identified mesenchymal cells.
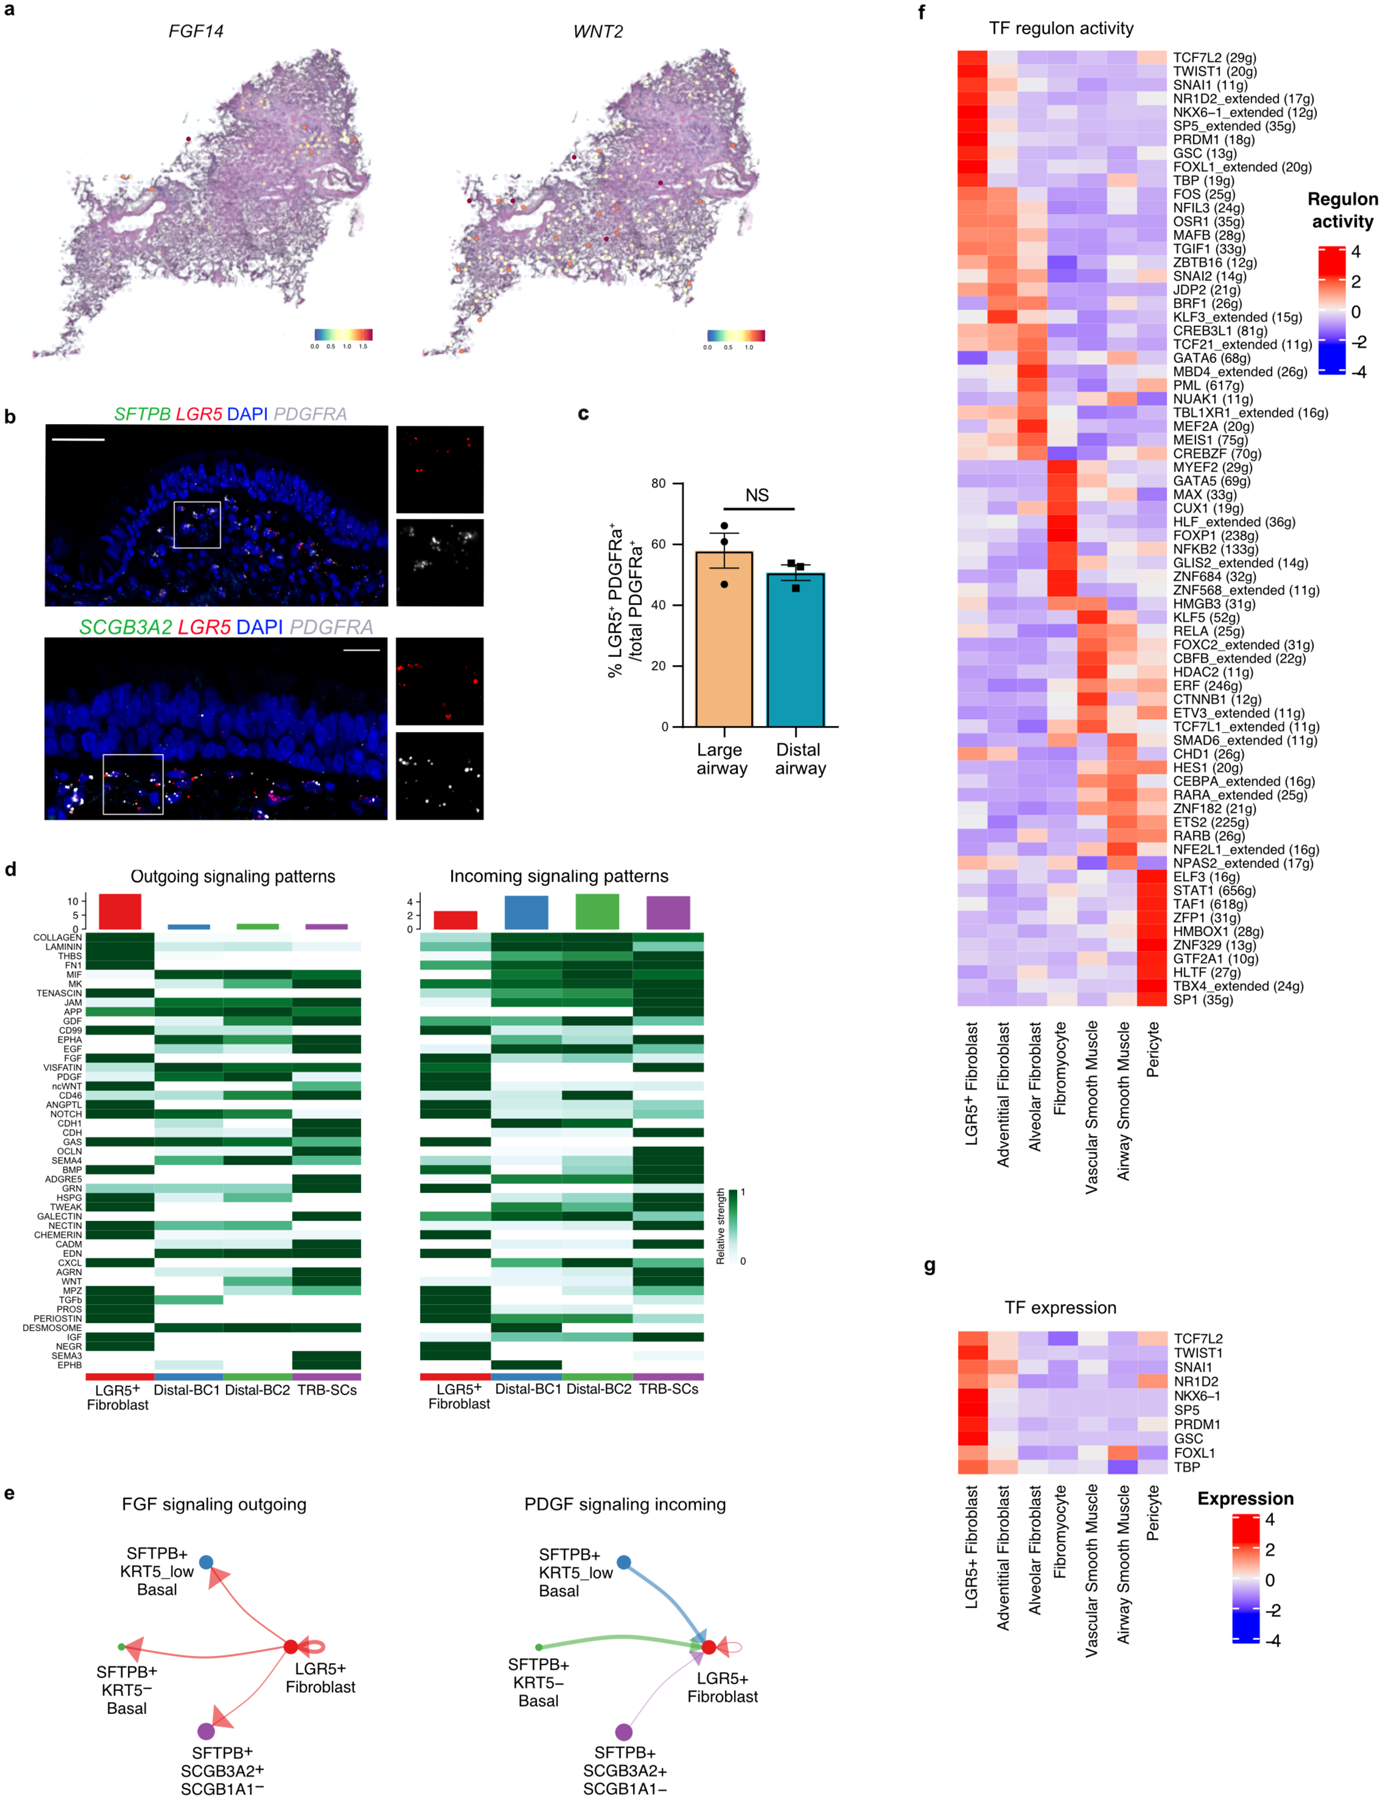
a. ST spots show the expression of FGF14 and WNT2. b. Representative RNA-FISH images showing the expression of SFTPB (green), LGR5 (red) and PDGFRA (grey) (left) and SCGB3A2 (green), LGR5 (red) and PDGFRA (grey) (right) and Scale bar: 50 μm and 20 μm. DAPI stains nuclei (blue). Insets show magnified regions. c. Quantification of LGR5+ fibroblasts in large and distal airway. Data is presented as mean ± SEM. NS (p = 0.3152) (unpaired two-tailed t-test) (n=3) d. Heatmap showing net outgoing and incoming signals in respective cell types as predicted by Cellchat algorithm. e. FGF and PDGF signalling activity from (top panel) and towards (bottom panel) LGR5+ cells and their interaction with epithelial cells as predicted using CellChat algorithm. f. Heatmap shows the enrichment of transcription factor regulons in mesenchymal cell types. g. Heatmap shows LGR5+ fibroblast specific transcription factor expression pattern in mesenchymal cell types (scale shows z-score).
Extended Data Fig. 8. LGR5-mRFP reporter validation and co-culture.
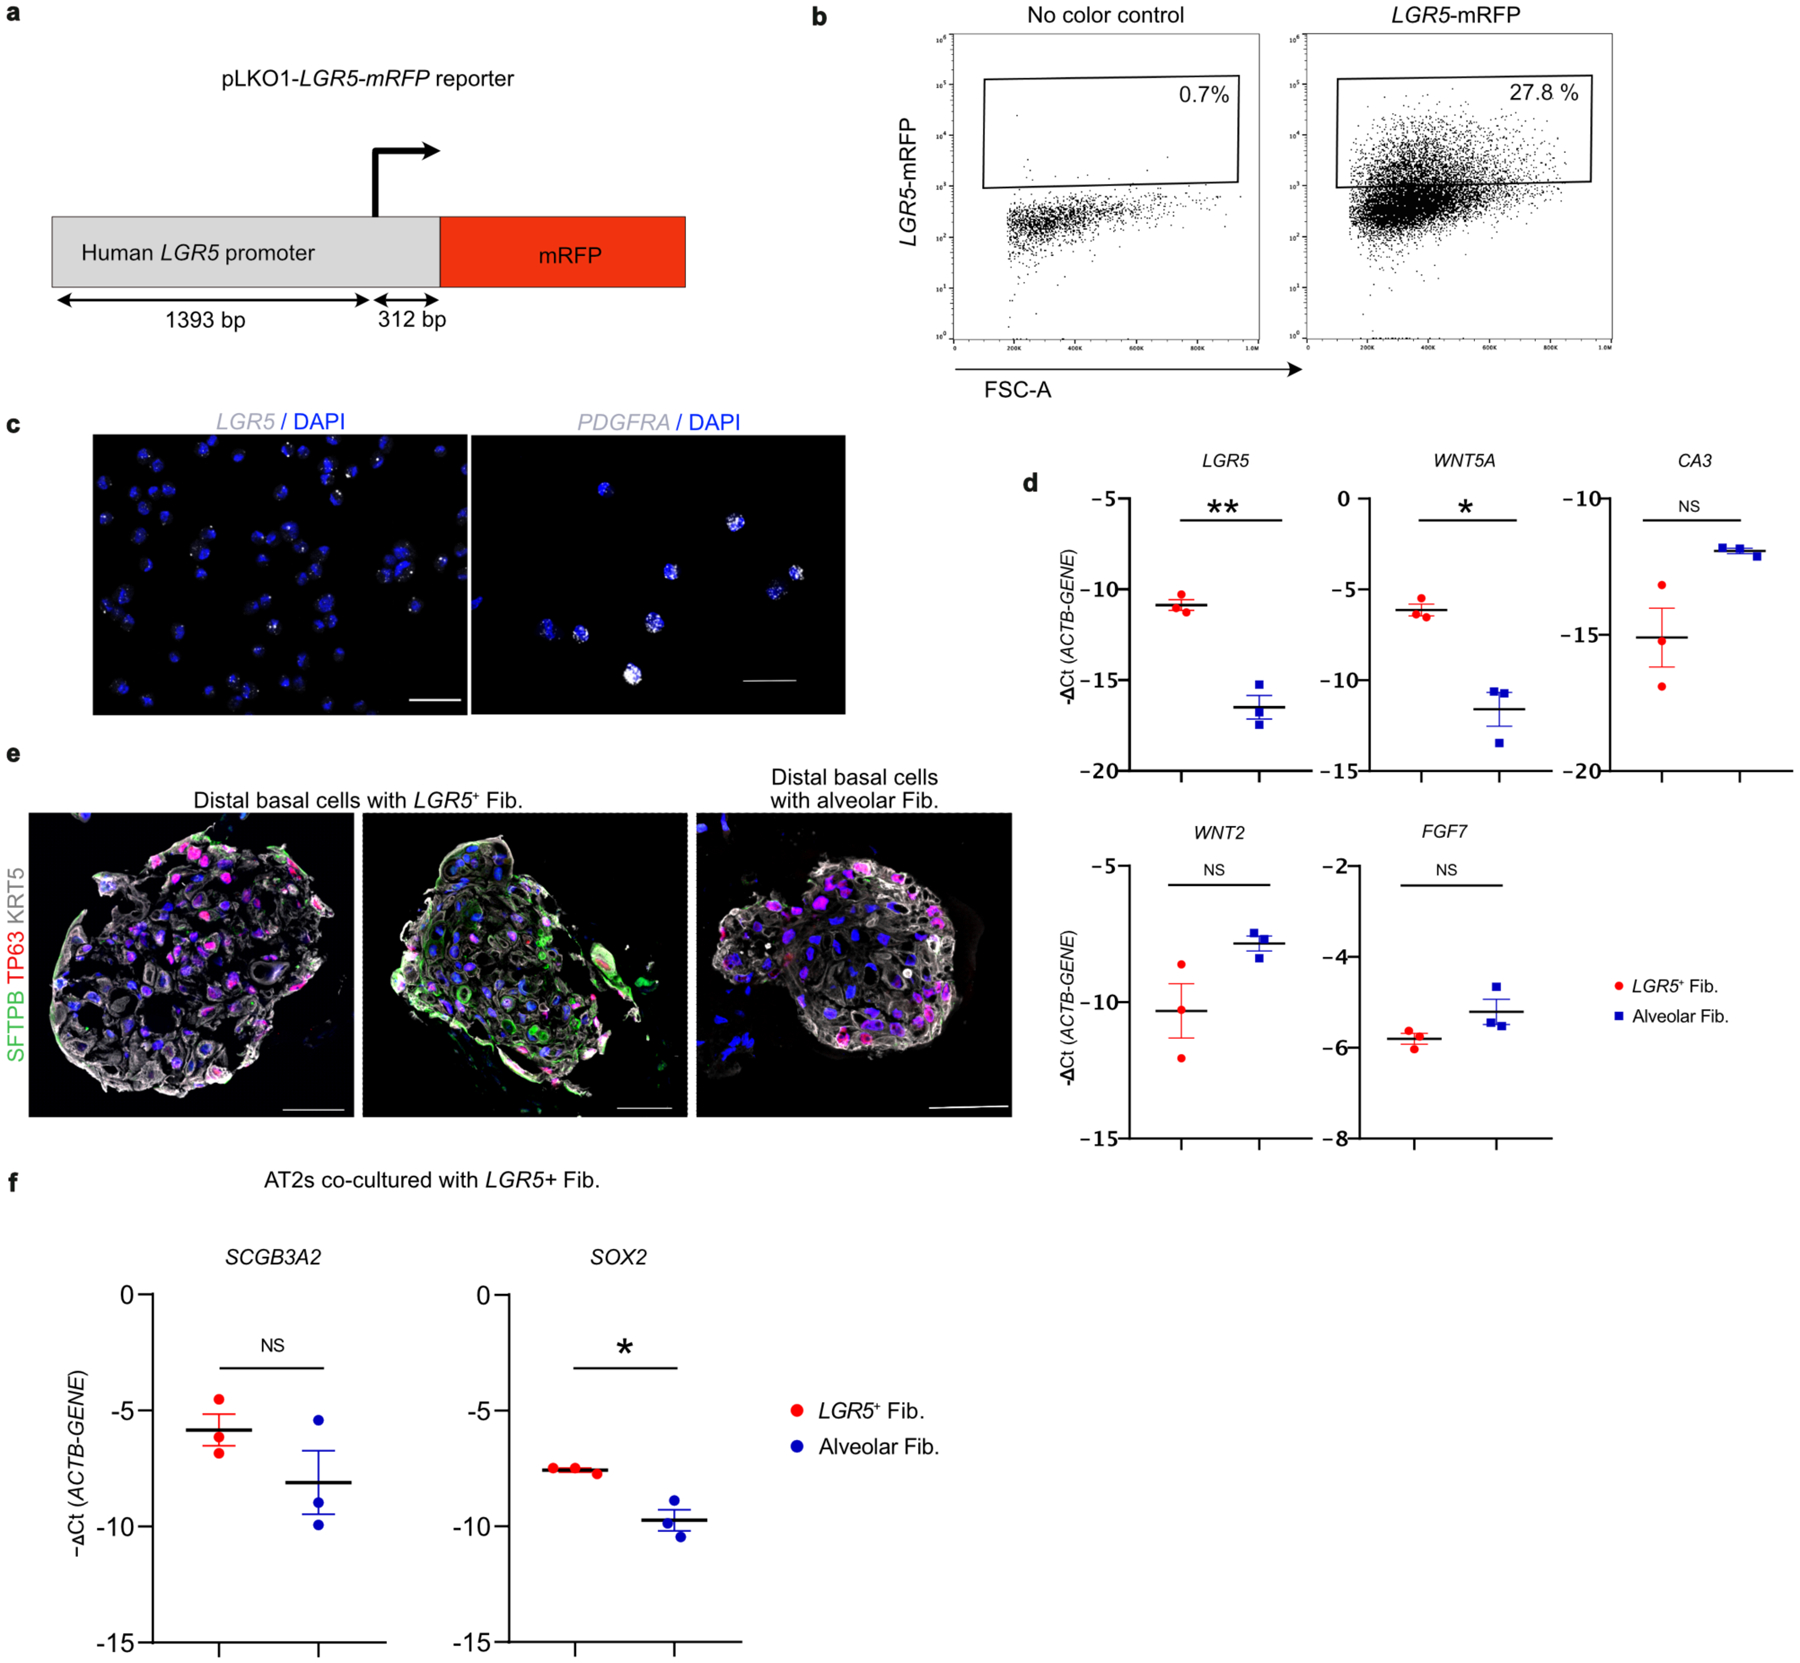
a. Schematic depicting pLKO-LGR5-mRFP reporter construct. b. Representative gating for FACS sorting of LGR5-mRFP reporter fibroblasts utilized for organoid co-cultures. c. RNA-FISH for LGR5 (left), and PDGFRα (right) on LGR5-mRFP fibroblasts. d. Relative mRNA expression of LGR5, WNT5A, WNT2, CA3, and FGF7 in cultured LGR5-mRFP fibroblasts vs alveolar fibroblasts. Data is presented as mean ± SEM. (** p = 0.0055 for LGR5), (* p = 0.0187 for WNT5A), (NS p = 0.0972 for CA3), (NS p = 0.1216 for WNT2), and (NS p = 0.1525 for FGF7) (unpaired two-tailed t-test with Welch’s correction) (n=3). e. Immunostaining for SFTPB (green), TP63 (red) and KRT5 (grey) in basal cell organoid co-cultured with LGR5-mRFP fibroblasts or alveolar fibroblasts. Scale bar: 50 μm. f. Relative mRNA expression of SCGB3A2 and SOX2 in AT2s co-cultured with LGR5-mRFP fibroblasts. Data is presented as mean ± SEM. NS p = 0.2383, and *p = 0.0383 and (unpaired two-tailed t-test with Welch’s correction) (n=3).
Extended Data Fig. 9. Expression pattern of markers of distal airway cells in fetal and post-natal human airways.
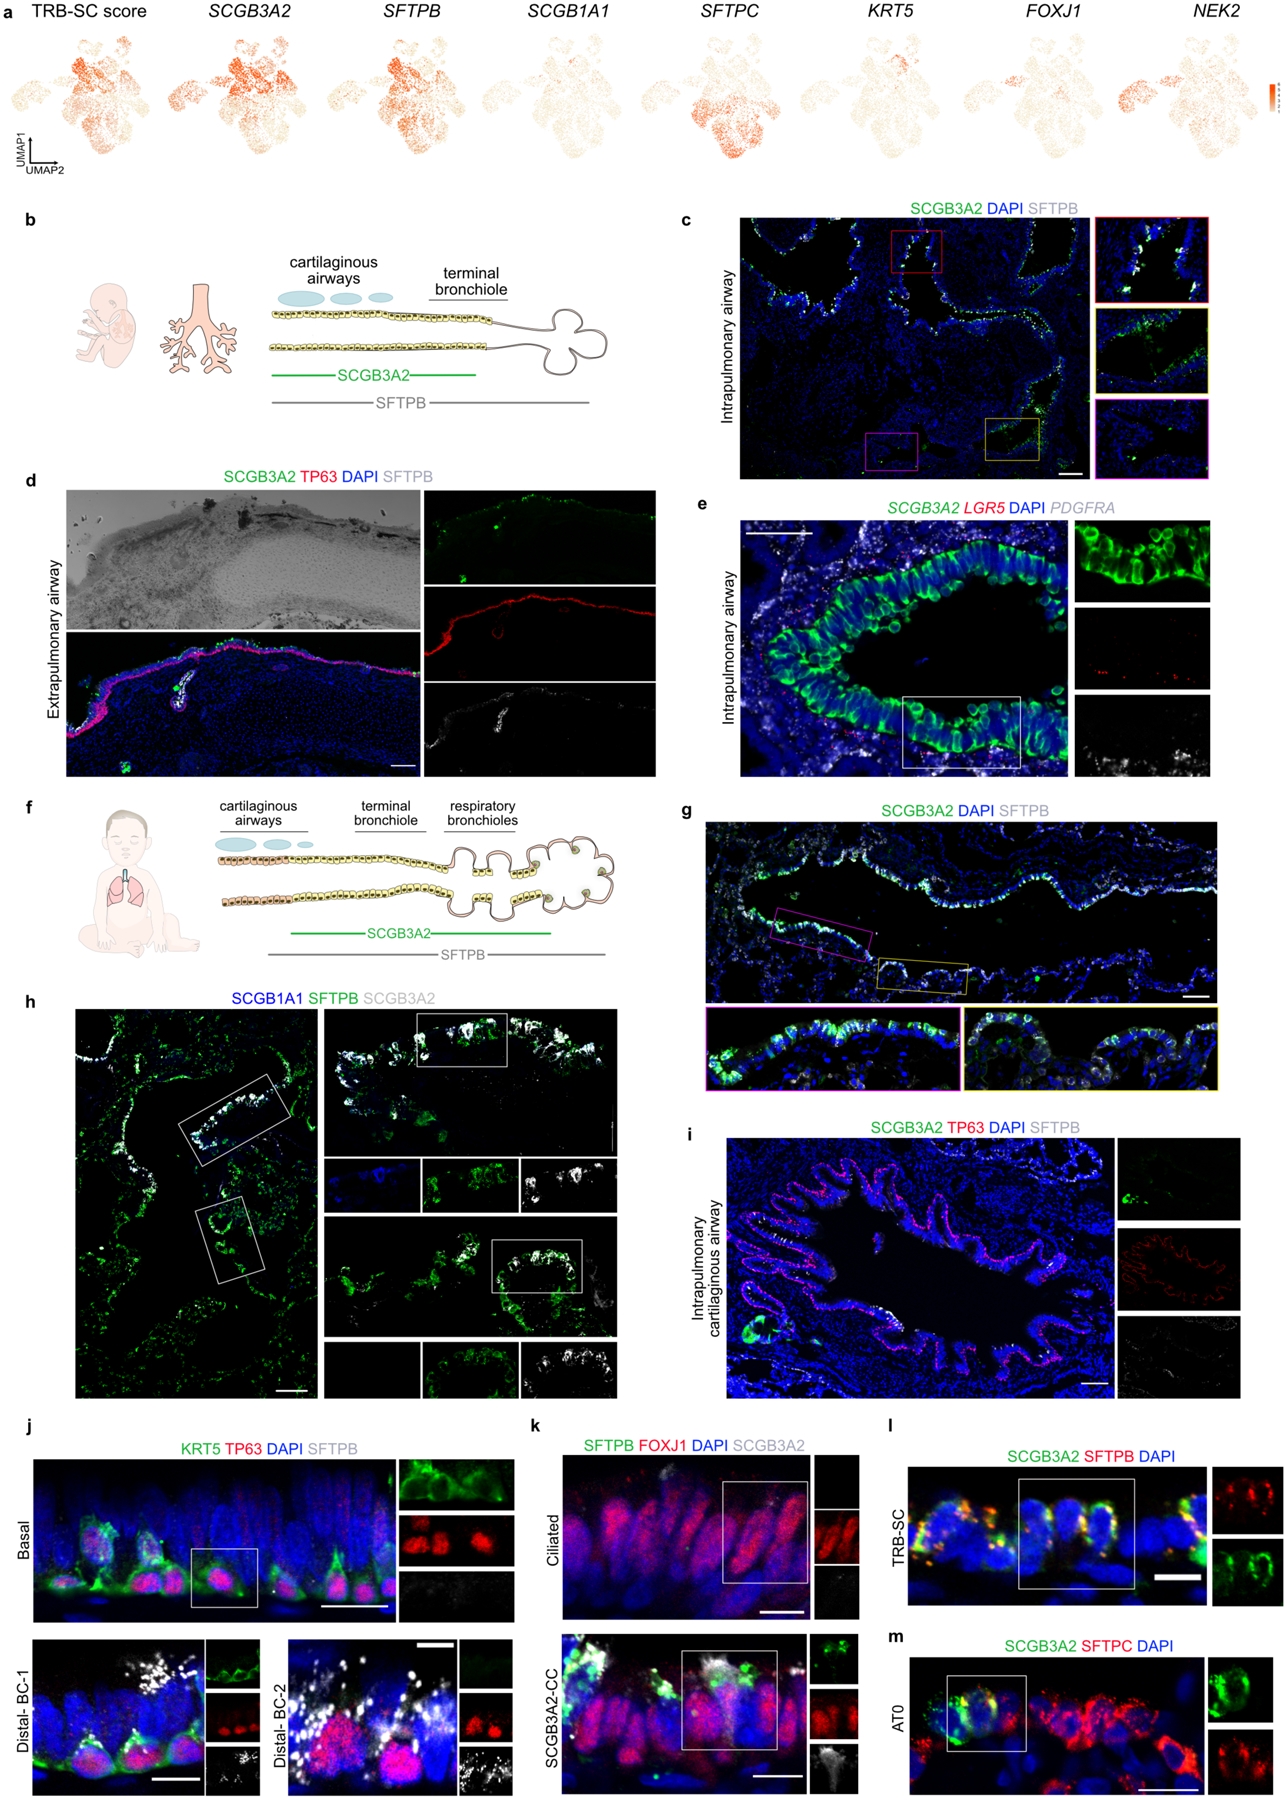
UMAP shows expression pattern of indicated genes in fetal lung epithelial scRNA-seq data from Miller et al. b. Schematic representation of human fetal airway and distal tip bud. c. Immunostaining for SCGB3A2 (green) and SFTPB (grey) on 19–20 weeks old human fetal lung. Scale bar 100 μm. Insets show magnified regions. d. Immunostaining for SCGB3A2 (green), TP63 (red) and SFTPB (grey) in human fetal extrapulmonary airway. Scale bar: 100 μm. e. Representative RNA-FISH images showing the expression of SCGB3A2 (green), LGR5 (red) and PDGFRA (grey). Scale bar: 50 μm. DAPI stains nuclei (blue). f. Schematic representation of human postnatal lung showing TRBs and distal alveoli. g. Co-staining for SCGB3A2 (green) and SFTPB (grey) in 7-month-old postnatal human lung. Scale bar 100 μm. Insets show magnified regions. h. Immunostaining for SCGB1A1 (blue), SCGB3A2 (grey) and SFTPB (green) expression in postnatal human lung. Scale bar: 100 μm. i. Co-staining for SCGB3A2 (green), TP63 (red) and SFTPB (grey) expression in 7–12 months old post-natal lung. Scale bar: 100 μm. j-m. Representative immunostaining images from 7 months old postnatal human lung show the expression of (j) KRT5 (green), TP63 (red) and SFTPB (grey). Scale bars: 20 μm (top), 10 μm (bottom left) and 5 μm (bottom right). (k) SFTPB (green), FOXJ1 (red) and SCGB3A2 (grey). Scale bar: 10 μm. (l) SCGB3A2 (green) and SFTPB (red). Scale bar 10 μm. (m) SCGB3A2 (green) and SFTPC (red). Scale bar 20 μm. DAPI stains nuclei (blue). c, e-m: Insets indicate individual colour channels of regions marked in white boxes.
Extended Data Fig.10. Computational prediction of AT2 cellular transition dynamics.
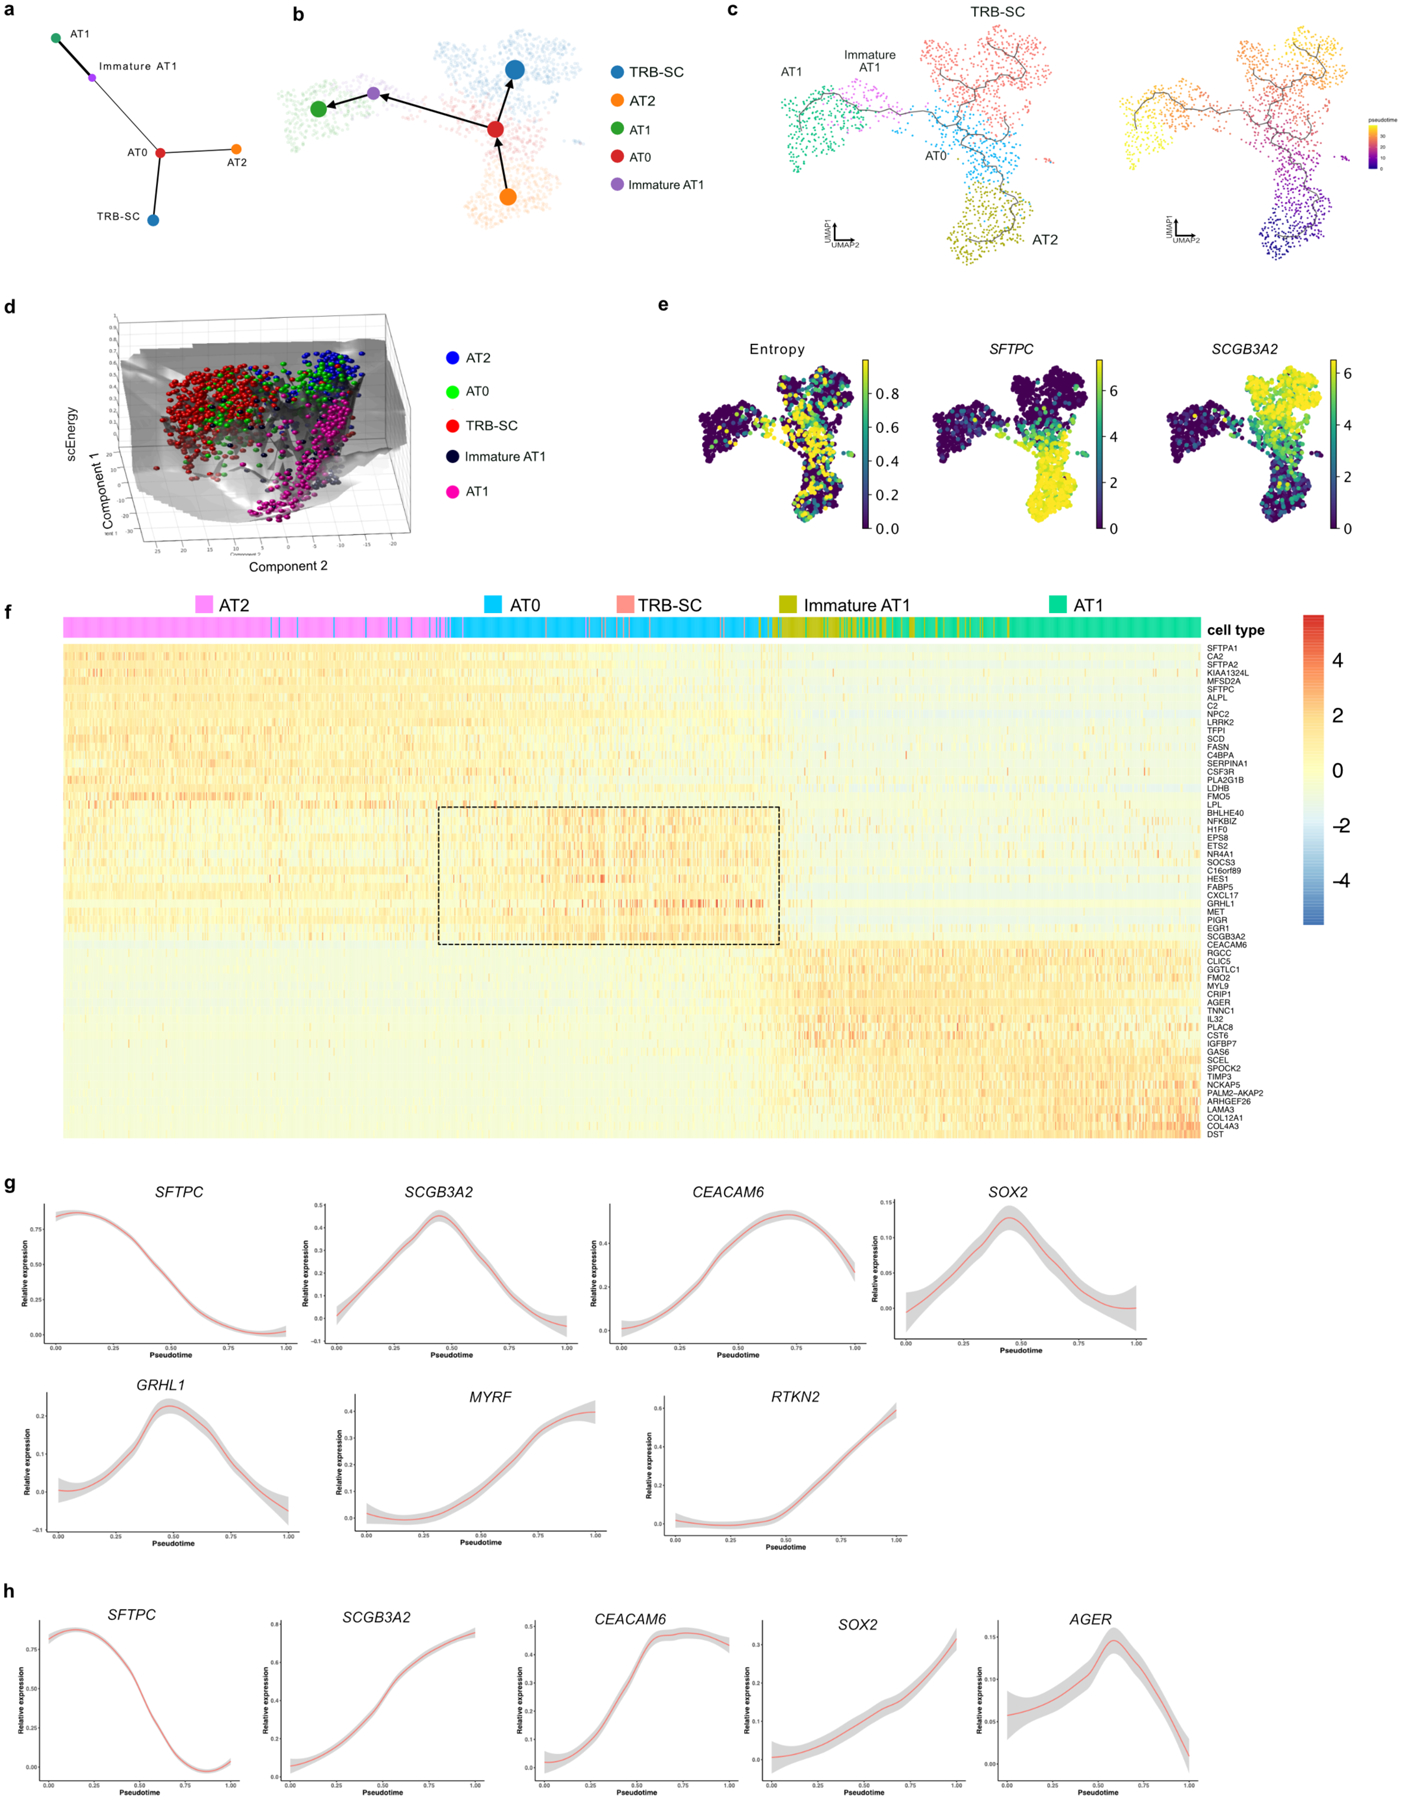
a. PAGA graph of AT0, AT1, Immature AT1, AT2 and TRB-SC cells from normal adult human lung. b. Cellular trajectory on AT0, AT1, Immature AT1, AT2 and TRB-SC cells as inferred by scVelo and PAGA algorithms. c. Cellular trajectory (left) and cells ordered along pseudotime (right) as inferred by Monocle 3 algorithm on of AT0, AT1, Immature AT1, AT2 and TRB-SC cells. d. Overall energy landscape view of AT0, AT1, Immature AT1, AT2 and TRB-SC cells as predicted by scEpath algorithm. e. MuTrans analysis of AT0, AT1, Immature AT1, AT2 and TRB-SC cells. Plots showing (from left to right) entropy, SFTPC level and SCGB3A2 level. f. Heatmap showing expression of genes along trajectory from AT2 to AT1 predicted by Slingshot algorithm. Genes enriched in AT0 cells are highlighted by the black outline. g. Line plots showing smoothened expression (Loess smoothened) of select genes along Slingshot predicted AT2 to AT1 trajectory. Gray indicates 95% confidence interval derived from the smoothened fit. h. Line plots showing smoothened expression (Loess smoothened) of select genes along Slingshot predicted AT2 to TRB-SC trajectory. Gray indicates 95% confidence interval derived from the smoothened fit.
Extended Data Fig.11. Organoid models reveal new cell trajectories in human lungs.
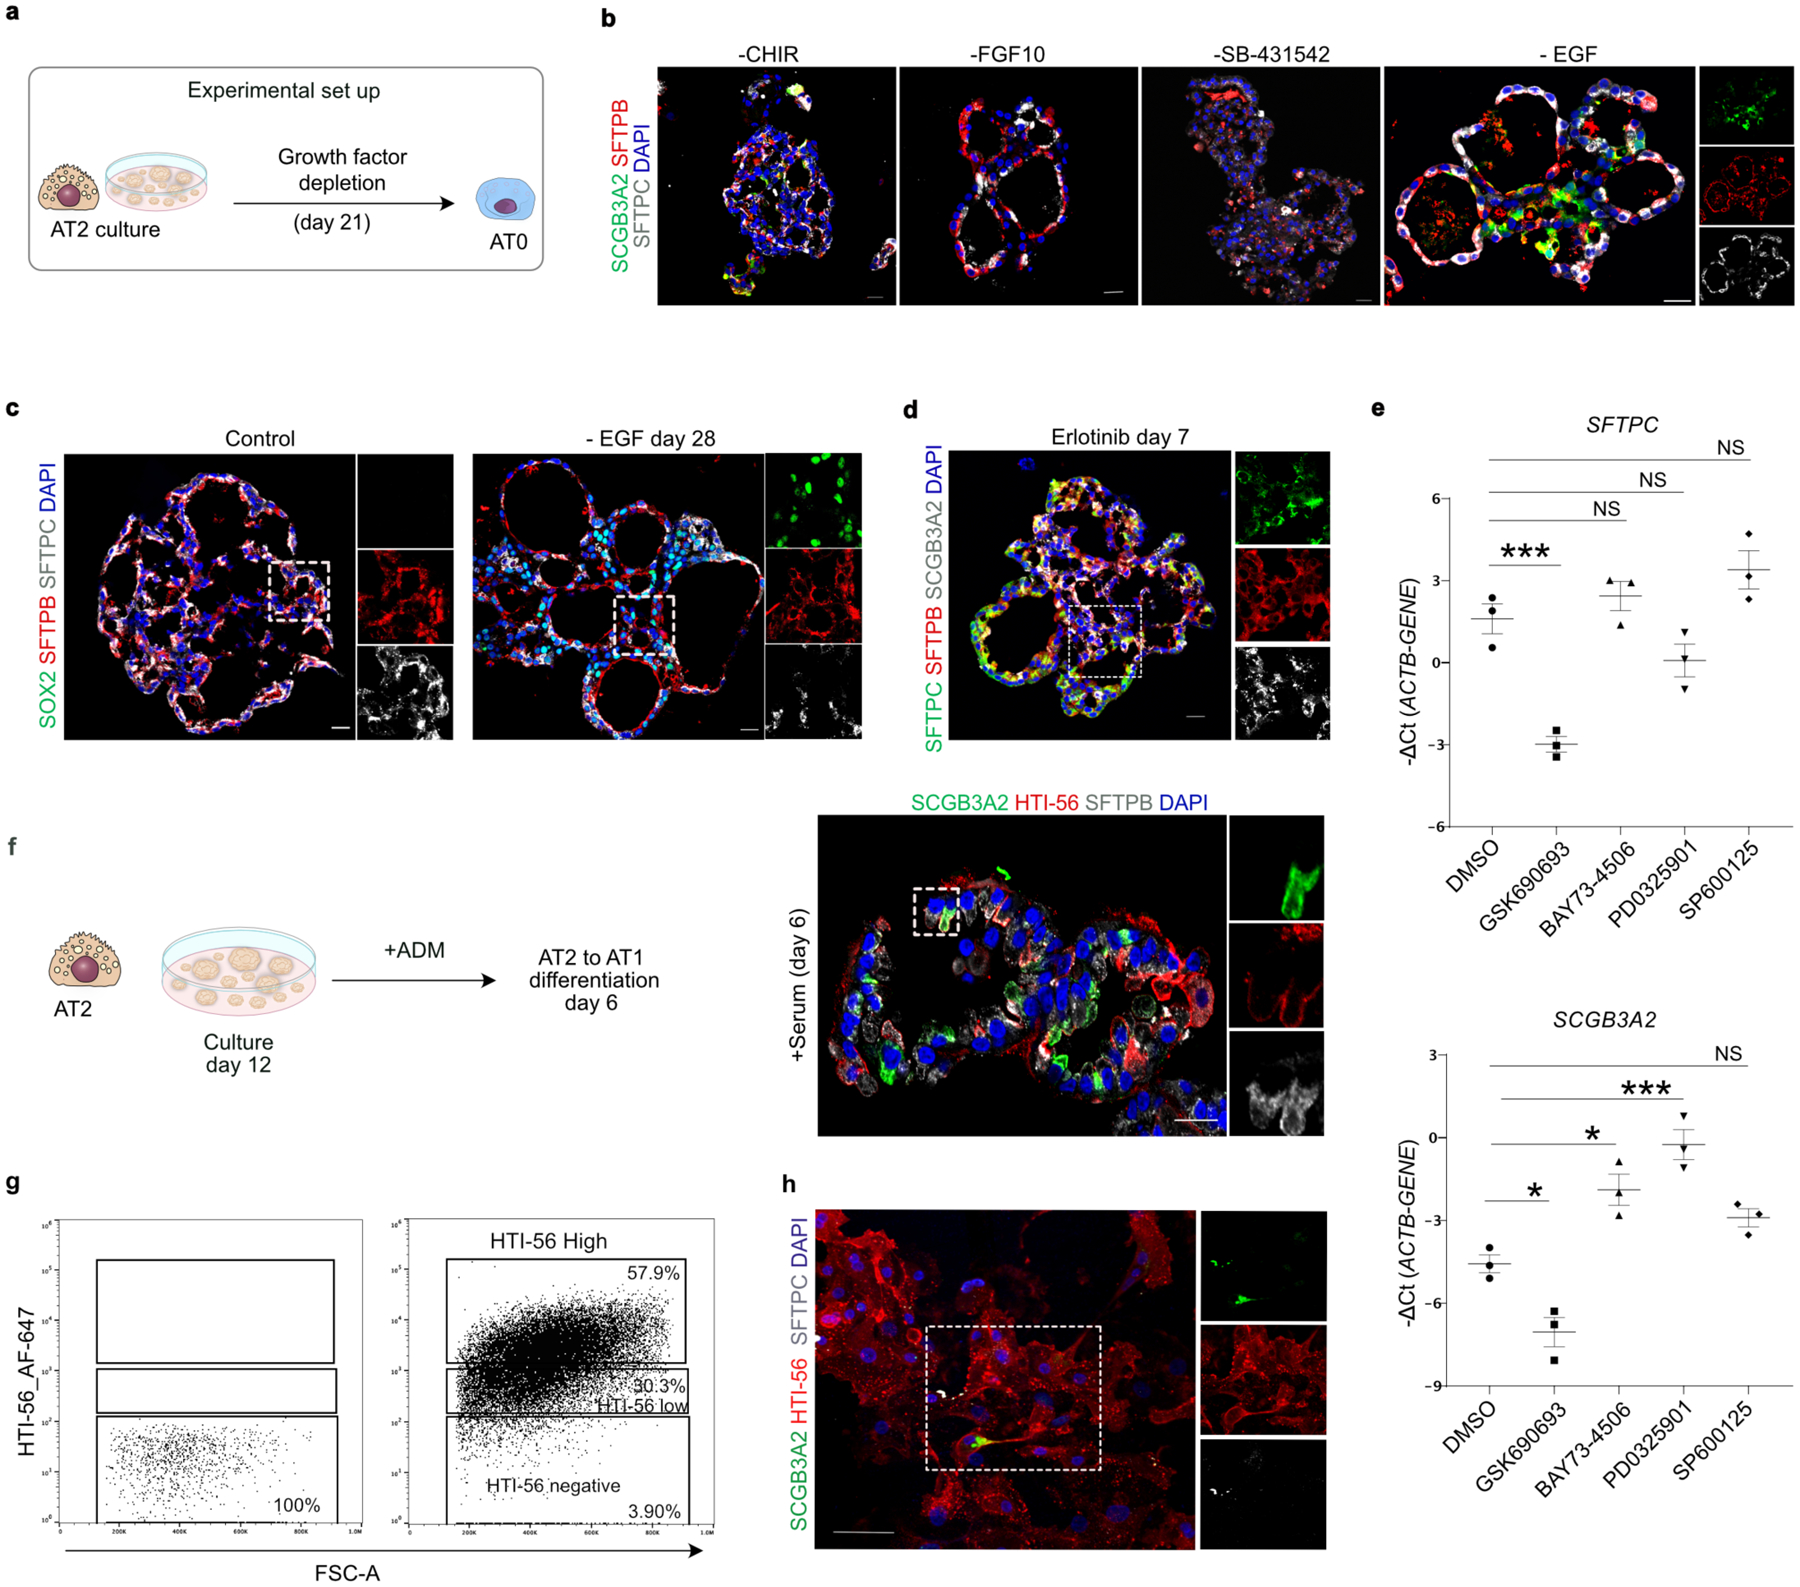
a. Schematic depicting experimental workflow for signalling modulation in organoid cultures. b. Representative immunofluorescence images show expression of SCGB3A2 (green), SFTPB (red), and SFTPC (grey) in organoids cultured in CHIR, FGF10, SB43152 and EGF depletion conditions for 21 days. Scale bar: 20 μm. c. Staining for SOX2 (green), SFTPB (red), and SFTPC (grey) in control and EGF depleted organoids. Scale bar: 20 μm. d. Staining for SFTPC (green), SFTPB (red), and SCGB3A2 (grey) expression in organoid cultures treated with Erlotinib (2 μm) at day 7. Scale bar: 20 μm. e. Relative mRNA expression of SFTPC, and SCGB3A2 in AT2 cultures treated with indicated small molecules for 7 days. Data is presented as mean ± SEM. *** (p = 0.0005 for GSK690693), NS (p = 0.6722 for BAY73–4506), NS (p = 0.2167 for PD0325901), NS (p = 0.1279 for SP600125) for SFTPC. * (p = 0.0133 for GSK690693), ** (p = 0.0081 for BAY73–4506), *** (p = 0.0003 for PD0325901), NS (p = 0.0940 for SP600125) for SCGB3A2. (Dunnett’s multiple comparisons test) (n=3). f. (left) Schematic depicting the experimental workflow to study AT2 to AT1 differentiation. (right) Immunostaining for SCGB3A2 (green) and HTI-56 (red), and SFTPB (grey) on organoids cultured in ADM for 6 days. Scale bar: 20 μm. DAPI stains nuclei (blue). g. Representative gating for FACS sorting of AT0 cells based on HTI-56 levels. h. Immunostaining for SCGB3A2 (green) and HTI-56 (red), and SFTPC (grey) on AT0 cells cultured in ADM for 7 days.
Extended Data Fig.12. scRNA-seq on human lung organoids from different treatments and AT0 sorting.
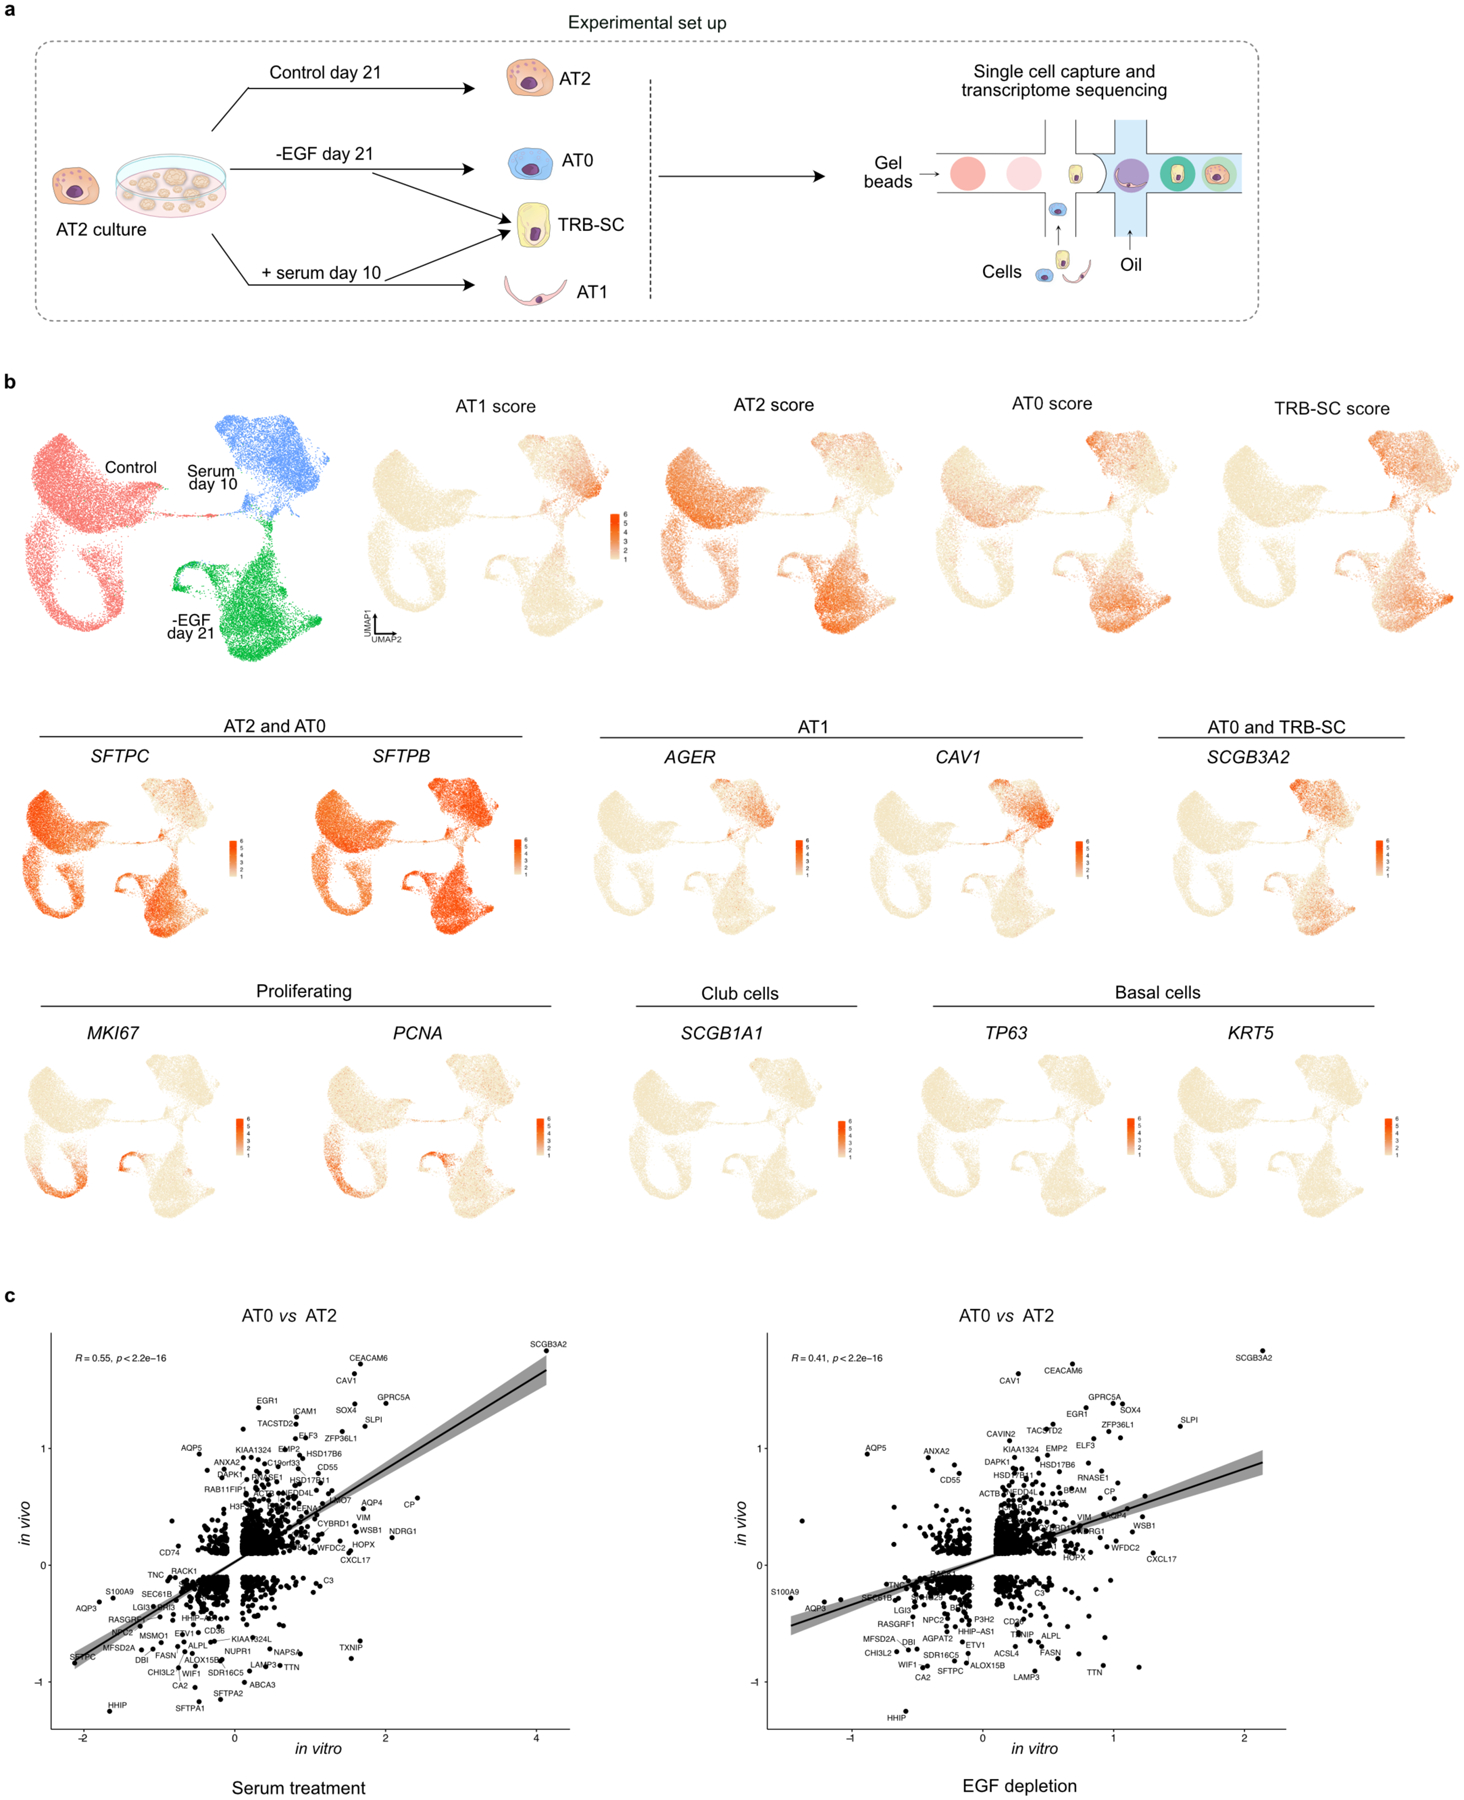
a. Schematic showing experimental workflow for organoid scRNA-seq. b. UMAPs show expression pattern of indicated genes in specific cell populations as revealed by scRNA-seq from different culture conditions. c. Scatterplot showing the relative expression of genes in AT0 cells when compared to AT2 cells in organoid cultures (EGF depletion or serum addition) or in vivo. Linear regression is shown by the black line and Pearson correlation is shown with 95% confidence interval indicated by grey colour.
Extended Data Fig. 13. TRB regions of non-human primates.
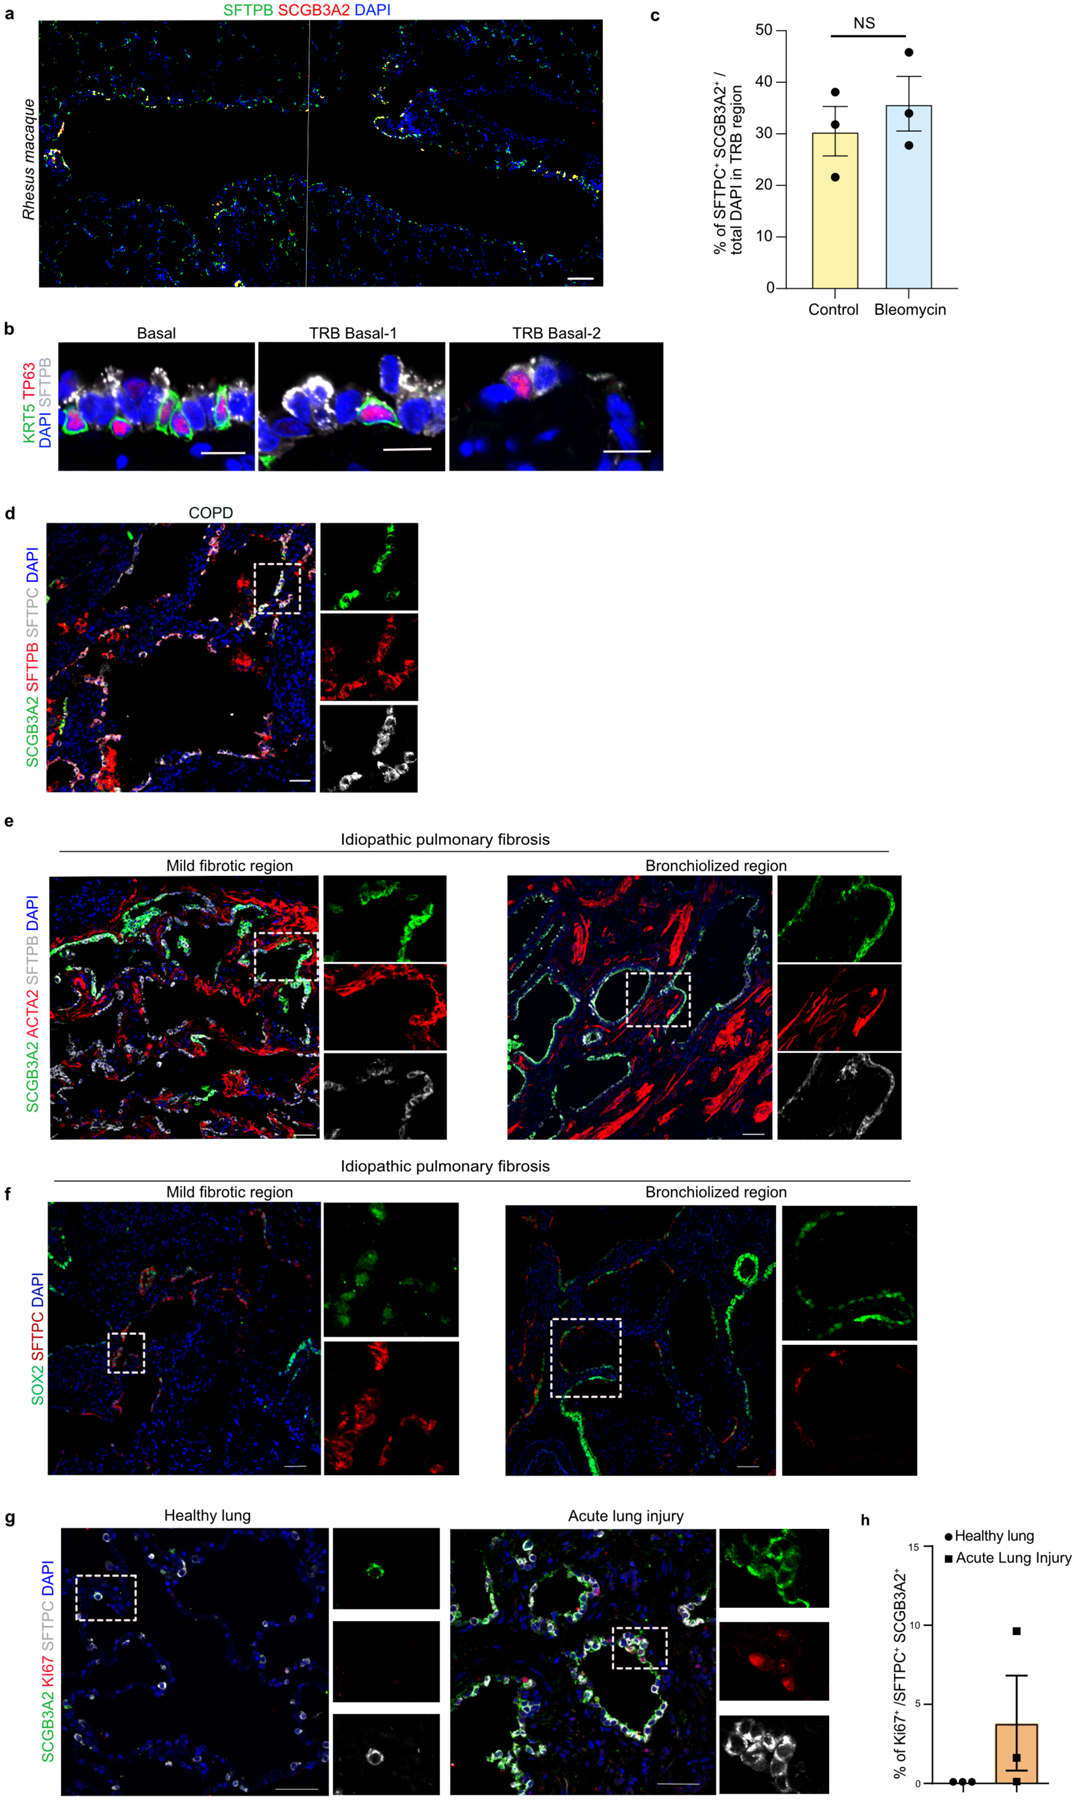
a. Immunostaining for SFTPB (green) and SCGB3A2 (red) in terminal and respiratory bronchioles of Rhesus macaque. Scale bar 100 μm. Images from adjacent regions were aligned to show large area. b. Representative immunofluorescence images from terminal and respiratory bronchioles of Rhesus macaque show the expression of KRT5 (green), TP63 (red) and SFTPB (grey). Scale bar 12.5 μm (left and right) and 15 μm (middle). c. Quantification of AT0 cells in TRB regions in control and bleomycin treated lungs. Data is presented as mean ± SEM (p = 0.496) (unpaired two-tailed t-test) (n=3). d. Immunostaining for SCGB3A2 (green), SFTPB (red), and SFTPC (grey) in COPD lung. Scale bar: 50 μm. (left). e. Staining for SCGB3A2 (green), ACTA2 (red), and SFTPC (grey) in mild fibrotic (left) and bronchiolized region (right) of the IPF lung. Scale bar: 50 μm. f. Staining for SOX2 (green) and SFTPC (red) in mild fibrotic (left) and bronchiolized region (right) of the IPF lung. Scale bar: 50 μm. Maximum intensity projection of z-stacks were shown. g. Staining for SCGB3A2 (green), KI67 (red) and SFTPC (grey) in normal human lung and in acute lung injury. Scale bar: 50 μm. h. Quantification of proliferating (Ki67+) cells in control and ALI lungs. Data is presented as mean ± SEM (n=3). In panels – d-g, insets indicate individual color channels of regions marked in white boxes.
Supplementary Material
Acknowledgements
We thank Brigid Hogan for advice and critical reading of the manuscript and Tata lab members for fruitful discussions. We thank the Human Cell Atlas community for discussions and constructive feedback. We thank members of Randell lab at UNC Chapel Hill for providing human tissues (supported by grant BOUCHER19R0 from the CF Foundation and NIH Grant DK065988). We acknowledge support from Duke University Molecular Genomics Core Facility (for help with Visium experiments); and Duke -BRPC shared resource (for providing lung tissue specimens). V.S. is supported by a fellowship from Regeneration Next initiative at Duke University. Y.K. was supported by a fellowship from Japan Society for the Promotion of Science Overseas Research. Human tissue procurement was supported by funding the CF Foundation (BOUCHER19R0) and NIH (DK065988). J.R.S. is supported by grant CZF2019002440 from the Chan Zuckerberg Initiative DAF, an advised fund of the Silicon Valley Community Foundation, and by the National Heart, Lung and Blood Institute (NHLBI; R01HL119215). We also thank Ian Glass and the University of Washington Laboratory of Developmental Biology, which is supported by NIH award 5R24HD000836 from the Eunice Kennedy Shriver National Institute of Child Health and Human Development (NICHD). This work was supported by funds from NIH/NHLBI (R01 HL127002, U01HL134766) to J.R.R; NIH (P51OD011107) to L.A.M; NIH (R01 DK04796730) to J.F.E; a Pathways to Independence award from NHLBI/NIH (R00HL127181), (R01HL146557 and R01HL153375), support from the pilot grant support from NCI/NIH - P30 Cancer Center Support Grant (P30CA014236); funds from Chan Zuckerberg Initiative - Human Lung Cell Atlas-pilot award to P.R.T. and funds from Regeneration NeXT and Kaganov- MEDx Pulmonary Initiative to P.R.T. at Duke University. This work was partially supported by funds from Whitehead foundation and P.R.T. is a Whitehead Scholar at Duke University.
Footnotes
Competing interest declaration
P.R.T. serves as a consultant for Surrozen Inc., Cellarity Inc., and Celldom Inc., on work not related to the contents of this manuscript. JRR is an employee of Genentech Inc. The other authors declare no competing interests.
Supplementary information is available online.
References
- 1.Verleden SE et al. Small airways pathology in idiopathic pulmonary fibrosis: a retrospective cohort study. Lancet Respir Med 8, 573–584 (2020). [DOI] [PMC free article] [PubMed] [Google Scholar]
- 2.Hogg JC, Macklem PT & Thurlbeck WM The resistance of small airways in normal and diseased human lungs. Aspen Emphysema Conf 10, 433–441 (1967). [PubMed] [Google Scholar]
- 3.Tanabe N et al. Micro-Computed Tomography Comparison of Preterminal Bronchioles in Centrilobular and Panlobular Emphysema. Am J Respir Crit Care Med 195, 630–638 (2017). [DOI] [PMC free article] [PubMed] [Google Scholar]
- 4.Weibel ER & Gomez DM Architecture of the human lung. Use of quantitative methods establishes fundamental relations between size and number of lung structures. Science 137, 577–585 (1962). [DOI] [PubMed] [Google Scholar]
- 5.Kobayashi Y et al. Persistence of a regeneration-associated, transitional alveolar epithelial cell state in pulmonary fibrosis. Nat Cell Biol 22, 934–946 (2020). [DOI] [PMC free article] [PubMed] [Google Scholar]
- 6.Strunz M et al. Alveolar regeneration through a Krt8+ transitional stem cell state that persists in human lung fibrosis. Nat Commun 11, 3559 (2020). [DOI] [PMC free article] [PubMed] [Google Scholar]
- 7.Choi J et al. Inflammatory Signals Induce AT2 Cell-Derived Damage-Associated Transient Progenitors that Mediate Alveolar Regeneration. Cell Stem Cell 27, 366–382.e7 (2020). [DOI] [PMC free article] [PubMed] [Google Scholar]
- 8.Regev A et al. The Human Cell Atlas. Elife 6, (2017). [DOI] [PMC free article] [PubMed] [Google Scholar]
- 9.Macosko EZ et al. Highly Parallel Genome-wide Expression Profiling of Individual Cells Using Nanoliter Droplets. Cell 161, 1202–1214 (2015). [DOI] [PMC free article] [PubMed] [Google Scholar]
- 10.Klein AM et al. Droplet barcoding for single-cell transcriptomics applied to embryonic stem cells. Cell 161, 1187–1201 (2015). [DOI] [PMC free article] [PubMed] [Google Scholar]
- 11.Travaglini KJ et al. A molecular cell atlas of the human lung from single-cell RNA sequencing. Nature 587, 619–625 (2020). [DOI] [PMC free article] [PubMed] [Google Scholar]
- 12.Habermann AC et al. Single-cell RNA sequencing reveals profibrotic roles of distinct epithelial and mesenchymal lineages in pulmonary fibrosis. Science Advances 6, eaba1972 (2020). [DOI] [PMC free article] [PubMed] [Google Scholar]
- 13.Adams TS et al. Single-cell RNA-seq reveals ectopic and aberrant lung-resident cell populations in idiopathic pulmonary fibrosis. Sci Adv 6, eaba1983 (2020). [DOI] [PMC free article] [PubMed] [Google Scholar]
- 14.Carraro G et al. Single-Cell Reconstruction of Human Basal Cell Diversity in Normal and Idiopathic Pulmonary Fibrosis Lungs. Am J Respir Crit Care Med 202, 1540–1550 (2020). [DOI] [PMC free article] [PubMed] [Google Scholar]
- 15.Okuda K et al. Secretory Cells Dominate Airway CFTR Expression and Function in Human Airway Superficial Epithelia. Am J Respir Crit Care Med (2020) doi: 10.1164/rccm.202008-3198OC. [DOI] [PMC free article] [PubMed] [Google Scholar]
- 16.Plasschaert LW et al. A single-cell atlas of the airway epithelium reveals the CFTR-rich pulmonary ionocyte. Nature 560, 377–381 (2018). [DOI] [PMC free article] [PubMed] [Google Scholar]
- 17.Montoro DT et al. A revised airway epithelial hierarchy includes CFTR-expressing ionocytes. Nature 560, 319–324 (2018). [DOI] [PMC free article] [PubMed] [Google Scholar]
- 18.Vieira Braga FA et al. A cellular census of human lungs identifies novel cell states in health and in asthma. Nat Med 25, 1153–1163 (2019). [DOI] [PubMed] [Google Scholar]
- 19.Hogg JC, Macklem PT & Thurlbeck WM Site and nature of airway obstruction in chronic obstructive lung disease. N Engl J Med 278, 1355–1360 (1968). [DOI] [PubMed] [Google Scholar]
- 20.Hogg JC et al. The nature of small-airway obstruction in chronic obstructive pulmonary disease. N Engl J Med 350, 2645–2653 (2004). [DOI] [PubMed] [Google Scholar]
- 21.Cosio M et al. The relations between structural changes in small airways and pulmonary-function tests. N Engl J Med 298, 1277–1281 (1978). [DOI] [PubMed] [Google Scholar]
- 22.Weibel ER A retrospective of lung morphometry: from 1963 to present. Am J Physiol Lung Cell Mol Physiol 305, L405–408 (2013). [DOI] [PubMed] [Google Scholar]
- 23.Deprez M et al. A Single-Cell Atlas of the Human Healthy Airways. Am J Respir Crit Care Med 202, 1636–1645 (2020). [DOI] [PubMed] [Google Scholar]
- 24.Buechler MB et al. Cross-tissue organization of the fibroblast lineage. Nature 593, 575–579 (2021). [DOI] [PubMed] [Google Scholar]
- 25.Schittny JC Development of the lung. Cell Tissue Res 367, 427–444 (2017). [DOI] [PMC free article] [PubMed] [Google Scholar]
- 26.Pan H, Deutsch GH, Wert SE, Ontology Subcommittee, & NHLBI Molecular Atlas of Lung Development Program Consortium. Comprehensive anatomic ontologies for lung development: A comparison of alveolar formation and maturation within mouse and human lung. J Biomed Semantics 10, 18 (2019). [DOI] [PMC free article] [PubMed] [Google Scholar]
- 27.Jeffrey PK The development of large and small airways. Am J Respir Crit Care Med 157, S174–180 (1998). [DOI] [PubMed] [Google Scholar]
- 28.Miller AJ et al. In Vitro and In Vivo Development of the Human Airway at Single-Cell Resolution. Developmental Cell 53, 117–128.e6 (2020). [DOI] [PMC free article] [PubMed] [Google Scholar]
- 29.La Manno G et al. RNA velocity of single cells. Nature 560, 494–498 (2018). [DOI] [PMC free article] [PubMed] [Google Scholar]
- 30.Street K et al. Slingshot: cell lineage and pseudotime inference for single-cell transcriptomics. BMC Genomics 19, (2018). [DOI] [PMC free article] [PubMed] [Google Scholar]
- 31.Bergen V, Lange M, Peidli S, Wolf FA & Theis FJ Generalizing RNA velocity to transient cell states through dynamical modeling. Nat Biotechnol 38, 1408–1414 (2020). [DOI] [PubMed] [Google Scholar]
- 32.Cao J et al. The single-cell transcriptional landscape of mammalian organogenesis. Nature 566, 496–502 (2019). [DOI] [PMC free article] [PubMed] [Google Scholar]
- 33.Wolf FA et al. PAGA: graph abstraction reconciles clustering with trajectory inference through a topology preserving map of single cells. Genome Biology 20, 59 (2019). [DOI] [PMC free article] [PubMed] [Google Scholar]
- 34.Jin S, MacLean AL, Peng T & Nie Q scEpath: energy landscape-based inference of transition probabilities and cellular trajectories from single-cell transcriptomic data. Bioinformatics 34, 2077–2086 (2018). [DOI] [PMC free article] [PubMed] [Google Scholar]
- 35.Zhou P, Wang S, Li T & Nie Q Dissecting transition cells from single-cell transcriptome data through multiscale stochastic dynamics. Nat Commun 12, 5609 (2021). [DOI] [PMC free article] [PubMed] [Google Scholar]
- 36.Katsura H et al. Human Lung Stem Cell-Based Alveolospheres Provide Insights into SARS-CoV-2-Mediated Interferon Responses and Pneumocyte Dysfunction. Cell Stem Cell 27, 890–904.e8 (2020). [DOI] [PMC free article] [PubMed] [Google Scholar]
- 37.Plantier L et al. Ectopic respiratory epithelial cell differentiation in bronchiolised distal airspaces in idiopathic pulmonary fibrosis. Thorax 66, 651–657 (2011). [DOI] [PubMed] [Google Scholar]
- 38.Weibel ER Morphometry of the Human Lung. (Springer-Verlag, 1963). doi: 10.1007/978-3-642-87553-3. [DOI] [Google Scholar]
- 39.Castleman WL, Dungworth DL & Tyler WS Intrapulmonary airway morphology in three species of monkeys: a correlated scanning and transmission electron microscopic study. Am J Anat 142, 107–121 (1975). [DOI] [PubMed] [Google Scholar]
- 40.Pinkerton KE & Joad JP The mammalian respiratory system and critical windows of exposure for children’s health. Environ Health Perspect 108 Suppl 3, 457–462 (2000). [DOI] [PMC free article] [PubMed] [Google Scholar]
- 41.Hyde DM, Samuelson DA, Blakeney WH & Kosch PC A correlative light microscopy, transmission and scanning electron microscopy study of the ferret lung. Scan Electron Microsc 891–898 (1979). [PubMed] [Google Scholar]
- 42.Miller LA, Royer CM, Pinkerton KE & Schelegle ES Nonhuman Primate Models of Respiratory Disease: Past, Present, and Future. ILAR J 58, 269–280 (2017). [DOI] [PMC free article] [PubMed] [Google Scholar]
- 43.Plopper CG, Heidsiek JG, Weir AJ, George JA & Hyde DM Tracheobronchial epithelium in the adult rhesus monkey: a quantitative histochemical and ultrastructural study. Am J Anat 184, 31–40 (1989). [DOI] [PubMed] [Google Scholar]
- 44.Ma S et al. Single-cell transcriptomic atlas of primate cardiopulmonary aging. Cell Res 31, 415–432 (2021). [DOI] [PMC free article] [PubMed] [Google Scholar]
- 45.Boucher RC Muco-Obstructive Lung Diseases. N Engl J Med 380, 1941–1953 (2019). [DOI] [PubMed] [Google Scholar]
- 46.Bhandari A & McGrath-Morrow S Long-term pulmonary outcomes of patients with bronchopulmonary dysplasia. Semin Perinatol 37, 132–137 (2013). [DOI] [PubMed] [Google Scholar]
- 47.Jiang Y et al. Alteration of cystic airway mesenchyme in congenital pulmonary airway malformation. Sci Rep 9, 5296 (2019). [DOI] [PMC free article] [PubMed] [Google Scholar]
- 48.Kim CFB et al. Identification of bronchioalveolar stem cells in normal lung and lung cancer. Cell 121, 823–835 (2005). [DOI] [PubMed] [Google Scholar]
- 49.Giangreco A, Reynolds SD & Stripp BR Terminal bronchioles harbor a unique airway stem cell population that localizes to the bronchoalveolar duct junction. Am. J. Pathol 161, 173–182 (2002). [DOI] [PMC free article] [PubMed] [Google Scholar]
- 50.Williams SE, Beronja S, Pasolli HA & Fuchs E Asymmetric cell divisions promote Notch-dependent epidermal differentiation. Nature 470, 353–358 (2011). [DOI] [PMC free article] [PubMed] [Google Scholar]
- 51.Nagendran M, Riordan DP, Harbury PB & Desai TJ Automated cell-type classification in intact tissues by single-cell molecular profiling. eLife 7, e30510 (2018). [DOI] [PMC free article] [PubMed] [Google Scholar]
- 52.Kwapiszewska G et al. Transcriptome profiling reveals the complexity of pirfenidone effects in idiopathic pulmonary fibrosis. European Respiratory Journal 52, (2018). [DOI] [PubMed] [Google Scholar]
- 53.Stuart T et al. Comprehensive Integration of Single-Cell Data. Cell 177, 1888–1902.e21 (2019). [DOI] [PMC free article] [PubMed] [Google Scholar]
- 54.Young MD & Behjati S SoupX removes ambient RNA contamination from droplet-based single-cell RNA sequencing data. Gigascience 9, (2020). [DOI] [PMC free article] [PubMed] [Google Scholar]
- 55.Hafemeister C & Satija R Normalization and variance stabilization of single-cell RNA-seq data using regularized negative binomial regression. bioRxiv 576827 (2019) doi: 10.1101/576827. [DOI] [PMC free article] [PubMed] [Google Scholar]
- 56.Chen EY et al. Enrichr: interactive and collaborative HTML5 gene list enrichment analysis tool. BMC Bioinformatics 14, 128 (2013). [DOI] [PMC free article] [PubMed] [Google Scholar]
- 57.Lambert SA et al. The Human Transcription Factors. Cell 172, 650–665 (2018). [DOI] [PubMed] [Google Scholar]
- 58.Aibar S et al. SCENIC: Single-cell regulatory network inference and clustering. Nat Methods 14, 1083–1086 (2017). [DOI] [PMC free article] [PubMed] [Google Scholar]
- 59.Jin S et al. Inference and analysis of cell-cell communication using CellChat. Nat Commun 12, 1088 (2021). [DOI] [PMC free article] [PubMed] [Google Scholar]
Associated Data
This section collects any data citations, data availability statements, or supplementary materials included in this article.
Supplementary Materials
Data Availability Statement
scRNA-seq data generated in this study are available from GEO under accession code GSE178360 (human airways) and GSE178519 (organoids). Spatial transcriptomics data generated in this are available under accession code GSE178361.
snRNA-seq data from monkey lungs44 is available at Genome Sequence Archive (GSA: CRA002577). Human lung scRNA-seq datasets from Travaglini et al11 are available on synapse (https://www.synapse.org/#!Synapse:syn21041850 ), Habermann et al12 on GEO (accession # GSE135893), Deprez et al23 on UCSC cell browser (and also European Genome-Phenome Archive # EGAD00001005714), Miller et al28 on EMBL-EBI Array Express database (accession #E-MTAB-8221).
Source data are provided with this paper.