

Abstract
Background
Previous studies have determined that necroptosis‐related genes are potential biomarkers in head and neck squamous cell carcinoma (HNSCC). Herein, we established a novel risk model based on necroptosis‐related lncRNAs (nrlncRNAs) to predict the prognosis of HNSCC patients.
Methods
Transcriptome and related information were obtained from TCGA database, and an nrlncRNA signature was established based on univariate Cox analysis and least absolute shrinkage and selection operator Cox regression. Kaplan–Meier analysis and time‐dependent receiver operating characteristic (ROC) analysis were used to evaluate the model, and a nomogram for survival prediction was established. Gene set enrichment analysis, immune analysis, drug sensitivity analysis, correlation with N6‐methylandenosin (m6A), and tumor stemness analysis were performed. Furthermore, the entire set was divided into two clusters for further discussion.
Results
A novel signature was established with six nrlncRNAs. The areas under the ROC curves (AUCs) for 1‐, 3‐, and 5‐year overall survival (OS) were 0.699, 0.686, and 0.645, respectively. Patients in low‐risk group and cluster 2 had a better prognosis, more immune cell infiltration, higher immune function activity, and higher immune scores; however, patients in high‐risk group and cluster 1 were more sensitive to chemotherapy. Moreover, the risk score had negative correlation with m6A‐related gene expression and tumor stemness.
Conclusion
According to this study, we constructed a novel signature with nrlncRNA pairs to predict the survival of HNSCC patients and guide immunotherapy and chemotherapy. This may possibly promote the development of individualized and precise treatment for HNSCC patients.
Keywords: head and neck squamous cell carcinoma, immunotherapy, long non‐coding RNA, necroptosis, prognosis
A necroptosis‐related lncRNA signature was established to predict the prognosis and immune microenvironment of head and neck squamous cell carcinoma (HNSCC). This signature model can predict the survival of HNSCC patients and guide immunotherapy and chemotherapy. This risk model may promote the development of individualized and precise treatment for HNSCC patients.

1. INTRODUCTION
Head and neck squamous cell carcinoma (HNSCC) is one of the most common tumors with sixth leading incidence and appears in multiple organs, including the oral cavity, oropharynx, hypopharynx, and larynx. 1 , 2 , 3 Smoking, alcoholism, and human papillomavirus infection increase the risk, 4 , 5 , 6 and patients with HNSCC display a propensity for high recurrence and low survival rates. 1 , 7 The estimated 5‐year survival rate of patients who systematically underwent multiple treatments, including surgery, chemotherapy, radiotherapy, immunotherapy, targeted therapy, and combination therapy, remains low, at 50%. 8 , 9 , 10 To assist in diagnosis and prediction and formulate personalized treatment plans, it is crucial to develop new biomarkers for accurately predicting the prognosis of HNSCC patients.
Necroptosis is a programmed necrotic cell death process that detects pathogens and promotes tissue repair. 11 According to compelling evidence, necroptosis‐related genes are involved in metabolizing tumor cell biological processes and the tumor microenvironment (TME) by activating RIPK1 and RIPK3 and influencing related signaling pathways. 12 , 13 , 14 Moreover, an in vivo experimental model identified necroptosis as a potential cancer promoter in HNSCC. 15
Long noncoding RNAs (lncRNAs), conservative noncoding RNAs of more than 200 nucleotides without a protein‐coding ability, play a crucial role in regulating biological processes. 16 , 17 Previous studies have determined that lncRNAs promote aerobic necroptosis and reprogramming in cancers 15 , 18 ; nevertheless, the relationship between lncRNAs and necroptosis in HNSCC remains further explorations. Therefore, we constructed a nrlncRNAs prognostic risk model to predict the prognosis of HNSCC patients and provide a guide for clinical diagnosis and treatment.
2. METHODS AND MATERIALS
2.1. Downloading head and neck squamous cell carcinoma patient gene expression and clinical data
The RNA sequencing (RNA‐seq) transcriptome data of HNSCC patients were retrieved from The Cancer Genome Atlas (TCGA)‐HNSC dataset of TCGA (https://portal.gdc.cancer.gov/), consisting of 502 HNSCC tumor samples and 44 normal samples (last accessed: 1 February 2022). Transcriptome data were downloaded as fragments per kilobase million (FPKM). HNSCC‐associated clinical information was also obtained, including age, sex, tumor grade, tumor stage, distant metastasis, lymph node metastasis, overall survival (OS) status, and survival value. Moreover, to reduce the potential statistical bias in this analysis, patients without OS values or a short OS (<30 days) were excluded. Moreover, patients of the TCGA‐HNSC set were then randomly divided into the training risk group and test risk group at a ratio of 1:1.
2.2. Expression of necroptosis genes and related lncRNAs
Eight necroptosis‐related genes were extracted by screening the necroptosis gene set M24779.gmt in the Gene Set Enrichment Analysis (GSEA) database (http://www.gsea‐msigdb.org/gsea/index.jsp), and 59 other genes were obtained in accordance with previous studies. 18 After preparing the lncRNA expression annotation information downloaded from the Ensembl website, the differentially expressed lncRNAs were distinguished from the TCGA‐HNSC dataset, and the correlation network of 67 genes and related lncRNAs was established by the use of Strawberry Perl and R software. Subsequently, necroptosis‐related lncRNAs (nrlncRNAs) were identified with the criteria of |Pearson R| > 0.4 and p < 0.001 selected by Pearson correlation analysis.
2.3. Establishment and validation of the nrlncRNA pair prognostic model
The nrlncRNAs related to survival in the TCGA‐HNSC dataset were identified by univariate Cox proportional hazards regression analysis when the p value was less than 0.05. After selecting the eligible nrlncRNAs, least absolute shrinkage and selection operator (Lasso) Cox regression analysis was performed with 10‐fold cross‐validation and a p value of 0.05 to identify the nrlncRNAs for risk models. The analysis was run for 1000 cycles to prevent overfitting, and a predictive risk model was constructed with eligible nrlncRNAs through a previous formula: Risk score = ∑ coefficient of (nrlncRNAi) * expression of (nrlncRNAi). Then, the HNSCC patients in TCGA set were divided into low‐ and high‐risk groups according to the median risk score, and the differences in OS between these two groups was compared using the log‐rank test and Kaplan–Meier (KM) survival analysis.
The survival receiver operating characteristic (ROC) curves (1‐year's, 3‐year's, and 5‐year's, respectively) and their areas under the curves (AUCs) were assessed to assess the efficacy of prediction, comparing with other clinical characteristics. A nomogram for survival prediction was investigated according to the risk score and clinical features, which were determined by both univariate and multivariate Cox regression analyses.
2.4. Gene set enrichment analysis
We performed GSEA in accordance with the assisted gene set (kegg.v7.4.symbols.gmt) via GSEA version 4.2.1 software. The respective top 5 pathways in the low‐ and high‐risk groups were selected based on the criteria of p < 0.05 and false discovery rate (FDR) < 0.25.
2.5. Exploration of immune factors and the tumor microenvironment
The immune infiltration statuses were analyzed via the tools XCELL, TIMER, QUANTISEQ, MCP‐counter, EPIC, CIBERSORT, and CIBERSORT‐ABS according to the profile of infiltration estimation for all TCGA tumors in the TCGA database and are shown as a bubble diagram. 19 Additionally, the differences in infiltrated immune cells, immune functions, and immune checkpoints between the low‐ and high‐risk groups were compared and analyzed by the Wilcoxon signed‐rank test. Moreover, the TME scores for each sample, including stromal, immune, and ESTIMATE scores, were determined by using the “estimate” package.
2.6. Association between the risk model and clinical treatment
The half‐maximal inhibitory concentration (IC50) of each HNSCC patient was used to evaluate the chemotherapy response between the low‐ and high‐risk groups by the use of the “pRRophetic” package. Four common chemotherapy drugs were analyzed and compared, including cisplatin, paclitaxel, docetaxel, and gemcitabine. The IC50 values were considered as statistical differences between the low‐ and high‐risk groups when the p value was less than 0.05 assessed by Wilcoxon signed‐rank test. 20
2.7. Correlation analysis of the risk model, N6‐methyladenosine (m6A)‐related genes and stem cell‐like features
The differences in the expression of m6A‐related genes (including eight writers, 13 readers, and two erasers) between the low‐ and high‐risk groups were compared using the Wilcoxon signed‐rank test. The results were considered as statistically significant differences while the p < 0.05. Moreover, Spearman correlation analysis was conducted to measure the relationship between the risk score and tumor stemness. 21
2.8. Clusters based on prognostic nrlncRNAs
The exploration of potential molecular subgroups responding to immunotherapy was investigated by using the “ConsensusClusterPlus” package based on prognosis‐related nrlncRNA expression. 22 Subsequently, K‐M survival analysis, principal component analysis, t‐distributed stochastic neighbor embedding, and immune analysis were conducted in clusters for further exploration.
3. RESULTS
3.1. Study design and nrlncRNAs in head and neck squamous cell carcinoma patients
The flow diagram of the study design is shown in Figure 1. After downloading the information from the TCGA database, we retrieved the expression of 67 necroptosis‐related genes and 694 nrlncRNAs (correlation coefficient > 0.4 and p < 0.001) from the gene expression matrix. There were totally 502 HNSCC and 44 normal samples in TCGA‐HNSC dataset. Subsequently, with the criteria of |log2 fold change (FC)| > 1 and p < 0.05, we finally obtained 325 differentially expressed nrlncRNAs, consisting of 299 upregulated and 26 downregulated nrlncRNAs. The network diagram of the interaction relationship between genes and lncRNAs was shown in Figure 2A. A heatmap (Figure 2B) and volcano plot (Figure 2C) were generated to visualize the differential expression of nrlncRNAs between normal and tumor samples.
FIGURE 1.

Flow diagram of study design
FIGURE 2.
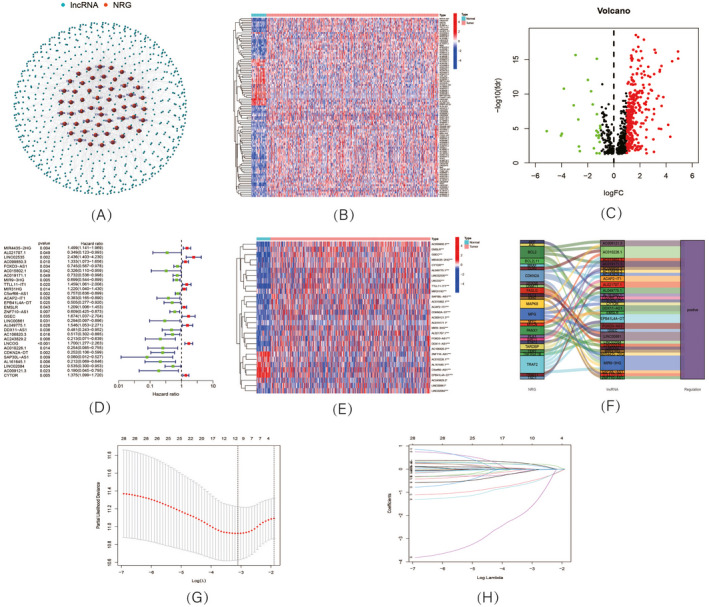
Expression of necroptosis‐related lncRNAs (nrlncRNAs) in TCGA‐HNSCC dataset and development of a nrlncRNAs prognosis signature. (A) The network of genes and nrlncRNAs; (B) Heatmap and (C) volcano diagram of differentially expressed nrlncRNAs; (D) Forest plot showing the prognostic value of 29 nrlncRNAs; (E) Heatmap of expression profiles of 29 prognostic nrlncRNAs; (F) Sankey diagram of necroptosis genes and nrlncRNAs; (G) Cross‐validation plot for the penalty term; (H) Diagram for LASSO expression coefficients
3.2. Construction and verification of the nrlncRNA risk model
A total of 29 nrlncRNAs were found to be correlated with OS according to the univariate Cox regression analysis. As shown in the univariate Cox forest map (Figure 2D) and heatmap (Figure 2E), 10 nrlncRNAs were considered poor prognostic factors for HNSCC patients (hazard ratio, HR > 1); nevertheless, the remaining nrlncRNAs decreased the risks. In addition, according to the Sankey diagram (Figure 2F), all 29 nrlncRNAs were upregulated in HNSCC patients. Subsequently, Lasso regression analysis of these 29 nrlncRNAs was conducted to establish a prognostic signature. Referring to the expression of lncRNAs and the multivariate Cox regression coefficients (Figure 2G,H), we finally selected six nrlncRNAs to develop the prognostic model. The risk scores of HNSCC patients were calculated according to the following formula: Risk score = (0.337588384400314 × MIR4435‐2HG expression) + (0.283858521856574 × AC099850.3 expression) − (1.12521676716484 × AC243829.2 expression) + (0.308541566204014 × LNCOG expression) − (1.27420875481311 × CDKN2A‐DT expression) − (3.16615220608828 × SAP30L‐AS1 expression).
According to the risk score system, the patients from the TCGA‐HNSC dataset were divided into low‐ and high‐risk groups (Figure 3A–C) and were compared in terms of survival status, time, and expression (Figure 3D–L), with the results indicating that patients in the high‐risk group display worse prognoses. Additionally, the related clinical data, including age (Figure 4A,B), gender (Figure 4C,D), grade (Figure 4E,F), and stage (Figure 4G–N), also supported the results. The AUC value of the risk model was 0.699 (Figure 4O), which was significantly more greater than that of clinical features, including age (0.555), gender (0.503), grade (0.540), and stage (0.547; Figure 4P).
FIGURE 3.

Prognosis value of the 6 nrlncRNAs model. A (train), B (test), C (entire), (K‐M) survival curves of overall survival (OS); D (train), E (test), F (entire), Exhibition of nrlncRNAs model; G (train), H (test), I (entire), Survival time and survival status; J (train), K (test), L (entire), Heatmaps of 6 nrlncRNAs expression
FIGURE 4.
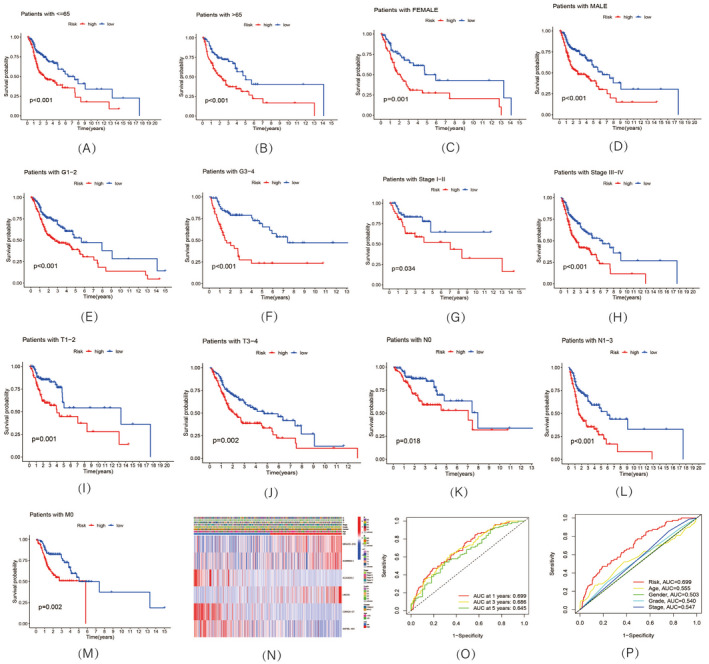
Relationship between risk model and clinical characters. (A–M, K–M) survival curves of overall survival (OS) prognostic value in the entire set; (N) Heatmap of correlation between risk model and clinical characters; (O) 1‐, 3‐, and 5‐year ROC curves of the entire sets; (P) 1‐year ROC curves of risk score, and clinical characteristics
In addition, the independence of the risk model along with several clinical features, including age, gender, grade, and stage, was assessed. According to univariate (Figure 5A) and multivariate Cox regression analyses (Figure 5B), the HR values of the risk score were 1.427 (95% CI: 1.291 to 1.579) and 1.397 (95% CI: 1.262 to 1.546), respectively. Moreover, the analysis showed that age (HRuni‐Cox = 1.019 and HRmulti‐Cox = 1.019) and stage (HRuni‐Cox = 1.416 and HRmulti‐Cox = 1.441) appeared to be two independent prognostic parameters influencing the final prognosis. According to the comprehensive landscape of the risk score and independent clinical factors, a nomogram was built for predicting HNSCC patients' 5‐year survival probability (Figure 5C). A high degree of consistency was determined between the actual observations and nomogram predictions in terms of the 1‐, 3‐, and 5‐year survival rates according the calibration plot (Figure 5D).
FIGURE 5.

Development a nomogram. (A) Uni‐Cox and (B) Multi‐Cox analyses of clinical features and risk scores. (C) Nomogram; (D) Calibration curves plot
3.3. Gene set enrichment analysis
Gene set enrichment analysis was conducted to investigate the differences between the low‐ and high‐risk groups in the entire set. As shown in Figure 6A, the top 5 Kyoto Encyclopedia of Genes and Genomes (KEGG) pathways in both groups were selected and showed high correlation with tumor invasion and immunity. Referring to the analysis of these 10 pathways, all p values were less than 0.05, FDRs were less than 0.25, and |NESs| were > 1.5.
FIGURE 6.

Exploration of tumor immune factors, chemotherapy, m6A‐related genes, and tumor stemness. (A) GSEA analysis; (B) Correlation of immune cells and risk scores; (C) Relationship between risk groups, immune cells, and immune functions; (D) Immune‐related scores in the two groups; (E) Expression of checkpoints in risk groups. (F) Drug sensitivity to four chemotherapy medicine; (G) Expression of m6A‐related genes in risk groups; (H) Correlation of risk score and tumor stemness
3.4. Correlations of the risk score with immune factors and the tumor microenvironment
There were various immune cells negatively associated with the risk score based on the analysis by various platforms (e.g., B cells, CD4+ T cells, CD8+ T cells, and macrophages in TIMER), suggesting that the low‐risk group had a higher immune infiltration status (Figure 6B). The boxplot suggested that CD8+ T cells, iDCs, Tfh cells, Th2 cells, and TILs were more enriched in the low‐risk group and that macrophages were more enriched in the high‐risk group. Concerning the single‐sample GSEA for immune cell and immune functions, the low‐risk group had more related immune functions than the high‐risk group, including checkpoint, cytolytic activity, HLA, inflammation promoting, T‐cell coinhibition, and T‐cell costimulation (Figure 6C). The low‐risk group had a higher immune score and lower stromal score than the high‐risk group; nevertheless, there were no significant differences between the two groups in the ESTIMATE score (Figure 6D). Furthermore, the immune checkpoint results also indicated that most checkpoints displayed greater activation in the low‐risk group (Figure 6E).
3.5. Correlations between the risk model and clinical treatment
Based on the pRRophetic method, the IC50 values of drugs were compared between the low‐ and high‐risk groups to predict the potential therapeutic drugs for these groups. Concerning the final results shown in Figure 6F, docetaxel and gemcitabine had lower IC50 values in the high‐risk group, indicating that patients in the high‐risk group possibly displayed a higher drug sensitivity to chemotherapy of docetaxel and gemcitabine. However, there were no differences in cisplatin or paclitaxel between the two groups.
3.6. Correlation analysis between the risk score and m6A‐related genes and tumor stemness
A Wilcoxon test was conducted to explore the relationship between the risk score and m6A‐related genes. As shown in the boxplot diagram, most m6A‐related genes had higher expression in the low‐risk group (Figure 6G). Additionally, the constructed risk signature was significantly negatively correlated with the RNA stemness score (Figure 6H).
3.7. Cluster analysis based on prognostic nrlncRNAs
The clusters of HNSCC patients were regrouped to compare the immune microenvironments and responses in different tumor subtypes. Referring to the six nrlncRNAs forming the risk model, we finally divided the patients into two clusters with the “ConsensusClusterPlus” package (Figure 7A). As the Sankey diagram shows in Figure 7B, most of the patients in the high‐risk group were regrouped into cluster 1; however, patients in cluster 2 mainly consisted of patients in the low‐risk group. Specifically, cluster 2 had a better OS (p = 0.019) than cluster 1 based on the survival analysis (Figure 7C). Concerning the results of PCA, the risk groups and clusters formed different PCs (Figure 7D), and t‐SNE verified that the two clusters could be distinguished clearly (Figure 7E). Similarly, analyses of the correlations of clusters, immune factors, and the TME were also conducted. According to the results shown in the boxplots (Figure 7F), cluster 1 presented lower immune, stromal, and ESTIMATE scores than cluster 2. Based on the analysis of immune infiltration by various platforms, the differences in infiltrating immune cells in the clusters are shown in the heatmap (Figure 7G). Moreover, immune checkpoints, such as TNFRSF18, LAG3, CD244, and TNFRSF14, displayed higher expression in cluster 2 (Figure 7H). Finally, regarding the comparison of drug sensitivity, we found that cluster 1 was more sensitive to gemcitabine; nevertheless, cluster 2 showed lower IC50 values of paclitaxel and docetaxel. There was no significant difference in the IC50 value of cisplatin between the two clusters (Figure 7I).
FIGURE 7.

Clusters analysis. (A) Patients divided into two clusters; (B) Sankey diagram. (C) K‐M survival curves of OS in clusters; (D) The PCA of risk groups and clusters; (E) The t‐SNE of risk groups and clusters; (F) Immune‐related scores in clusters; (G) Heatmap of immune cells in clusters; (H) Different expression of checkpoints in clusters. (I) Drug sensitivity to four chemotherapy medicine in clusters
4. DISCUSSION
Referring to previous studies, there is a lack of reliable prognostic biomarkers to predict the prognosis of patients with HNSCC, which is increasing worldwide with poor 5‐year survival rates. 4 , 5 , 23 Multiple studies have investigated the correlations between programmed cell death (e.g., pyroptosis)‐related genes and lncRNAs and HNSCC prognosis, assisting in determining clinical outcomes. 24 Necroptosis is reportedly involved in tumor progression and suppression and can be considered a novel therapeutic target for HNSCC patients. 15 , 25 Accordingly, there is a lack of prognostic necroptosis‐related signatures for tumors. Herein, we conducted this study to establish a novel nrlncRNA signature to predict the prognosis and immune microenvironment of HNSCC.
Compared with other clinical characteristics, the 1‐, 3‐, and 5‐year AUC values of risk score based on prognosis signature were much higher, which suggested better prognostic effects in HNSCC patients. The risk score displayed a negative correlation with the OS of HNSCC patients and was considered an independent risk indicator according to Cox regression analysis. Additionally, a higher risk score combined with older age and advanced clinical stages was considered to result in a worse prognosis, suggesting that the risk score act as a crucial role in stratifying a patient's survival status. Moreover, a nomogram was established with three independent factors (risk score, age, and stage) to predict OS, and the 1‐, 3‐, and 5‐year calibration plots demonstrated a high degree of consistency. All of the above results showed that this risk model was highly robust and effective for predicting the prognosis of HNSCC patients.
The results of our study showed that there were 29 nrlncRNAs that influenced the survival of HNSCC, and 6 of them (MIR4435‐2HG, AC099850.3, AC243829.2, LNCOG, CDKN2A‐DT, and SAP30L‐AS1) were selected to establish the prognostic signature. Among them, the expression of the lncRNA MIR4435‐2HG has been confirmed to be upregulated in HNSCC tissues based on qRT‐PCR. 26 By modulating the microRNA miR‐383‐5p and regulating RNA‐binding motif protein 3, the proliferation and invasion of HNSCC tumor cell, as well as epithelial‐mesenchymal transition and tumor growth, were suppressed with MIR4435‐2HG knockdown. 26 Similarly, Zhou et al. 27 investigated a novel risk model with SAP30L‐AS1 for predicting the prognosis of HNSCC. In addition, the lncRNA AC099850.3 was determined to display a crucial role in the biological progression of multiple tumors. It promotes tumor cell proliferation and invasion through the PRR11/PI3K/AKT axis in hepatocellular carcinoma. 28 Besides, this lncRNA is also considered a prognostic biomarker in non‐small‐cell lung cancer and colorectal cancer patients. 29 , 30 Moreover, as shown in the Sankey diagram, several lncRNA‐related genes were considered to act important roles in tumor biological processes. For instance, BCL2 was determined to be a radiotherapy outcome biomarker in HNSCC and a hot point of PD‐1 immunotherapy. 31 , 32 TRAF2, which was associated with MIR4435‐2HG and AC243829.2 in the risk model, can mediate constitutive NF‐jB activation and proliferation in HNSCC through the TNF‐TNFR1‐TRADD‐TRAF2‐RIP‐TAK1‐IKK pathway. 33
Immunotherapy represents an advanced and active treatment for HNSCC. 34 Previous studies indicated that the TME has important effects on immunotherapy. 35 , 36 According to the results of the analysis of immune factors, the high‐risk group had an immunosuppressive TME; nevertheless, the low‐risk group behaved more infiltration of immune cells such as CD8+ T cells. CD8+ T cells can kill cancer cells, disrupt immune tolerance, and enhance immunotherapy via the PD‐1/PD‐L1 immune inhibitory axis. 37 In addition, there was higher activity of LAG3 and PDCD1 in the low‐risk group, so these patients were considered to have hot tumors. 38 , 39 The more active immune function and higher immune score suggested that the low‐risk group was possibly more sensitive to immunotherapy. Similarly, after dividing the HNSCC set into the two subtypes, cluster 2, which mainly consisted of low‐risk patients, had more infiltrating immune cells (e.g., CD8+ T cells), higher immune scores, and more active immune functions, suggesting that the patients belonging to cluster 2 may have a better therapeutic response to cancer immunotherapies with greater CD8+ T‐cell infiltration. 37
Importantly, we also investigated the drug sensitivity of four common chemotherapeutic agents with the IC50 value. As the results illustrated, the high‐risk patients showed greater drug sensitivity to docetaxel and gemcitabine. Cluster 2 displayed better sensitivity to paclitaxel and docetaxel; nevertheless, cluster 1 was more sensitive to gemcitabine. These results of drug sensitivity analysis suggested that the risk model and tumor subtypes could be potential predictors to guide chemotherapy for HNSCC patients.
According to previous studies, m6A‐related genes are considered to participate in modification of noncoding RNAs in multiple biological processes. 40 , 41 Referring to our analysis, patients in the low‐risk group displayed higher expression of m6A‐related genes, indicating that this nrlncRNA signature could effectively predict the expression levels of these m6A genes. In addition, cancer stem‐like cells were determined to promote tumor growth due to their self‐renewal and invasion abilities. 41 , 42 Based on this study, the negative correlation between the risk score and stemness score suggested that higher risk scores may possibly contribute to fewer cancer stem‐like cells in HNSCC patients. It has been reported that stem‐like cells are the main determinant of chemotherapy drug resistance, 42 , 43 and the negative correlation may explain the better drug sensitivity in the high‐risk group.
There are several limitations in our study. Despite the prognostic value of the risk signature, there is a lack of lncRNA data and clinical information from other databases as external cohorts. Prospective studies with experimental assays are still needed to confirm the results of our bioinformatics analyses. The results of the investigation of the relationship between the risk signature, immunotherapy, and chemotherapy also need confirmation from large‐sample clinical trials. Nevertheless, the correlation analysis about immune cell based on different platforms might be considered as external validation in a sense. Given this, the nrlncRNA risk model can be considered reliable and acceptable. Further studies with large samples should focus on the investigation of immunotherapy and chemotherapy based on bioinformatics analyses.
5. CONCLUSION
According to this study, we constructed a novel signature with nrlncRNA pairs to predict the survival of HNSCC patients and guide immunotherapy and chemotherapy. This may possibly promote the development of individualized and precise treatment for HNSCC patients.
AUTHOR CONTRIBUTIONS
All persons designated as the authors have participated sufficiently in the work to take public responsibility for the content of the manuscript. All the authors ensure that they all gave substantial contributions.
CONFLICT OF INTEREST
None.
ACKNOWLEDGMENTS
This study was supported by the National Natural Science Foundation of China (No.81670920), Zhejiang Provincial Medical and Health Science Research Foundation (No.2020RC107, No.2020KY274, and No.2022KY1086), Ningbo Natural Science Foundation (No.2018A610363), and Ningbo Public Science Research Foundation (No.2021S170).
Huang J, Xu Z, Teh BM, et al. Construction of a necroptosis‐related lncRNA signature to predict the prognosis and immune microenvironment of head and neck squamous cell carcinoma. J Clin Lab Anal. 2022;36:e24480. doi: 10.1002/jcla.24480
Juntao Huang and Ziqian Xu contributed equally to this work.
DATA AVAILABILITY STATEMENT
The data that support the findings of this study are openly available from TCGA database belong to public database.
REFERENCES
- 1. Leemans CR, Braakhuis BJ, Brakenhoff RH. The molecular biology of head and neck cancer. Nat Rev Cancer. 2011;11:9‐22. [DOI] [PubMed] [Google Scholar]
- 2. Mourad M, Jetmore T, Jategaonkar AA, Moubayed S, Moshier E, Urken ML. Epidemiological trends of head and neck cancer in the United States: a seer population study. J Oral Maxillofac Surg. 2017;75:2562‐2572. [DOI] [PMC free article] [PubMed] [Google Scholar]
- 3. Liu Y, Yin S. A novel prognostic index based on the analysis of glycolysis‐related genes in head and neck squamous cell carcinomas. J Oncol. 2020;2020:7353874. [DOI] [PMC free article] [PubMed] [Google Scholar]
- 4. McDermott JD, Bowles DW. Epidemiology of head and neck squamous cell carcinomas: impact on staging and prevention strategies. Curr Treat Options Oncol. 2019;20:43. [DOI] [PubMed] [Google Scholar]
- 5. Gillison ML, Chaturvedi AK, Anderson WF, Fakhry C. Epidemiology of human papillomavirus‐positive head and neck squamous cell carcinoma. J Clin Oncol. 2015;33:3235‐3242. [DOI] [PMC free article] [PubMed] [Google Scholar]
- 6. Zhou J, Michaud DS, Langevin SM, McClean MD, Eliot M, Kelsey KT. Smokeless tobacco and risk of head and neck cancer: evidence from a case‐control study in New England. Int J Cancer. 2013;132:1911‐1917. [DOI] [PMC free article] [PubMed] [Google Scholar]
- 7. Zhou C, Wang S, Shen Z, et al. Construction of an m6A‐related lncRNA pair prognostic signature and prediction of the immune landscape in head and neck squamous cell carcinoma. J Clin Lab Anal. 2022;36:e24113. [DOI] [PMC free article] [PubMed] [Google Scholar]
- 8. Kaidar‐Person O, Gil Z, Billan S. Precision medicine in head and neck cancer. Drug Resist Updat. 2018;40:13‐16. [DOI] [PubMed] [Google Scholar]
- 9. Canning M, Guo G, Yu M, et al. Heterogeneity of the head and neck squamous cell carcinoma immune landscape and its impact on immunotherapy. Front Cell Dev Biol. 2019;7:52. [DOI] [PMC free article] [PubMed] [Google Scholar]
- 10. Yang JG, Wang WM, Xia HF, et al. Lymphotoxin‐α promotes tumor angiogenesis in HNSCC by modulating glycolysis in a PFKFB3‐dependent manner. Int J Cancer. 2019;145:1358‐1370. [DOI] [PubMed] [Google Scholar]
- 11. Yan J, Wan P, Choksi S, et al. Necroptosis and tumor progression. Trends Cancer. 2022;8:21‐27. [DOI] [PMC free article] [PubMed] [Google Scholar]
- 12. Snyder AG, Hubbard NW, Messmer MN, et al. Intratumoral activation of the necroptotic pathway components RIPK1 and RIPK3 potentiates antitumor immunity. Sci Immunol. 2019;4:eaaw2004. [DOI] [PMC free article] [PubMed] [Google Scholar]
- 13. Yang Z, Jiang B, Wang Y, et al. 2‐HG inhibits necroptosis by stimulating dnmt1‐dependent hypermethylation of the RIP3 promoter. Cell Rep. 2017;19:1846‐1857. [DOI] [PubMed] [Google Scholar]
- 14. Yatim N, Jusforgues‐Saklani H, Orozco S, et al. RIPK1 and NF‐κB signaling in dying cells determines cross‐priming of CD8+ T cells. Science. 2015;350:328‐334. [DOI] [PMC free article] [PubMed] [Google Scholar]
- 15. Li J, Huang S, Zeng L, et al. Necroptosis in head and neck squamous cell carcinoma: characterization of clinicopathological relevance and in vitro cell model. Cell Death Dis. 2020;11:391. [DOI] [PMC free article] [PubMed] [Google Scholar]
- 16. Gil N, Ulitsky I. Regulation of gene expression by cis‐acting long non‐coding RNAs. Nat Rev Genet. 2020;21:102‐117. [DOI] [PubMed] [Google Scholar]
- 17. Kopp F, Mendell JT. Functional classification and experimental dissection of long noncoding RNAs. Cell. 2018;172:393‐407. [DOI] [PMC free article] [PubMed] [Google Scholar]
- 18. Zhao Z, Liu H, Zhou X, et al. Necroptosis‐related lncRNAs: predicting prognosis and the distinction between the cold and hot tumors in gastric cancer. J Oncol. 2021;2021:6718443. [DOI] [PMC free article] [PubMed] [Google Scholar]
- 19. Hong W, Liang L, Gu Y, et al. Immune‐related lncRNA to construct novel signature and predict the immune landscape of human hepatocellular carcinoma. Mol Ther Nucleic Acids. 2020;22:937‐947. [DOI] [PMC free article] [PubMed] [Google Scholar]
- 20. Geeleher P, Cox NJ, Huang RS. Clinical drug response can be predicted using baseline gene expression levels and in vitro drug sensitivity in cell lines. Genome Biol. 2014;15:R47. [DOI] [PMC free article] [PubMed] [Google Scholar]
- 21. Wu L, Liu G, He YW, Chen R, Wu ZY. Identification of a pyroptosis‐associated long non‐coding RNA signature for predicting the immune status and prognosis in skin cutaneous melanoma. Eur Rev Med Pharmacol Sci. 2021;25:5597‐5609. [DOI] [PubMed] [Google Scholar]
- 22. Wilkerson MD, Hayes DN. ConsensusClusterPlus: a class discovery tool with confidence assessments and item tracking. Bioinformatics. 2010;26:1572‐1573. [DOI] [PMC free article] [PubMed] [Google Scholar]
- 23. Ebrahimi A, Luk PP, Low H, et al. A critical analysis of the 8th edition TNM staging for head and neck cutaneous squamous cell carcinoma with lymph node metastases and comparison to N1S3 stage and ITEM risk score: a multicenter study. J Surg Oncol. 2021;123:1531‐1539. [DOI] [PubMed] [Google Scholar]
- 24. Deng H, Wei Z, Qiu S, et al. Pyroptosis patterns and immune infiltrates characterization in head and neck squamous cell carcinoma. J Clin Lab Anal. 2022;e24292. [DOI] [PMC free article] [PubMed] [Google Scholar]
- 25. Park KR, Lee H, Kim SH, Yun HM. Paeoniflorigenone regulates apoptosis, autophagy, and necroptosis to induce anti‐cancer bioactivities in human head and neck squamous cell carcinomas. J Ethnopharmacol. 2022;288:115000. [DOI] [PubMed] [Google Scholar]
- 26. Wang S, Chen X, Qiao T. Long non‐coding RNA MIR4435‐2HG promotes the progression of head and neck squamous cell carcinoma by regulating the miR‐383‐5p/RBM3 axis. Oncol Rep. 2021;45:99. [DOI] [PMC free article] [PubMed] [Google Scholar]
- 27. Zhou LQ, Shen JX, Zhou JY, Hu Y, Xiao HJ. The prognostic value of m6A‐related LncRNAs in patients with HNSCC: bioinformatics analysis of TCGA database. Sci Rep. 2022;12:579. [DOI] [PMC free article] [PubMed] [Google Scholar]
- 28. Zhong F, Liu S, Hu D, Chen L. LncRNA AC099850.3 promotes hepatocellular carcinoma proliferation and invasion through PRR11/PI3K/AKT axis and is associated with patients prognosis. J Cancer. 2022;13:1048‐1060. [DOI] [PMC free article] [PubMed] [Google Scholar]
- 29. Zhou J, Zhang M, Dong H, et al. Comprehensive analysis of acetylation‐related lncRNAs and identified AC099850.3 as prognostic biomarker in non‐small cell lung cancer. J Oncol. 2021;2021:4405697. [DOI] [PMC free article] [PubMed] [Google Scholar]
- 30. Zhang W, Fang D, Li S, Bao X, Jiang L, Sun X. Construction and validation of a novel ferroptosis‐related lncRNA signature to predict prognosis in colorectal cancer patients. Front Genet. 2021;12:709329. [DOI] [PMC free article] [PubMed] [Google Scholar]
- 31. Agostini LP, Stur E, Garcia FM, et al. ATM, BCL2, and TGFβ gene polymorphisms as radiotherapy outcome biomarkers in head and neck squamous cell carcinoma patients. Genet Test Mol Biomarkers. 2017;21:727‐735. [DOI] [PubMed] [Google Scholar]
- 32. Haikala HM, Anttila JM, Marques E, et al. Pharmacological reactivation of MYC‐dependent apoptosis induces susceptibility to anti‐PD‐1 immunotherapy. Nat Commun. 2019;10:620. [DOI] [PMC free article] [PubMed] [Google Scholar]
- 33. Jackson‐Bernitsas DG, Ichikawa H, Takada Y, et al. Evidence that TNF‐TNFR1‐TRADD‐TRAF2‐RIP‐TAK1‐IKK pathway mediates constitutive NF‐kappaB activation and proliferation in human head and neck squamous cell carcinoma. Oncogene. 2007;26:1385‐1397. [DOI] [PubMed] [Google Scholar]
- 34. Outh‐Gauer S, Alt M, Le Tourneau C, et al. Immunotherapy in head and neck cancers: a new challenge for immunologists, pathologists and clinicians. Cancer Treat Rev. 2018;65:54‐64. [DOI] [PubMed] [Google Scholar]
- 35. Frankel T, Lanfranca MP, Zou W. The role of tumor microenvironment in cancer immunotherapy. Adv Exp Med Biol. 2017;1036:51‐64. [DOI] [PubMed] [Google Scholar]
- 36. Pitt JM, Marabelle A, Eggermont A, Soria JC, Kroemer G, Zitvogel L. Targeting the tumor microenvironment: removing obstruction to anticancer immune responses and immunotherapy. Ann Oncol. 2016;27:1482‐1492. [DOI] [PubMed] [Google Scholar]
- 37. Duan Q, Zhang H, Zheng J, Zhang L. Turning cold into hot: firing up the tumor microenvironment. Trends Cancer. 2020;6:605‐618. [DOI] [PubMed] [Google Scholar]
- 38. Zheng Y, Tian H, Zhou Z, et al. A novel immune‐related prognostic model for response to immunotherapy and survival in patients with lung adenocarcinoma. Front Cell Dev Biol. 2021;9:651406. [DOI] [PMC free article] [PubMed] [Google Scholar]
- 39. Yan L, Song X, Yang G, Zou L, Zhu Y, Wang X. Identification and validation of immune infiltration phenotypes in laryngeal squamous cell carcinoma by integrative multi‐omics analysis. Front Immunol. 2022;13:843467. [DOI] [PMC free article] [PubMed] [Google Scholar]
- 40. Coker H, Wei G, Brockdorff N. m6A modification of non‐coding RNA and the control of mammalian gene expression. Biochim Biophys Acta Gene Regul Mech. 2019;1862:310‐318. [DOI] [PubMed] [Google Scholar]
- 41. Ma Z, Ji J. N6‐methyladenosine (m6A) RNA modification in cancer stem cells. Stem Cells. 2020;38(12):1511‐1519. [DOI] [PubMed] [Google Scholar]
- 42. Huang Z, Cheng L, Guryanova OA, Wu Q, Bao S. Cancer stem cells in glioblastoma–molecular signaling and therapeutic targeting. Protein Cell. 2010;1:638‐655. [DOI] [PMC free article] [PubMed] [Google Scholar]
- 43. Schonberg DL, Lubelski D, Miller TE, Rich JN. Brain tumor stem cells: Molecular characteristics and their impact on therapy. Mol Aspects Med. 2014;39:82‐101. [DOI] [PMC free article] [PubMed] [Google Scholar]
Associated Data
This section collects any data citations, data availability statements, or supplementary materials included in this article.
Data Availability Statement
The data that support the findings of this study are openly available from TCGA database belong to public database.