Abstract
Background
Gastric cancer (GC) is one of the most common cancers worldwide with a poor prognosis. The tumor microenvironment (TME) serves a pivotal role in affecting the prognosis and efficacy of immunotherapy. Given the poor prognosis of GC patients and the limitation of immunotherapy, we urged to identify new prognostic and immunotherapeutic biomarkers.
Methods
The transcriptome data were downloaded from the TCGA, GEO, and GEPIA databases, and performed differential analysis of AFF3 in tumor samples and normal samples. The UALCAN, Kaplan–Meier plotter and GEPIA databases were employed to assess the correlation of AFF3 with clinicopathological characteristics and prognosis. The potential mechanism of AFF3 was explored by the GO and KEGG enrichment. The potential role of AFF3 on tumor‐infiltrating immune cells (TIICs) was explored by TIMER2.0 and TISIDB. TIMER2.0 and SangerBox3.0 databases were, respectively, used to determine the correlation of AFF3 with immune checkpoint (ICs), tumor mutational burden (TMB), and microsatellite instability (MSI) in GC.
Results
We found significant downregulation of AFF3 in GC tissues as compared with normal tissues. However, GC patients having a higher expression of AFF3 were found to have worse clinicopathological characteristics and prognosis. Moreover, the GO enrichment analysis illustrated that AFF3 might regulate the immune cells in the TME. In addition, the AFF3 was positively correlated with TIICs, ICs, TMB, and MSI.
Conclusion
Here, we conclude that AFF3 may be a promising potential marker for the diagnosis and prognosis of GC patients, and may influence response to ICIs by affecting TIICs and ICs expression in the TME.
Keywords: AFF3, bioinformatic analysis, gastric cancer, immunotherapy, prognosis
AFF3 may be a promising potential marker for the diagnosis and prognosis of GC patients, and may influence response to ICIs by affecting TIICs and ICs expression in the TME.

1. INTRODUCTION
Gastric cancer (GC) is become a global health challenge due to its high prevalence and poor survival. It has been ranked 5th among 36 top cancers, more than 1.08 million new cases were diagnosed worldwide only in 2020. 1 The first diagnosis at an advanced stage is the top reason for GC’s poor prognosis and overall survival; the patients at advanced stage GC usually do not respond to chemotherapy and palliative treatments. 2 Histological and pathological stages are being used for determining prognosis. Nevertheless, the prognosis of patients having similar histopathological stages is still completely different, probably due to the highly heterogeneous nature of the tumors and different clinical history. 3 Recently, immunotherapy is considered a reliable option for advanced GC patients. 4 However, only a few patients achieved sustainable results from immunotherapy, probably due to the complexity of the immune response. 5 Therefore, it is necessary to develop the potential biomarkers which precisely predict the prognosis of patients, and serve as a target of immunotherapy.
AFF3 (AF4/FMR2 family member 3, or LAF4) encodes tissue‐restricted nuclear transcriptional activator and is possibly involves lymphoid cell development, 6 multiple autoimmune diseases such as psoriatic arthritis cohort, 7 rheumatoid arthritis, and type 1 diabetes. 8 Recently, AFF3 has been identified as an important player in the onset and development of cancers including breast cancer, 9 non‐small cell lung cancer, 10 adrenocortical carcinoma, 11 and glioblastoma. 12 In addition, the downregulation of AFF3 induces apoptosis and affects the proliferation of cancer cells. 10 , 11 However, the expression and underlying roles of AFF3 in GC, specifically the regulation of immune function, remain unexplored.
Here, we first assessed the expression of AFF3 in gastric cancer and its relationship with prognosis. Furthermore, we used multiple databases to evaluate the correlation of AFF3 in immune cell infiltration and immune checkpoints in the GC tumor microenvironment (TME), providing a possible therapeutic target for immunotherapy of gastric cancer.
2. MATERIALS AND METHODS
2.1. AFF3 gene expression
The mRNA levels of AFF3 in pan‐cancer were identified from the TIMER2.0 database (http://timer.cistrome.org/) and Sangerbox3.0 (http://vip.sangerbox.com/login.html). TIMER2.0 contains 10,897 tumor samples derived from 32 cancer types. 13 The diffexp module of TIMER2.0 was used to show the expression of AFF3 in different cancers by box plots. The Sangerbox3.0 database includes the unified standardized pan‐cancer from the Cancer Genome Atlas (TCGA) and Genotype‐Tissue Expression databases (GTEx) dataset. We used unpaired Wilcoxon rank sum and signed rank tests to analyze the significant differences in AFF3 in the pan‐cancer. 14 The “Bioconductor” package in R software (version 4.1.2) was applied to acquire transcriptome sequencing and clinical information of GC from TCGA. We employed the “limma” package in R to analyze the relative expression of AFF3 across GC tumor and normal samples. Gene expression profiling interactive analysis (GEPIA), and complete RNA‐Seq data of 9736 tumors and 8587 normal samples based on TCGA and GTEx, 15 were used to further elucidate the expression of AFF3 in GC. The Gene Expression Omnibus (GEO) (http://www.ncbi.nlm.nih.gov/geo/) collects a mass of high‐throughput gene expression data by microarray technology, 16 which was applied to compare the different expressions of AFF3 between normal and tumor tissues of GC. Moreover, the level of AFF3 protein in GC was observed by immunohistochemistry (IHC) images from The Human Protein Atlas (THPA) (https://www.proteinatlas.org/).
2.2. Clinicopathological Characteristics Analysis and Survival Analysis
The correlation between AFF3 expression and clinicopathological characteristics was explored using UALCAN (http://ualcan.path.uab.edu/), a web portal to analyze the relative expression of the desired gene(s) in tumor and normal samples, and association with clinicopathological characteristics of the patients such as cancer stage, tumor grade, race, and weight. 17 We collected survival information of 1440 gastric cancer patients from GEO, EGA, and TCGA databases and used them to examine the effect of AFF3 on the prognosis of GC using Kaplan–Meier curve 18 and GEPIA databases. The examination probe ID used for AFF3 was 227198_at. The log‐rank P‐value and hazard ratio (HR) with 95% confidence intervals (CI) were analyzed.
2.3. Functional enrichment analysis of differential expression genes (DEGs)
“Limma” package of R generated a list of differential genes in the low expression and high expression AFF3 groups. The adjusted p value<0.05 and |log2(Fold Change) |>1 were set as the thresholds to determine DEGs. Additionally, the R packages “clusterProfiler”, “org. Hs.eg.db”, “enrichplot”, and “ggplot2” were applied to Gene Ontology (GO) and Kyoto Encyclopedia of Gene Genomes (KEGG) pathway enrichment analysis of DEGs.
2.4. Association of AFF3 with immune cell tumor infiltration and immune checkpoints
The ESTIMATE score was carried out to calculate the stromal score, immune score, and estimate score, which could evaluate the presence of stromal cells and the infiltration of immune cells. 19 Accordingly, we firstly analyzed the correlations of AFF3 expression with the stromal/immune/ estimate score.
In addition, to further assess the effect of AFF3 on immune infiltration, the association between AFF3 expression and tumor‐infiltrating immune cells (TIICs) was predicted by the CIBERSORT algorithm, TISIDB database, and TIMER 2.0 database. CIBERSORT is an algorithm that can accurately characterize the relative scores of different cell subsets in tissue by analyzing the gene expression profile of the tissue. LM22 is a gene signature matrix with 547 leukocyte genes that can distinguish 22 human hematopoietic cell phenotypes. Combining the statistical filtering, CIBERSORT and LM22 can distinguish human leukocyte subsets with high sensitivity and specificity. 20 Through quality filtering, tumor samples with p < 0.05 were selected for further analysis in the TCGA cohort. We inferred the relative fraction of 21 kinds of TIICs in each GC sample. Then, based on the expression of AFF3, the GC patients were divided into high and low cohorts, and we compared the difference in TIICs between both groups.
TIMER2.0 employs pathological examination‐validated statistical methodology to determine the abundance of TIICs. 21 Therefore, we used it to study the association between AFF3 expression and the abundance of 12 TIICs (regulatory T cell, CD4+ T cells, CD8+ T cells, B cell naïve, B cell memory, B cell plasma, monocyte, myeloid dendritic, eosinophil, neutrophils, macrophages, and mast cell) in GC. TISIDB, which pre‐calculates the association between any gene and immune characteristics through literature mining and high‐throughput data analysis, 22 was carried out to comprehensively assess the relevance of AFF3 to the abundance of 28 TIICs in GC.
The relevance between AFF3 expression and immune checkpoint (ICs) genes was predicted by TIMER2.0. We selected 30 common ICs reported in the literature to explore their correlation with the AFF3 expression. 23 , 24 The SangerBox3.0 was used to evaluate the correlations between AFF3 expression and tumor mutational burden (TMB) and microsatellite instability (MSI).
2.5. Statistical analysis
Statistical analyses were conducted through R software (version 4.1.2). Wilcox test was employed to evaluate AFF3 expression in multiple tissues. Kaplan–Meier curves reflected whether the expression of AFF3 affected the survival of GC patients. The Spearman analysis was conducted to calculate correlation coefficients. p < 0.05 was considered significant.
3. RESULTS
3.1. Expression levels of AFF3
The expression of AFF3 at mRNA level in various cancers was calculated by using TIMER2.0 and Sangerbox3.0 which revealed that the AFF3 has low expression in bladder urothelial carcinoma (BLAC), cervical squamous cell carcinoma and endocervical adenocarcinoma (CESC), colon adenocarcinoma (COAD), glioblastoma multiforme (GBM), kidney chromophobe (KICH), lung adenocarcinoma (LUAD), lung squamous cell carcinoma (LUSC), rectum adenocarcinoma (READ), stomach adenocarcinoma (STAD), thyroid carcinoma (THCA), and uterine corpus endometrial carcinoma (UCEC) relative to normal tissue controls (Figure 1A). We observed a significant downregulation of AFF3 in 19 human cancers such as GBM, UCEC, CESC, LUAD, esophageal carcinoma (ESCA), stomach and esophageal carcinoma (STES), COAD, colon adenocarcinoma/rectum adenocarcinoma esophageal carcinoma (COADREAD), STAD, head and neck squamous cell carcinoma (HNSC), LUSC, BLCA, THCA, READ, ovarian serous cystadenocarcinoma (OV), testicular germ cell tumors (TGCT), uterine carcinosarcoma (UCS), adrenocortical carcinoma (ACC), and KICH from Sangerbox3.0 (Figure 1B).
FIGURE 1.
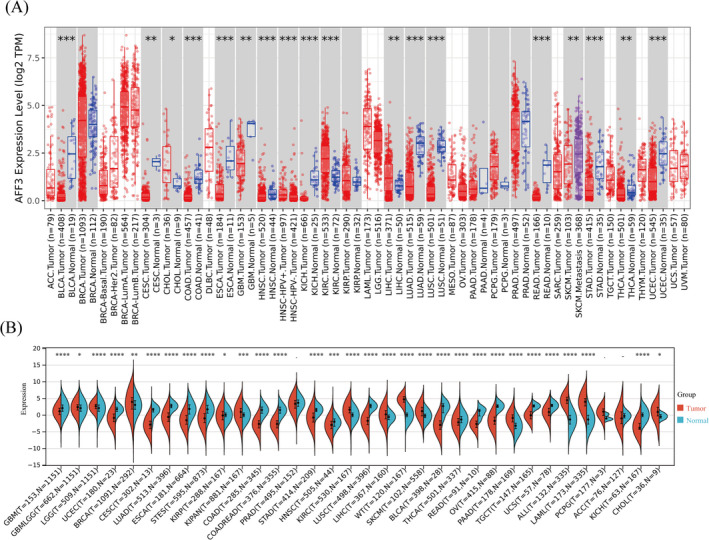
The expression of AFF3 in diverse human cancers. The expression levels of AFF3 in pan‐cancers were performed by TIMER2.0 (A) and Sangerbox3.0 database (B). *p < 0.05, **p < 0.01, ***p < 0.001
By using the TIMER2.0 database and Sangerbox3.0, we found a significantly low expression of AFF3 in GC compared with normal tissues. To further validate AFF3 expression in GC, we analyzed RNA‐seq data of 375 GC tumor tissues and 32 normal tissues from TCGA which also detected low expression of AFF3 in GC (Figure 2A). Consistent with it, AFF3 was also found downregulated in GC tumors’ data obtained from GSE27342 and GSE66229 cohorts (Figure 2B,C), GEPIA (Figure 2D), and THPA (Figure 2E,F). The above results illustrated that the expression of AFF3 is an important regulator of various cancers including GC.
FIGURE 2.
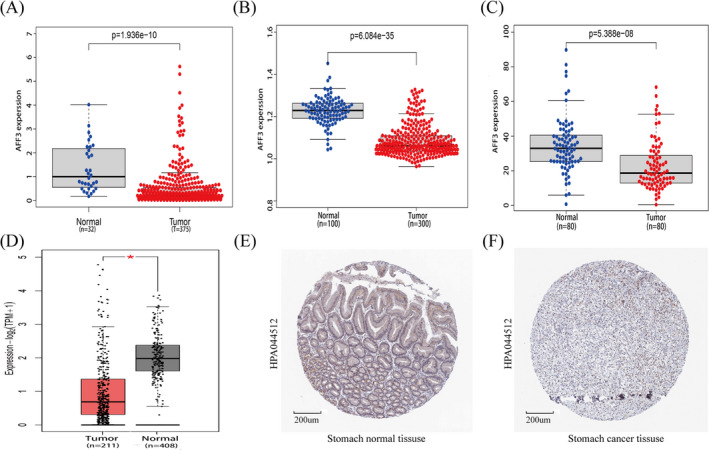
The expression of AFF3 was downregulated in GC. The level of AFF3 mRNA was decreased in GC tissues compared to corresponded normal tissues from (A)TCGA, (B)GSE66229, (C)GSE27342, and (D) GEPIA (*p < 0.05). The protein level of AFF3 in normal tissues (E) and stomach cancer tissues (F)
3.2. AFF3 expression is related to clinical parameters in GC
To shed light on the role of AFF3 in GC, the association between AFF3 expression and clinical parameters was explored by the UALCAN database. GC patients were divided into several subgroups based on age, grade, H. pylori infection, nodal metastasis status, TP53 mutations, and tumor stage. In three age groups, 40–61, 61–80, and 81–100 years, the AFF3 differentially downregulated in every two groups was statistically significant and the 81–100 years group has the lowest expression of AFF3 (Figure 3A). There was a statistically significant difference in the expression of AFF3 between the Grade 3 and Grade 1 groups. Similarly, this difference is also observed between Grade 3 and Grade 2 groups showing that Grade 3 has a greatly elevated level of FF3 (Figure 3B). Although the expression level of AFF3 did not show a significant difference with the presence of H. pylori infection, the uninfected group has a higher expression of AFF3 (Figure 3C). Similarly, the level of AFF3 showed a significant correlation with lymph node metastasis, patients in N3 have a higher level of FF3 (Figure 3D). In comparison with the TP53 mutation group, the level of AFF3 expression was increased in the TP53 non‐mutant group (Figure 3E). Regarding the tumor stage, AFF3 mRNA expression in the stage I group was significantly lower as compared with the stage II group or the stage III group (Figure 3F). These results showed that the higher expression of AFF3 might be related to poor clinical features and clinical outcomes.
FIGURE 3.
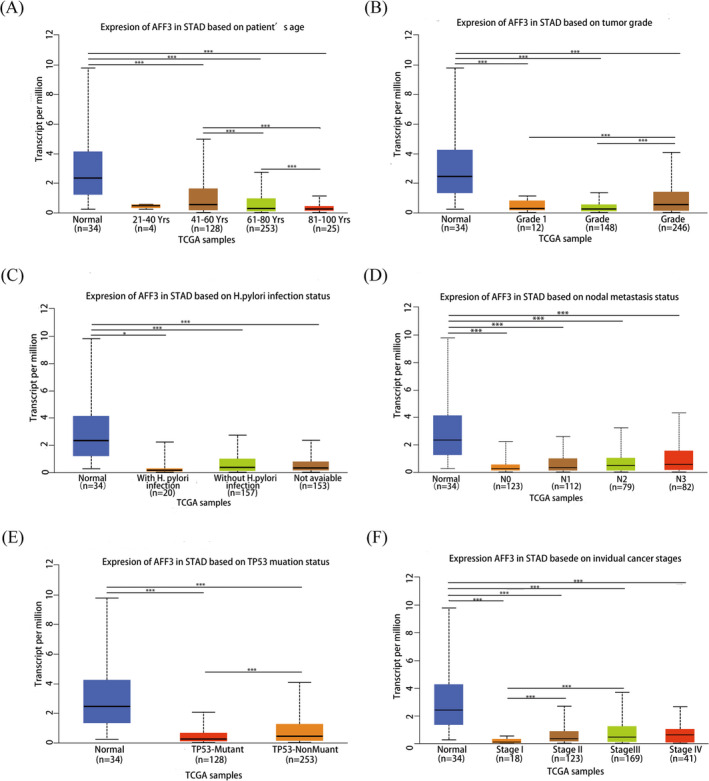
Correlation of AFF3 expression with clinical parameters in GC (A‐F). The AFF3 correlated with GC patient's age (A),tumor grade (B), H. pylori infection status (C), nodal metastasis status (D), TP53 mutation (E), and stages (F)
3.3. AFF3 expression is related to prognosis in GC
GEPIA was conducted to expound the prognostic value of AFF3. Patients were divided into high and low cohorts according to the median expression of AFF3. The results of the two databases demonstrated that higher expression of AFF3 was greatly associated with poor prognosis, worse overall survival (OS) (Figure 4A,B), worse post progress survival (PPS), and disease‐free survival (DFS) (Figure 4C,D). Subsequently, a Kaplan–Meier plotter was performed to further probe the correlation between AFF3 expression and prognosis of GC with specific clinical parameters. The elevated level of AFF3 was remarkably correlated with worse OS and PPS in GC patients with specific clinical parameters such as gender, stage II, T2, N0, N1, N1+2+3, M0, poorly differentiated, moderately differentiated, and HER2 status (Figure 4E,F). In addition to the previously mentioned clinical features, the higher expression of AFF3 is also correlated with worse PPS in GC patients with stage III, T3, and N2. Present outcomes indicated that AFF3 expression is a potential predictor of prognosis and closely related to clinical parameters in GC.
FIGURE 4.
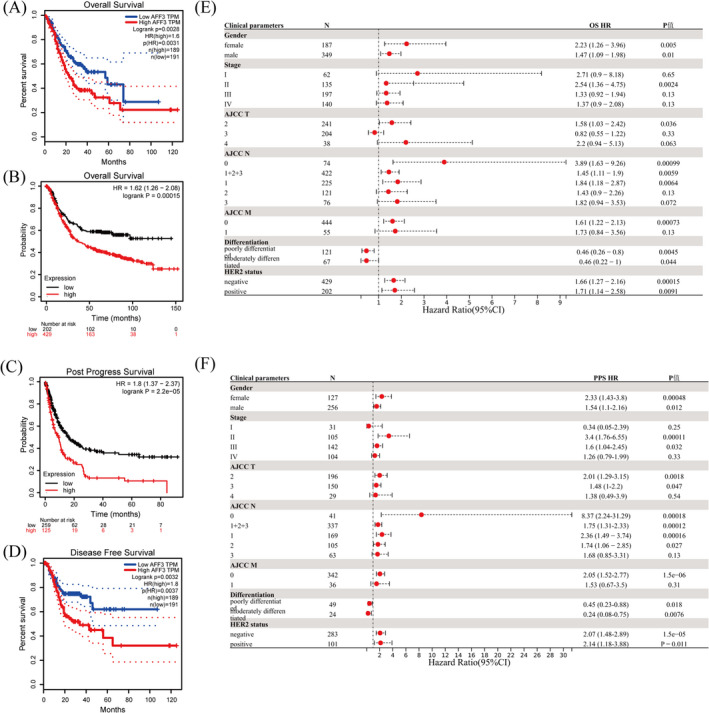
The prognosis of AFF3 for GC. Kaplan–Meier survival curve of OS (A, B), PPS (C), and DFS (D). Correlation of AFF3 mRNA levels and OS (E) and PPS(F) in GC patients with specific clinical features
3.4. Functional enrichment analysis of AFF3
To estimate the biological function of the AFF3 gene in GC, we filtered out DEGs from the TCGA datasets, in total 1851 DEGs, including 1791 upregulated genes and 60 downregulated genes, were screened out, and the results are presented as a volcano map (Figure 5A). GO and KEGG analysis was performed for these DEGs showing that in GO terms these DEGs were mainly involved in immune‐related functions such as B cell receptor signaling pathway, immune response‐regulating cell surface receptor signaling pathway, humoral immune response, antigen receptor‐mediated signaling pathway, positive regulation of B cell activation, and complement activation (Figure 5B). Similarly, KEGG analysis demonstrated these DEGs regulate immune response‐related pathways such as the cAMP signaling pathway, PI3K‐Akt signaling pathway, cytokine–cytokine receptor interaction, and chemokine signaling pathways. In addition, AFF3 is engaged in ECM–receptor interaction, focal adhesion, and cell adhesion molecules (Figure 5C).
FIGURE 5.
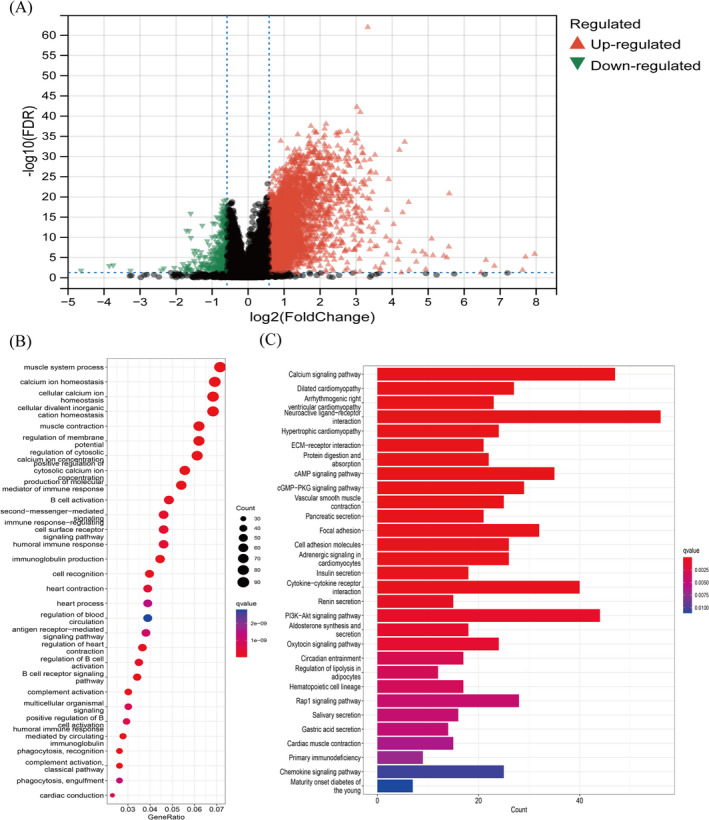
GO terms and KEGG pathway enrichment analysis of AFF3. (A)Volcano plot showing DEGs between high AFF3 expression group and low AFF3 expression group. (B) GO terms and (C) KEGG pathway enrichment analysis of DEGs
3.5. AFF3 mRNA expression is related to stromal/immune/estimate score and the infiltration of immune cells
To further reveal the possible mechanism of the relationship between AFF3 expression and clinical characteristics of GC patients, we analyzed its relationship with immune cell infiltration in GC. Accumulated evidence has illustrated that stromal and immune scores are related to prognosis and the infiltration of the immune cell in various cancers. 19 , 25 , 26 , 27 Accordingly, to evaluate the effect of AFF3 on the prognosis and TME, we assessed the association between ESTIMATE score and AFF3 expression, which showed a positive relation between AFF3 and stromal/immune/estimate score (Figure 6A–C). These findings demonstrated that AFF3 expression might affect the prognosis of GC and potentially regulate the infiltration of immune cells.
FIGURE 6.
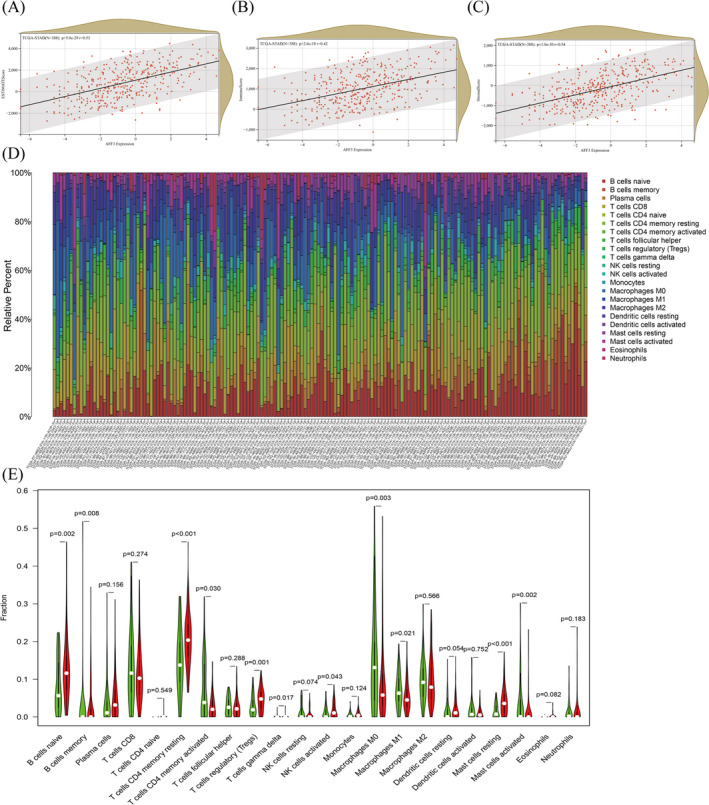
The influences of AFF3 on the infiltration of stromal and immune cell. AFF3 was related to estimate score (A), immune score (B), and stromal score (C). (D)The relative proportion of 21 TIICs in each GC tumor tissues from TCGA. (E) The differences of 22 TIICs between AFF3 high‐expression group and low‐expression group
TIICs reflect the host antitumor immune response and are crucial for the initiation and dissemination of tumors. We processed the gene expression profiles of TCGA by using the CIBERSORT method, and the p < 0.05 was set as a standard for the screening. The expression profiles of 21 TIICs in every GC tumor tissue sample are shown in Figure 6D. Next, the difference in TIICs between the high expression group and the low group in GC patients showed that of these 22 TIICs, 7 TIICs (naive B cells, T cells CD4 memory resting, Tregs, T cells gamma delta, NK cells activated, macrophages M1, and mast cells resting) were elevated in high AFF3 cohort compared to the low cohort. Contrastively, the ratio of B memory cells, T cells CD4 memory activated, macrophages M0, and activated mast cells in high AFF3 cohorts were observably decreased compared to low cohorts (Figure 6E).
To get a better understanding of the relationship between the expression level of AFF3 and the abundance of TIICs, TIMER2.0 and TISIDB databases were used. The TIMER2.0 demonstrated a significant negative correlation of AFF3 with tumor purity (r = −0.204, P = 6.28e‐5), while significantly positive correlation was observed 12 TIICs including CD4+ T cell (r = 0.589, P = 9.63e‐37), CD8+ T cell (r = 0.428, p = 2.83e‐18), Treg (r = 0.428, p = 2.83e‐8), B cell naive (r = 0.461, p = 2.60e−21), B cell memory (r = 0.45, p = 3.00e‐20), B cell plasma (r = 0.174, p = 6.64e‐4), eosinophil (r = 0.254, p = 5.23e‐7), monocyte (r = 0.41, p = 8.54e‐17), myeloid dendritic cell (r = 0.318, p = 2.51e‐10), macrophage (r = 0.41, p = 8.92e‐17), mast cell (r = 0.173, p = 6.94e‐4), and neutrophils (r = 0.361, p = 4.39e‐13) (Figure 7A). The similar relationship between AFF3 expression and the abundance of TIICs in GC was acquired from TISIDB (Figure 7B). These results further supported the viewpoint that the level of AFF3 might have a pivotal role in the profusion of TIICs in TME.
FIGURE 7.
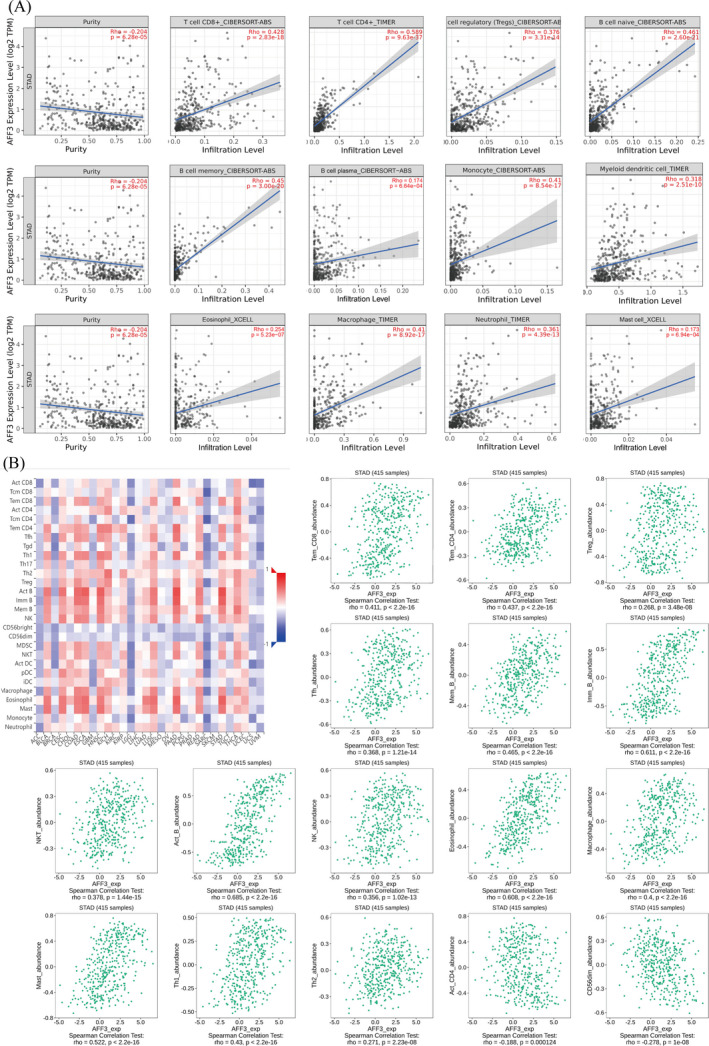
The association between AFF3 and TIICs. (A) AFF3 expression positively associated with 12 kinds of TIICs in TIMER2.0. (B) Correlation of AFF3 expression with 16 TIICs in TISIDB. Effector memory CD8 T cell (Tem_CD8), effector memory CD4 T cell (Tem_CD4), regulator T cell (Treg), T follicular helper cell (Tfh), memory B cell (Mem_B), immature B cell (Imm_B), natural killer T cell (NKT), natural killer cell (NK), mast cell (Mast), type 1 T helper cell (Th1), type 2 T helper cell (Th2), activated CD4 T cell (Act_CD4), and CD56dim natural killer cell (CD56dim)
3.6. Relation analysis between AFF3 and gene markers of immune cell
Furthermore, using TIMER2.0 and GEPIA databases, we studied whether AFF3 expression has any relation to infiltrating immune cells in GC. We found a positive correlation of AFF3 with the multiple markers of immune cells, including B cell, T cell, monocyte, CD8+T cell, M2 macrophage dendritic cell, Tfh, Th2 Treg, and TAM. Specifically, AFF3 showed a strong association with CCR7 (neutrophil marker), CD1C (dendritic cell marker), and STAT5B (Treg marker) (Tables 1, 2). Immune cell infiltration analysis showed that Treg cells showed a strong positive association with AFF3 and have a significant difference between high and low AFF3 expression groups.
TABLE 1.
Correlation analysis between AFF3 and genes markers of immune cells in TIMER2.0
| Description | Gene makers | STAD | |||
|---|---|---|---|---|---|
| None | Purity | ||||
| Cor | p | Cor | p | ||
| B cell | CD79A | 0.578 | *** | 0.557 | *** |
| CD19 | 0.621 | *** | 0.606 | *** | |
| T cell | CD2 | 0.37 | *** | 0.35 | *** |
| CD3D | 0.342 | *** | 0.313 | *** | |
| CD3E | 0.402 | *** | 0.385 | *** | |
| Monocyte | CSF1R | 0.439 | *** | 0.418 | *** |
| CD86 | 0.271 | *** | 0.241 | *** | |
| CD8+Tcell | CD8A | 0.366 | *** | 0.357 | *** |
| CD8B | 0.266 | *** | 0.259 | *** | |
| M1 Macrophage | NOS2 | −0.004 | 0.94 | −0.015 | 0.776 |
| PTGS2 | 0.113 | * | 0.094 | 0.0685 | |
| IRF5 | 0.258 | *** | 0.235 | *** | |
| M2 Macrophage | CD163 | 0.287 | *** | 0.277 | *** |
| MS4A4A | 0.341 | *** | 0.328 | *** | |
| VSIG4 | 0.232 | *** | 0.233 | *** | |
| Neutrophils | CEACAM8 | 0.093 | 0.0579 | 0.103 | * |
| ITGAM | 0.389 | *** | 0.376 | *** | |
| CCR7 | 0.678 | *** | 0.675 | *** | |
| Dendritic cell | HLA‐DPA1 | 0.244 | *** | 0.212 | *** |
| HLA‐DPB1 | 0.315 | *** | 0.283 | *** | |
| HLA‐DQB1 | 0.176 | *** | 0.133 | ** | |
| HLA‐DRA | 0.203 | *** | 0.171 | *** | |
| NRP1 | 0.421 | *** | 0.398 | *** | |
| CD1C | 0.712 | *** | 0.707 | *** | |
| ITGAX | 0.336 | *** | 0.307 | *** | |
| NKT | KIR2DL1 | 0.08 | 0.12 | 0.07 | 0.172 |
| KIR2DL3 | 0.064 | 0.195 | 0.021 | 0.684 | |
| KIR2DL4 | −0.022 | 0.656 | −0.036 | 0.488 | |
| KIR2DS4 | 0.056 | * | 0.037 | 0.474 | |
| KIR3DL1 | 0.158 | ** | 0.146 | ** | |
| KIR3DL2 | 0.173 | *** | 0.148 | ** | |
| KIR3DL3 | 0.021 | 0.666 | 0.027 | 0.603 | |
| Tfh | BCL6 | 0.469 | *** | 0.46 | *** |
| IL21 | 0.165 | *** | 0.14 | ** | |
| Th2 | GATA3 | 0.411 | *** | 0.402 | *** |
| STAT5A | 0.408 | *** | 0.407 | *** | |
| STAT6 | 0.236 | *** | 0.251 | *** | |
| IL13 | 0.104 | * | 0.086 | 0.0946 | |
| Th17 | STAT3 | 0.385 | *** | 0.388 | *** |
| IL17A | −0.112 | * | −0.145 | ** | |
| Th1 | TBX21 | 0.379 | *** | 0.353 | *** |
| STAT4 | 0.488 | *** | 0.471 | *** | |
| STAT1 | 0.01 | 0.843 | 0.01 | 0.853 | |
| IFNG | −0.053 | 0.278 | −0.077 | 0.135 | |
| TNF | 0.118 | * | 0.063 | 0.218 | |
| Treg | TGFB1 | 0.408 | *** | 0.369 | *** |
| CCR8 | 0.38 | *** | 0.36 | *** | |
| STAT5B | 0.605 | *** | 0.599 | *** | |
| FOXP3 | 0.311 | *** | 0.282 | *** | |
| T cell exhaustion | GZMB | −0.084 | 0.0862 | −0.134 | ** |
| HAVCR2 | 0.233 | *** | 0.214 | *** | |
| LAG3 | 0.128 | ** | 0.108 | * | |
| PDCD1 | 0.256 | *** | 0.234 | *** | |
| CTLA4 | 0.188 | *** | 0.16 | ** | |
| TAM | CD68 | 0.125 | * | 0.105 | * |
| IL10 | 0.304 | *** | 0.265 | *** | |
| CCL2 | 0.337 | *** | 0.311 | *** | |
TABLE 2.
Correlation analysis between AFF3 and gene markers of immune cells in GEPIA
| Description | Gene marker | COR | p |
|---|---|---|---|
| B cell | CD19 | 0.51 | *** |
| CD79 | 0.49 | *** | |
| Monocyte | CD115 | 0.42 | *** |
| CD86 | 0.21 | *** | |
| M1 Macrophage | NOS2 | −0.071 | 0.14 |
| PTGS2 | 0.14 | ** | |
| s | IRF5 | 0.18 | *** |
| M2 Macrophage | CD163 | 0.17 | *** |
| MS4A4A | 0.33 | *** | |
| VSIG4 | 0.22 | *** | |
| TAM | CD68 | 0.075 | 0.11 |
| IL10 | 0.3 | *** | |
| CCL2 | 0.34 | *** | |
| Treg | TGFB1 | 0.36 | *** |
| CCR8 | 0.23 | *** | |
| STAT5B | 0.52 | *** | |
| FOXP3 | 0.16 | *** | |
| Neutrophils | CEACAM8 | 0.05 | 0.29 |
| ITGAM | 0.34 | *** | |
| CCR7 | 0.57 | *** |
3.7. Relationship between AFF3 expression and the immune checkpoints
To estimate the value of AFF3 in gastric cancer immunotherapy, we studied the correlation between the expression of AFF3 and ICs in GC. Among 30 ICs, the level of AFF3 expression was positively related to 26 kinds of ICs and negatively related to CEACAM1 (Figure 8A). For some common ICs (CD96, CD39 (ENTPD1), ADORA2A (adenosine A2a receptor), CD200, CD48, CD200R1, CTLA‐4, and PDCD1), we further drew a scatterplot to show the correlation with AFF3 expression (Figure 8B–I). These results showed that elevated AFF3 expression was positively correlated with the expression of ICs, which, accordingly, might suggest a better response to immunotherapy. The expression of AFF3 was significantly correlated with TMB and MSI in 17 kinds of tumors, particularly, negatively correlated with STAD (Figure 9A,B).
FIGURE 8.
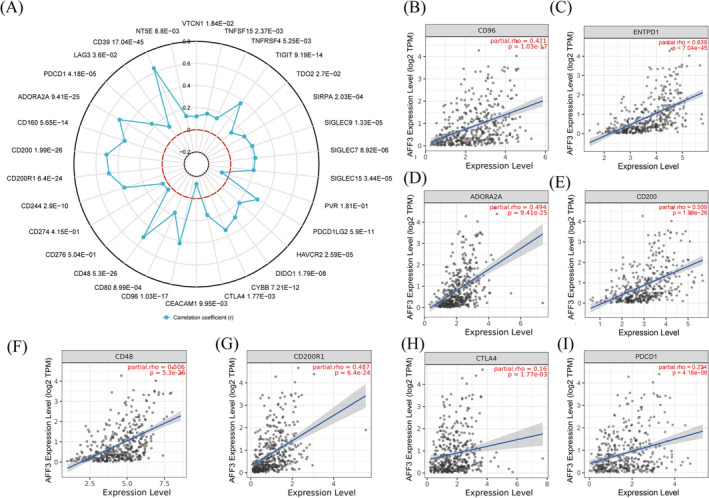
Association of AFF3 with ICs in GC. (A) The relation between the mRNA level of AFF3 and ICIs. (B‐I) AFF3 expression related to CD96, CD39, ADORA2A, CD200, CD48, CD200R1, CTLA‐4, and PDCD1 (PD‐1)
FIGURE 9.
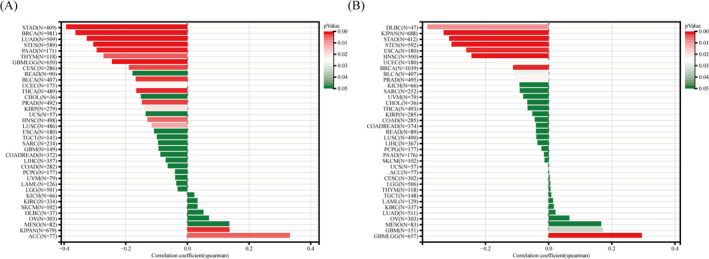
The expression association of AFF3 with TMB(A) and MSI(B) in diverse cancers
4. DISCUSSION
Due to the high incidence and rapid progression rate of GC, only less than 30% of GC is diagnosed at an early stage, so mostly at a diagnosis, the tumor cells have already been metastasized. 28 The median overall survival of these patients remains less than 1 year. 29 Despite there being many markers to predict the prognosis of GC, the intratumoral, intrapatient, and interpatient heterogeneity in GC still poses a huge challenge for predicting the prognosis of the patients and choosing appropriate treatments. 2 AFF3 is a fused MLL gene that is closely associated with the onset of infant acute lymphoblastic leukemia, however, its differential expression was initially found in lymphocytes of different developmental stages. 30 Recently, increasing literature has indicated abnormal expression of AFF3 in various cancers, also predicted to be involved in the onset and development of many cancers. 6 , 31 , 32 AFF3 as the direct target of the Wnt/β‐catenin signaling pathway thus silencing can impair the cells’ proliferation and induce apoptosis in ACC. 11 In the current study, the results of multiple databases indicated that AFF3 was downregulated in multiple cancer including GC while patients with unfavorable clinicopathological characteristics usually have high expression levels of AFF3. The Kaplan–Meier survival curve of OS, PPS, FP, and DFS illustrated that the GC patients with a higher level of AFF3 have poor and short overall survival time, which is consistent with the effect of AFF3 on prognosis in ACC and breast tumors. 11 , 31 , 33 These findings strongly suggested that AFF3 might serve as tumor promoting and the high expression of AFF3 was closely related to a worse outcome for GC patients.
TME is consisted of stromal cells, fibroblasts, endothelial cells, and immune cells and reflects patients’ prognosis and the efficacy of the tumor immunotherapy. 34 , 35 These cells jointly sculpt a microenvironment favored tumor progression through releasing diverse molecules. 36 Accumulating pieces of evidence have elucidated that TME affects cancer prognosis through multiple pathways. For example, the stromal and immune cells could disturb the tumor signaling, which further affects the tumor prognosis. 19 In addition, the density of infiltrated immune cells also has a crucial effect on patients’ prognosis in a variety of cancers; the presence of stromal cells and other immune cells have a strong correlation with the prognosis of multiple cancer. 37 , 38 , 39 Additionally, growing studies have shown that the high immune/stromal/estimate score is an independent prognostic factor(s) for poor overall survival of GC. 3 , 25 , 40 , 41 In our study, the overexpression of AFF3 was positively correlated with the high immune/stromal/estimate. The result, from the other perspective, expounded the correlation of AFF3 with a worse outcome of patients in GC. Based on the positive correlation of AFF3 with an immune score, we could infer that the AFF3 expression might affect the infiltration of immune cells. We found a higher level of Treg cells in GC patients with a higher expression of AFF3. The infiltration of Treg cells in TME is recruited in multiple cancer including GC. The higher Treg cells infiltration usually indicates a poor prognosis in the pan‐cancer. 42 , 43 , 44 In addition, we also found that TME infiltration of macrophage M1 was significantly increased in the AFF3 low expression group. It is well known that macrophage M1, as a key cell of innate immunity, can effectively kill tumor cells. 45 In the AFF3 high expression group, we found that naive B cells, T cells CD4 memory resting was significantly increased, and previous studies have shown that tumor infiltration of these cells is associated with poor patient prognosis. 46 Collectively, our findings suggest that high expression of AFF3 can promote immune cell infiltration associated with poor prognosis in GC patients, which helps us better explain the relationship between AFF3 expression and prognosis in GC patients.
TIICs are composed of macrophages, myeloid‐derived suppressor cells, and lymphocytes and exert their roles by assisting tumor cells to evade the host immune surveillance. The immune checkpoints inhibitors (ICIs) initially act to prevent excessive activation of T lymphocytes, nonetheless, tumor cells utilize this characteristic to elude the supervision of the immune system. 47 The efficacy of ICIs is limited for most GC patients, which is closely related to biomarkers’ expressions, such as the level of programmed death ligand‐1 (PD‐L1), TMB, and MSI in the GC. 28 PD‐L1 is a ligand for programmed cell death protein‐1 (PD‐1) which is a co‐inhibitory cell surface receptor, and the binding of PD‐1/PD‐L1 blocks the signal of activating the T cell and subsequently, result in tumor escape. 48 Similarly, the higher TMB was associated with a better prognosis and the clinical response to ICIs 49 , 50 and GC patients with high MSI are more likely to respond to ICIs. 51 In this study, we found that AFF3 was positively correlated with multiple ICs and negatively correlated with TMB and MSI, which may suggest that high AFF3 expression may have a better response to ICIs.
5. CONCLUSION
Here, we conclude that AFF3 may be a promising potential marker for the diagnosis and prognosis of GC patients, and may influence response to ICIs by affecting immune cells infiltration and ICs expression in the TME.
CONFLICT OF INTEREST
Authors declare no conflict of interest.
AUTHOR CONTRIBUTION
YLZ: Conceptualization of the study and prepared first draft, XPZ: Analyzed the data and revised first draft. FZL and YW: Drafted the manuscript. MW: Conceived idea of the study, supervised overall work, and reviewed & revised final draft. All authors read and approved the submission of the final manuscript.
ETHICAL STATEMENT
Not required.
ACKNOWLEDGMENTS
We acknowledge the TIMER2.0, TCGA, GEPIA, GEO, UALCAN, Kaplan–Meier plotter, Sangerbox3.0, and the Human Protein Atlas databases for free use.
Zeng Y, Zhang X, Li F, Wang Y, Wei M. AFF3 is a novel prognostic biomarker and a potential target for immunotherapy in gastric cancer. J Clin Lab Anal. 2022;36:e24437. doi: 10.1002/jcla.24437
Funding information
No funding
DATA AVAILABILITY STATEMENT
The data used in this study are freely available on the TCGA (http://tcga.cancer.gov/dataportal) portal, the database of GEO (https://www.ncbi.nlm.nih.gov/geo/), GEPIA (http://gepia.cancer‐pku.cn/index.html), Kaplan–Meier plotter (http://kmplot.com/analysis/index.php?p=background), TIMER2.0 (http://timer.cistrome.org/), Sangerbox3.0 (http://vip.sangerbox.com/home.html), the Human Protein Atlas (https://www.proteinatlas.org/), and UALCAN (http://ualcan.path.uab.edu/). Our analyses, protocols, and raw figures or other information related to this study could be requested from the corresponding author(s) upon reasonable request.
REFERENCES
- 1. Sung H, Ferlay J, Siegel RL, et al. Global cancer statistics 2020: GLOBOCAN estimates of Incidence and mortality worldwide for 36 cancers in 185 countries. CA Cancer J Clin. 2021;71(3):209‐249. [DOI] [PubMed] [Google Scholar]
- 2. Smyth EC, Nilsson M, Grabsch HI, van Grieken NCT, Lordick F. Gastric cancer. The Lancet. 2020;396(10251):635‐648. [DOI] [PubMed] [Google Scholar]
- 3. Zeng D, Zhou R, Yu Y, et al. Gene expression profiles for a prognostic immunoscore in gastric cancer. Br J Surg. 2018;105(10):1338‐1348. [DOI] [PMC free article] [PubMed] [Google Scholar]
- 4. Joshi SS, Badgwell BD. Current treatment and recent progress in gastric cancer. CA Cancer J Clin. 2021;71(3):264‐279. [DOI] [PMC free article] [PubMed] [Google Scholar]
- 5. Hegde PS, Chen DS. Top 10 challenges in cancer immunotherapy. Immunity. 2020;52(1):17‐35. [DOI] [PubMed] [Google Scholar]
- 6. Ma C, Staudt LM. LAF‐4 encodes a lymphoid nuclear protein with transactivation potential that is homologous to AF‐4, the gene fused to MLL in t(4;11) leukemias. Blood. 1996;87(2):734‐745. [PubMed] [Google Scholar]
- 7. Castelino M, Barton A. Genetic susceptibility factors for psoriatic arthritis. Curr Opin Rheumatol. 2010;22(2):152‐156. [DOI] [PubMed] [Google Scholar]
- 8. Barton A, Eyre S, Ke X, et al. Identification of AF4/FMR2 family, member 3 (AFF3) as a novel rheumatoid arthritis susceptibility locus and confirmation of two further pan‐autoimmune susceptibility genes. Hum Mol Genet. 2009;18(13):2518‐2522. [DOI] [PMC free article] [PubMed] [Google Scholar]
- 9. Chen F, Li Y, Qin N, et al. RNA‐seq analysis identified hormone‐related genes associated with prognosis of triple negative breast cancer. J Biomed Res. 2020;34(2):129‐138. [DOI] [PMC free article] [PubMed] [Google Scholar]
- 10. Zhang DL, Qu LW, Ma L, et al. Genome‐wide identification of transcription factors that are critical to non‐small cell lung cancer. Cancer Lett. 2018;434:132‐143. [DOI] [PubMed] [Google Scholar]
- 11. Lefevre L, Omeiri H, Drougat L, et al. Combined transcriptome studies identify AFF3 as a mediator of the oncogenic effects of beta‐catenin in adrenocortical carcinoma. Oncogenesis. 2015;4:e161. [DOI] [PMC free article] [PubMed] [Google Scholar]
- 12. Bhargava S, Patil V, Mahalingam K, Somasundaram K. Elucidation of the genetic and epigenetic landscape alterations in RNA binding proteins in glioblastoma. Oncotarget. 2017;8(10):16650‐16668. [DOI] [PMC free article] [PubMed] [Google Scholar]
- 13. Li TW, Fu JX, Zeng ZX, et al. TIMER2.0 for analysis of tumor‐infiltrating immune cells. Nucleic Acids Res. 2020;48(W1):W509‐W514. [DOI] [PMC free article] [PubMed] [Google Scholar]
- 14. Hu J, Qiu DX, Yu AZ, et al. YTHDF1 Is a potential pan‐cancer biomarker for prognosis and immunotherapy. Front Oncol. 2021;11:607224. [DOI] [PMC free article] [PubMed] [Google Scholar]
- 15. Tang ZF, Li CW, Kang BX, Gao G, Li C, Zhang ZM. GEPIA: a web server for cancer and normal gene expression profiling and interactive analyses. Nucleic Acids Res. 2017;45(W1):W98‐W102. [DOI] [PMC free article] [PubMed] [Google Scholar]
- 16. Barrett T, Wilhite SE, Ledoux P, et al. NCBI GEO: archive for functional genomics data sets‐‐update. Nucleic Acids Res. 2012;41(D1):D991‐D995. [DOI] [PMC free article] [PubMed] [Google Scholar]
- 17. Chandrashekar DS, Bashel B, Balasubramanya SAH, et al. UALCAN: a portal for facilitating tumor subgroup gene expression and survival analyses. Neoplasia. 2017;19(8):649‐658. [DOI] [PMC free article] [PubMed] [Google Scholar]
- 18. Gu YR, Li XY, Bi YH, et al. CCL14 is a prognostic biomarker and correlates with immune infiltrates in hepatocellular carcinoma. Aging‐Us. 2020;12(1):784‐807. [DOI] [PMC free article] [PubMed] [Google Scholar]
- 19. Yoshihara K, Shahmoradgoli M, Martinez E, et al. Inferring tumour purity and stromal and immune cell admixture from expression data. Nat Commun. 2013;4:2612. [DOI] [PMC free article] [PubMed] [Google Scholar]
- 20. Zhou T, Yang P, Tang SY, et al. Classification of lung adenocarcinoma based on immune checkpoint and screening of related genes. J Oncol. 2021;2021:5512325. [DOI] [PMC free article] [PubMed] [Google Scholar]
- 21. Xiao Z, Hu L, Yang L, et al. TGFbeta2 is a prognostic‐related biomarker and correlated with immune infiltrates in gastric cancer. J Cell Mol Med. 2020;24(13):7151‐7162. [DOI] [PMC free article] [PubMed] [Google Scholar]
- 22. Ru BB, Wong CN, Tong Y, et al. TISIDB: an integrated repository portal for tumor‐immune system interactions. Bioinformatics. 2019;35(20):4200‐4202. [DOI] [PubMed] [Google Scholar]
- 23. Bagchi S, Yuan R, Engleman EG. Immune checkpoint inhibitors for the treatment of cancer: clinical impact and mechanisms of response and resistance. Annu Rev Pathol. 2021;16:223‐249. [DOI] [PubMed] [Google Scholar]
- 24. Cui Y, Li Q, Li W, et al. NOTCH3 is a prognostic factor and is correlated with immune tolerance in gastric cancer. Front Oncol. 2020;10:574937. [DOI] [PMC free article] [PubMed] [Google Scholar]
- 25. Yu S, Wang Y, Peng K, Lyu M, Liu F, Liu T. Establishment of a prognostic signature of stromal/immune‐related genes for gastric adenocarcinoma based on ESTIMATE algorithm. Front Cell Dev Biol. 2021;9:752023. [DOI] [PMC free article] [PubMed] [Google Scholar]
- 26. Ma Q, Chen Y, Xiao F, et al. A signature of estimate‐stromal‐immune score‐based genes associated with the prognosis of lung adenocarcinoma. Transl Lung Cancer Res. 2021;10(3):1484‐1500. [DOI] [PMC free article] [PubMed] [Google Scholar]
- 27. Chen Y, Wang W, Jiang B, Yao L, Xia F, Li X. Integrating tumor stroma biomarkers with clinical indicators for colon cancer survival stratification. Front Med. 2020;7:923. [DOI] [PMC free article] [PubMed] [Google Scholar]
- 28. Li K, Zhang A, Li X, Zhang H, Zhao L. Advances in clinical immunotherapy for gastric cancer. Biochim Biophys Acta Rev Cancer. 2021;1876(2):188615. [DOI] [PubMed] [Google Scholar]
- 29. Patel TH, Cecchini M. Targeted therapies in advanced gastric cancer. Curr Treat Options Oncol. 2020;21(9):70. [DOI] [PubMed] [Google Scholar]
- 30. Hiwatari M, Taki T, Taketani T, et al. Fusion of an AF4‐related gene, LAF4, to MLL in childhood acute lymphoblastic leukemia with t(2;11)(q11;q23). Oncogene. 2003;22(18):2851‐2855. [DOI] [PubMed] [Google Scholar]
- 31. Shi Y, Zhao Y, Zhang Y, et al. AFF3 upregulation mediates tamoxifen resistance in breast cancers. J Exp Clin Cancer Res. 2018;37(1):254. [DOI] [PMC free article] [PubMed] [Google Scholar]
- 32. Chandra S, Goswami A, Mandal P. Molecular heterogeneity of cervical cancer among different ethnic/racial populations. J Racial Ethn Health Disparities. 2021. [DOI] [PubMed] [Google Scholar]
- 33. To MD, Faseruk SA, Gokgoz N, Pinnaduwage D, Done SJ, Andrulis IL. LAF‐4 is aberrantly expressed in human breast cancer. Int J Cancer. 2005;115(4):568‐574. [DOI] [PubMed] [Google Scholar]
- 34. Kono K, Nakajima S, Mimura K. Current status of immune checkpoint inhibitors for gastric cancer. Gastric Cancer. 2020;23(4):565‐578. [DOI] [PubMed] [Google Scholar]
- 35. Sadeghi Rad H, Monkman J, Warkiani ME, et al. Understanding the tumor microenvironment for effective immunotherapy. Med Res Rev. 2021;41(3):1474‐1498. [DOI] [PMC free article] [PubMed] [Google Scholar]
- 36. Oya Y, Hayakawa Y, Koike K. Tumor microenvironment in gastric cancers. Cancer Sci. 2020;111(8):2696‐2707. [DOI] [PMC free article] [PubMed] [Google Scholar]
- 37. Ma QL, Chen Y, Xiao F, et al. A signature of estimate‐stromal‐immune score‐based genes associated with the prognosis of lung adenocarcinoma. Translat Lung Can Res. 2021;10(3):1484‐1500. [DOI] [PMC free article] [PubMed] [Google Scholar]
- 38. Liu XC, Niu X, Qiu ZG. A five‐gene signature based on stromal/immune scores in the tumor microenvironment and its clinical implications for liver cancer. DNA Cell Biol. 2020;39(9):1621‐1638. [DOI] [PubMed] [Google Scholar]
- 39. Yao J, Wang C, Dong X, et al. lncRNA SNHG22 sponges miR‐128‐3p to promote the progression of colorectal cancer by upregulating E2F3. Int J Oncol. 2021;59(3):71. [DOI] [PMC free article] [PubMed] [Google Scholar]
- 40. Mao M, Yu Q, Huang R, Lu Y, Wang Z, Liao L. Stromal score as a prognostic factor in primary gastric cancer and close association with tumor immune microenvironment. Cancer Med. 2020;9(14):4980‐4990. [DOI] [PMC free article] [PubMed] [Google Scholar]
- 41. Zhu X, Xie X, Zhao Q, Zhang L, Li C, Zhao D. Potential prognostic value and mechanism of stromal‐immune signature in tumor microenvironment for stomach adenocarcinoma. Biomed Res Int. 2020;2020:4673153. [DOI] [PMC free article] [PubMed] [Google Scholar]
- 42. Wang X, Lang M, Zhao T, et al. Cancer‐FOXP3 directly activated CCL5 to recruit FOXP3(+) Treg cells in pancreatic ductal adenocarcinoma. Oncogene. 2017;36(21):3048‐3058. [DOI] [PMC free article] [PubMed] [Google Scholar]
- 43. Barua S, Fang P, Sharma A, et al. Spatial interaction of tumor cells and regulatory T cells correlates with survival in non‐small cell lung cancer. Lung Cancer. 2018;117:73‐79. [DOI] [PMC free article] [PubMed] [Google Scholar]
- 44. Li FX, Zhao Y, Wei LJ, Li SX, Liu JT. Tumor‐infiltrating Treg, MDSC, and IDO expression associated with outcomes of neoadjuvant chemotherapy of breast cancer. Cancer Biol Ther. 2018;19(8):695‐705. [DOI] [PMC free article] [PubMed] [Google Scholar]
- 45. Dan H, Liu S, Liu J, et al. RACK1 promotes cancer progression by increasing the M2/M1 macrophage ratio via the NF‐kappaB pathway in oral squamous cell carcinoma. Mol Oncol. 2020;14(4):795‐807. [DOI] [PMC free article] [PubMed] [Google Scholar]
- 46. Zhang L, Hu D, Huangfu S, et al. DNA repair and replication‐related gene signature based on tumor mutation burden reveals prognostic and immunotherapy response in gastric cancer. J Oncol. 2022;2022:6469523. [DOI] [PMC free article] [PubMed] [Google Scholar]
- 47. Ramsay AG. Immune checkpoint blockade immunotherapy to activate anti‐tumour T‐cell immunity. British J Haematol. 2013;162(3):313‐325. [DOI] [PubMed] [Google Scholar]
- 48. Kawazoe A, Kuwata T, Kuboki Y, et al. Clinicopathological features of programmed death ligand 1 expression with tumor‐infiltrating lymphocyte, mismatch repair, and Epstein‐Barr virus status in a large cohort of gastric cancer patients. Gastric Cancer. 2017;20(3):407‐415. [DOI] [PubMed] [Google Scholar]
- 49. Samstein RM, Lee CH, Shoushtari AN, et al. Tumor mutational load predicts survival after immunotherapy across multiple cancer types. Nat Genet. 2019;51(2):202‐206. [DOI] [PMC free article] [PubMed] [Google Scholar]
- 50. Greally M, Chou JF, Chatila WK, et al. Clinical and molecular predictors of response to immune checkpoint inhibitors in patients with advanced esophagogastric cancer. Clin Cancer Res. 2019;25(20):6160‐6169. [DOI] [PMC free article] [PubMed] [Google Scholar]
- 51. Le DT, Uram JN, Wang H, et al. PD‐1 blockade in tumors with mismatch‐repair deficiency. N Engl J Med. 2015;372(26):2509‐2520. [DOI] [PMC free article] [PubMed] [Google Scholar]
Associated Data
This section collects any data citations, data availability statements, or supplementary materials included in this article.
Data Availability Statement
The data used in this study are freely available on the TCGA (http://tcga.cancer.gov/dataportal) portal, the database of GEO (https://www.ncbi.nlm.nih.gov/geo/), GEPIA (http://gepia.cancer‐pku.cn/index.html), Kaplan–Meier plotter (http://kmplot.com/analysis/index.php?p=background), TIMER2.0 (http://timer.cistrome.org/), Sangerbox3.0 (http://vip.sangerbox.com/home.html), the Human Protein Atlas (https://www.proteinatlas.org/), and UALCAN (http://ualcan.path.uab.edu/). Our analyses, protocols, and raw figures or other information related to this study could be requested from the corresponding author(s) upon reasonable request.


