Abstract
Objective
To identify differentially expressed lncRNA, miRNA, and mRNA during the pathogenesis of gout, explore the ceRNA network regulatory mechanism of gout, and seek potential therapeutic targets.
Method
First, gout‐related chips were retrieved by GEO database. Then, the analysis of differentially expressed lncRNAs and mRNAs was conducted by R language and other software. Besides, miRNA and its regulated mRNA were predicted based on public databases, the intersection of differentially expressed mRNA and predicated mRNA was taken, and the lncRNA‐miRNA‐mRNA regulatory relationships were obtained to construct the ceRNA regulatory network. Subsequently, hub genes were screened by the STRING database and Cytoscape software. Then the DAVID database was used to illustrate the gene functions and related pathways of hub genes and to mine key ceRNA networks.
Results
Three hundred and eighty‐eight lncRNAs and 758 mRNAs were identified with significant differential expression in gout patient, which regulates hub genes in the ceRNA network, such as JUN, FOS, PTGS2, NR4A2, and TNFAIP3. In the ceRNA network, lncRNA competes with mRNA for miRNA, thus affecting the IL‐17 signaling pathway, TNF signaling pathway, Oxytocin signaling pathway, and NF‐κB signaling pathway through regulating the cell's response to chemical stress. The research indicates that five miRNAs (miR‐429, miR‐137, miR‐139‐5p, miR‐217, miR‐23b‐3p) and five lncRNAs (SNHG1, FAM182A, SPAG5‐AS1, HNF1A‐AS1, UCA1) play an important role in the formation and development of gout.
Conclusion
The interaction in the ceRNA network can affect the formation and development of gout by regulating the body's inflammatory response as well as proliferation, differentiation, and apoptosis of chondrocytes and osteoclasts. The identification of potential therapeutic targets and signaling pathways through ceRNA network can provide a reference for further research on the pathogenesis of gout.
Keywords: bioinformatics, competitive endogenous RNA, GEO database, gout, LncRNA
1. INTRODUCTION
Gout is one of the most common metabolic rheumatism, it features the chronic deposition of monosodium urate (MSU) crystals that lead to recurrent gouty arthritis, tophus, kidney stones, and gouty nephropathy. 1
Epidemiological evidence shows that gout has seen an increasing global incidence and gets younger in the past few decades, which incurred a huge burden on social medical costs. It also undermines the quality of life of patients, drains labor forces, and impedes socioeconomic development, while its specific pathogenesis still remains unknown. 2 Previous studies have shown that hyperuricemia is the pathological basis of gout attacks, and MSU formation and its induced inflammation is the key to the emergence of clinical symptoms. 3 However, serum sodium urate has not risen in some patients with acute onset of gout when there were apparent symptoms. Commonly used drugs for the treatment of gout at present mainly include non‐steroidal anti‐inflammatory drugs, colchicine, glucocorticoids, all of which have many toxic side effects and contraindications. 4 , 5 Therefore, further research on molecular mechanisms of gout is essential for discovering safe and effective diagnostic and therapeutic targets.
Long non‐coding RNA (lncRNA) is a type of non‐coding RNA with a length greater than 200 nucleotides. When discovered, it was considered to have no actual function, but recent studies have confirmed that lncRNA plays a regulatory role in the biological processes (including epigenetic regulation, transcription regulation, and post‐transcriptional regulation in the form of RNA), and in regulating the innate and adaptive immune response and immune cell development at the same time, which makes it a biomarker for the diagnosis of many diseases. 6 Recent studies have shown that lncRNA can act as a competitive endogenous RNA (ceRNA) sponge to absorb miRNA to change the expression of messenger RNA (mRNA) in the development of gout, thereby participating in the immune response, inflammation, cell metabolism, and other biological processes of gout. 7 , 8 , 9 However, only few related researches are reported and specific mechanism has not yet been clarified. Therefore, microarray chip of gout was analyzed and a ceRNA network of it was constructed in this study. Related functions and pathways regulated by the ceRNA network through bioinformatics methods were analyzed to offer new insights into the pathogenesis of gout and screen out potential therapeutic targets.
2. DATA AND METHODS
2.1. Screening‐related chips for gout
“Gout” AND “Long non‐coding RNA” AND “Expression profiling by array” were applied for dataset retrieval. Most of the databases, such as TCGA and Oncomine, currently mainly provide high‐throughput microarray data on cancer‐related research, and few databases, such as Gene Expression Omnibus (GEO) database, provide data on nontumor diseases. 10 Therefore, this study selected the only gout chip in GEO database for bioinformatics analysis. The chip matrix file is GSE160170 and the platform file is GPL21827. A total of 12 samples were included, of which six were peripheral blood of gout patients and six were peripheral blood of healthy controls.
2.2. Re‐annotation comparison
Probe nucleic acid sequences in the platform file were made fasta format. 11 Then, the nucleotide sequences were downloaded from the Gencode database. After that, the two were compared by R language to obtain the probe file with gene names.
2.3. Chip data analysis
Perl language was applied to compare the matrix file with probe file to obtain the gene expression profile data set of gout patients and healthy controls. The human chromosome file was downloaded from the Gencode platform to add gene attributes to the data to distinguish mRNA and lncRNA. Then, the difference in genes was analyzed by the limma package of R language, p < 0.05 and |log2 fold change (FC)|>1 were used as filter to screen out differentially expressed mRNAs and lncRNAs, and finally the pheatmap package of R language was used to draw differential heatmap of differentially expressed lncRNAs.
2.4. Interaction prediction of lncRNA, miRNA, and mRNA
miRNAs that interact with differentially expressed lncRNAs were screened with the mircode database. Then, predicate mRNAs affected by miRNAs from public databases (miRTarBase, TargetScan, miRDB), 12 , 13 , 14 select mRNAs that could be predicted by the three databases, and take the intersection of the results and differentially expressed mRNAs. The lncRNA‐miRNA‐mRNA interaction network was then obtained and imported into Cytoscape to draw the ceRNA network map.
2.5. Protein–protein interaction network construction
In order to further explore the mechanism of mRNA in the ceRNA network, mRNAs were imported into STRING database, 15 study species was limited to "Homo Sapiens", and connection score was set to >0.4 to obtain the protein interaction relationship. Obtained results were imported into Cytoscape, and "NetworkAnalyzer" was used for visualization to construct a protein‐protein interaction (PPI) network, and "CytoHubba" was used to screen out hub genes according to the degree value.
2.6. Gene enrichment analysis
Gene Ontology (GO) and Kyoto Encyclopedia of Genes and Genomes (KEGG) enrichment analysis were performed with Database for Annotation, Visualization and Integrated Discovery (DAVID) database. 16 Hub genes were imported into DAVID database and study species was limited to "Homo Sapiens." The results of GO and KEGG enrichment analysis were provided by bioinformatics tools on the website. GO enrichment analysis mainly includes three processes: biological process (BP), cellular component (CC), and molecular function (MF). The main pathways of KEGG include metabolism, genetic information processing, environmental information‐related processes, cellular physiological processes, and drug research. p < 0.05 indicates a significant enrichment result. Finally, the data visualization is made with ggplot2 package of R language.
2.7. Key ceRNA networks mining
Correlation information of hub genes was searched in the ceRNA network, lncRNAs and miRNAs that interact with hub genes were mined, and a key lncRNA‐miRNA‐mRNA interaction network was constructed. Besides, key lncRNAs and miRNAs were screened out according to the degree value. Finally, a key ceRNA network diagram was drawn by Cytoscape. In addition, a literature search was conducted for the impact of key signaling axes in the ceRNA network graph on gout formation and development.
3. RESULTS
3.1. Differentially expressed lncRNA and mRNA
Difference analysis was carried out after reannotating the chip by perl and R language. It showed that 388 lncRNAs with significant change were found in gout patient compared with the healthy control, of which 240 lncRNAs were up‐regulated and 148 lncRNAs were down‐regulated; 758 mRNAs with significant change were found, of which 327 mRNAs were up‐regulated and 431 mRNAs were down‐regulated. The 10 with most significant change among the up‐regulated and down‐regulated lncRNAs were selected to draw the heat map, as shown in Figure 1.
FIGURE 1.
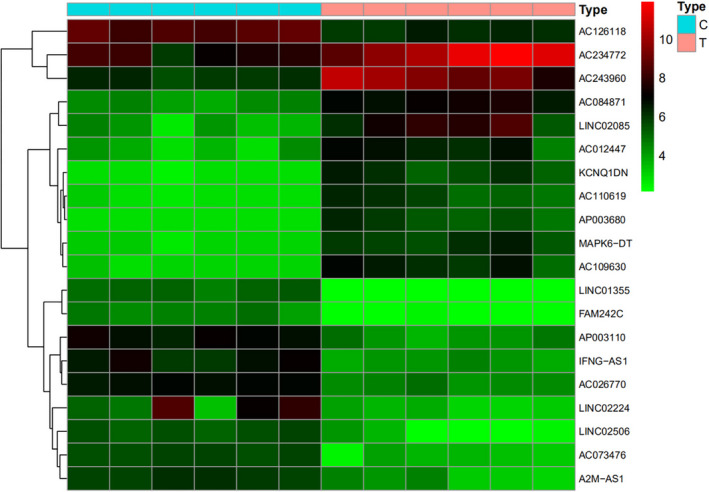
Expression levels of differentially expressed lncRNAs in different samples. Note: The left vertical axis represents the cluster analysis of differentially expressed lncRNAs, and the right vertical axis represents the name of differentially expressed lncRNAs. Red represents high relative expression, and brighter red represents more significant high relative expression. Green represents low relative expression, and brighter green represents more significant low relative expression. Black represents no significant difference in relative expression. At the top, blue represents peripheral blood samples of healthy control and red represents that of gout patients
3.2. ceRNA network
A total of 206 miRNAs and 1269 mRNAs were predicted using databases such as mircode. Predicted mRNAs were intersected with 758 differentially expressed mRNAs, and miRNAs and lncRNAs that were not in the interaction relationship were deleted. An lncRNA‐miRNA‐mRNA network was then obtained. The network was imported into Cytoscape to draw the ceRNA network, as shown in Figure 2. The network includes a total of 181 nodes (93 lncRNA nodes, 29 miRNA nodes, 59 mRNA nodes) and 603 edges.
FIGURE 2.
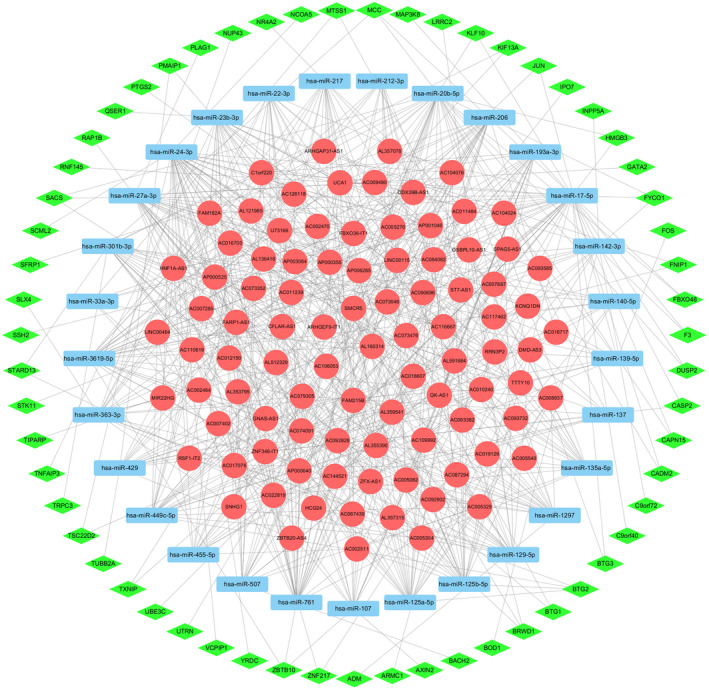
ceRNA regulatory network. Note: Red circle represent lncRNA, green diamond represents mRNA, blue rectangle represents miRNA, and lines between nodes represent the regulatory relationship.
3.3. Investigation of hub genes by PPI network analysis
The PPI network was constructed with STRING database and Cytoscape, as shown in Figure 3. A total of 20 nodes and 33 edges are involved in the graph. According to the degree value, the top five hub genes are screened as JUN, FOS, PTGS2, NR4A2, and TNFAIP3. These hub genes play a key role in the entire network and may be key genes in the development of gout. Basic information is shown in Table 1.
FIGURE 3.
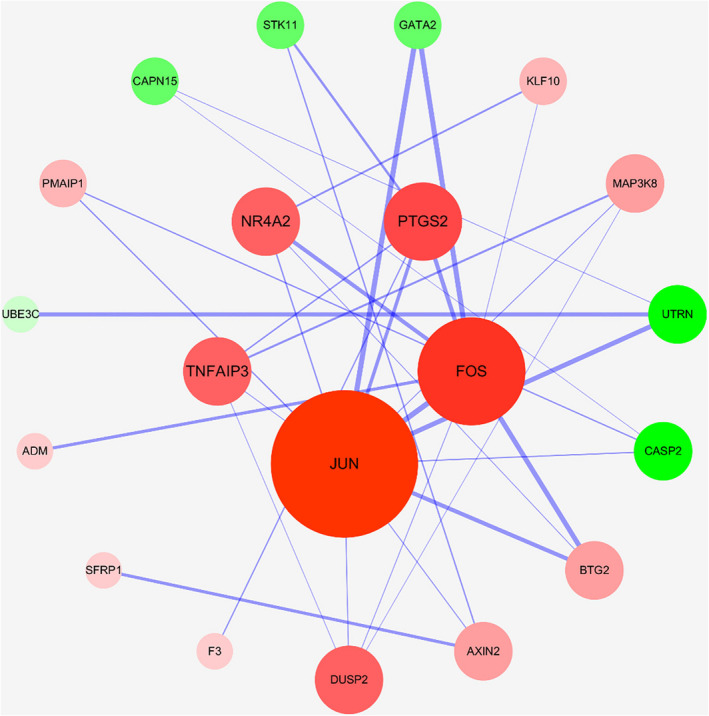
Protein interaction network. Note: Red node represents up‐regulated mRNA, green node represents down‐regulated mRNA, and the line between nodes represents interaction relationship. The larger the node and the darker the color, the greater the degree value. Thickness of the edge reflects the connection score. The thicker the edge, the closer the interaction between mRNAs
TABLE 1.
Basic information of hub genes
| Hub genes | Related description | Degree | Value difference | Trend |
|---|---|---|---|---|
| JUN | Jun Proto‐Oncogene | 12 | 3.63 | Up‐regulate |
| FOS | Fos Proto‐Oncogene | 8 | 1.49 | Up‐regulate |
| PTGS2 | Prostaglandin‐Endoperoxide Synthase 2 | 5 | 2.70 | Up‐regulate |
| NR4A2 | Nuclear Receptor Subfamily 4 Group A Member 2 | 4 | 2.89 | Up‐regulate |
| TNFAIP3 | TNF Alpha Induced Protein 3 | 4 | 2.89 | Up‐regulate |
The expressions of JUN, FOS, PTGS2, NR4A2, and TNFAIP3 in the peripheral blood of gout patients were all higher than those of healthy controls.
3.4. GO and KEGG enrichment analysis
During the GO enrichment analysis of the function of hub genes, 529 items were identified, including 480 BPs, 9 CCs, and 40 MFs. According to the P value, the top 10 enriched BP, CC, and MF are shown in Figure 4A. BP mainly involves in the cell's response to chemical stress, oxidative stress, and external stimuli; CC mainly involves in transcriptional regulatory complex, RNA polymerase II transcriptional regulatory complex, and the outer nuclear membrane; MF mainly involves in DNA‐binding transcription factor binding, R‐ SMAD binding, and type II RNA polymerase activated transcription factor binding. KEGG enrichment analysis of hub genes identified 40 items, mainly involving IL‐17 signaling pathway, TNF signaling pathway, Oxytocin (OXT) signaling pathway, and NF‐κB signaling pathway, as shown in Figure 5A.
FIGURE 4.
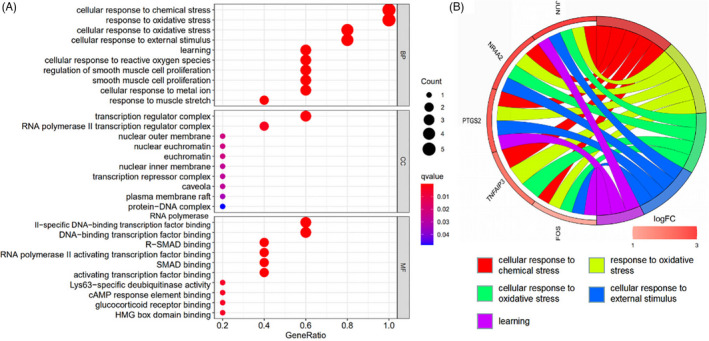
GO enrichment analysis of hub genes bubble diagram (A) and chord diagram (B). Note: (A) The vertical axis represents the name of GO enrichment analysis, and the horizontal axis represents the proportion of enriched genes in total human genes. Redder bubble indicates more significant enrichment and larger bubble indicates more enriched genes in the item. (B) The relationship between the top five GO items and hub genes is represented by chord graph, and the colors of nodes are displayed according to the value of logFC
FIGURE 5.
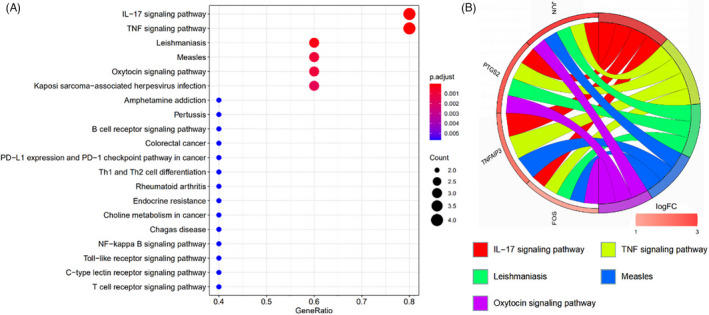
The KEGG enrichment analysis of hub genes bubble diagram (A) and chord diagram (B). Note: (A) The vertical axis represents the pathway name, and the horizontal axis represents the proportion of enriched genes in total human genes. Redder bubble indicates more significant enrichment and larger bubble indicates more enriched genes in the item. (B) The relationship between the top five pathways and hub genes is represented by chord graph, and the colors of nodes are displayed according to the value of logFC
The chord diagrams of the five hub genes were drawn by GOplot package of R language to show the five most significant enrichment pathways of GO and KEGG to visualize a smaller subset of high‐dimensional data, so as to understand their specific mechanisms in the enrichment process, as shown in Figures 4B and 5B.
3.5. Key ceRNA network
LncRNA competes with mRNA in miRNA binding. The hub genes obtained from the PPI network were up‐regulated, and miRNAs (miR‐429, miR‐137, miR‐139‐5p, miR‐217, miR‐23b‐3p) in the interact key ceRNA network were down‐regulated by lncRNA, as shown in Figure 6. Key lncRNAs (SNHG1, FAM182A, SPAG5‐AS1, HNF1A‐AS1, UCA1) in the network were selected through the degree value, as shown in Table 2. Experimental studies on lncRNAs and miRNAs in key ceRNA network were retrieved from databases such as PubMed, and it was found that regulating their expression could affect the body's inflammatory response, osteoclast proliferation and differentiation, chondrocyte apoptosis, and autophagy. The results offer significant guidance in elucidating the formation and development of gout. Detailed information is shown in Table 3.
FIGURE 6.
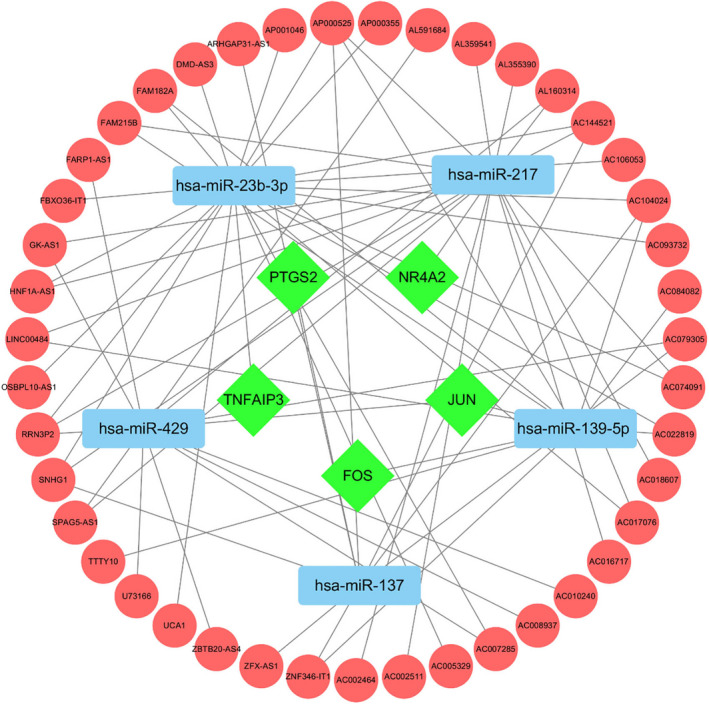
The key ceRNA network that up‐regulates mRNA. Note: Red circle represents lncRNA, green diamond represents mRNA, blue rectangle represents miRNA, and the line between nodes represents the regulatory relationship
TABLE 2.
Basic information of key lncRNA
| lncRNA | Related description | Degree | Signal axis |
|---|---|---|---|
| SNHG1 | Small Nucleolar RNA Host Gene 1 | 3 |
SNHG1/miR−23b−3p/TNFAIP3 SNHG1/miR−217/NR4A2 SNHG1/miR−137/PTGS2 |
| FAM182A | Family With Sequence Similarity 182 Member A | 3 |
FAM182A/miR−23b−3p/TNFAIP3 FAM182A/miR−139‐5p/FOS FAM182A/miR−139‐5p/JUN |
| SPAG5‐AS1 | SPAG5 Antisense RNA 1 | 2 |
SPAG5‐AS1/miR−217/NR4A2 SPAG5‐AS1/miR−429/JUN |
| HNF1A‐AS1 | HNF1A Antisense RNA 1 | 2 |
HNF1A‐AS1/miR−23b−3p/TNFAIP3 HNF1A‐AS1/miR−217/NR4A2 |
| UCA1 | Urothelial Cancer Associated 1 | 1 | UCA1/miR−23b−3p/TNFAIP3 |
SNHG1, FAM182A, SPAG5‐AS1, HNF1A‐AS1, UCA1 can affect the occurrence and development of gout by regulating the miRNA and mRNA that interact with them.
TABLE 3.
The role of some lncRNA/mRNA in gout
| miRNA/lncRNA | Expression | Target molecule and pathway | Result |
|---|---|---|---|
| miR‐429 37 , 39 , 40 | Up‐regulate | JUN,MMP2,MMP9,TNF‐α,NF‐κB signaling pathway | Inhibition of inflammation and osteoclast differentiation |
| lncRNA SNHG1 41 , 42 , 43 | Up‐regulate | miR‐137, TNF‐α, IL‐1β, IL‐6 | Inhibition of inflammation and chondrocyte apoptosis |
| miR‐139‐5p 44 , 45 | Up‐regulate | JUN,FOS | Inhibition of inflammation and osteoclast proliferation and differentiation |
| miR‐23b‐3p 46 , 47 , 48 | Up‐regulate | TNFAIP3, NF‐κB signaling pathway | Promotion of inflammation, cartilage matrix degradation, and chondrocyte apoptosis |
| lncRNA UCA1 49 | Up‐regulate | miR‐23b‐3p | Promotion of autophagy and inhibit cell apoptosis |
lncRNA/miRNA can effectively regulate the body's inflammatory response, the proliferation, differentiation and apoptosis of chondrocytes and osteoclasts, and ultimately affect the formation and development of gout.
4. DISCUSSION
LncRNA is a type of non‐coding ribonucleic acid with more than 200 nucleotides, which has attracted extensive attention in recent medical researches. Previously, it has been reported that lncRNA involves in immune cell development, including dendritic cell differentiation, T‐cell activation, granulocyte differentiation, inhibition of T‐cell proliferation, and Th1 cell differentiation. 17 , 18 , 19 In addition, lncRNA has been considered as a powerful regulator of many genes and pathways in the pathogenesis of inflammation diseases (including osteoarthritis and gouty arthriti) and autoimmune diseases (including psoriasis, rheumatoid arthritis, and systemic lupus erythematosus). 20 , 21 , 22 Though lncRNA research is gaining popularity, research on its role in the pathogenesis of gout has just started. Exploring the role of the lncRNA in gout will offer new insights into the pathogenesis of gout. Therefore, in this study, data were extracted from the GSE160170 chip to construct a lncRNA‐miRNA‐mRNA network based on the ceRNA mechanism, and 240 up‐regulated lncRNAs and 148 down‐regulated lncRNAs between gout patients and healthy control were identified based on bioinformatics analysis to explore the role of lncRNA in the formation and development of gout.
Hub genes in the ceRNA network were screened out and a enrichment analysis was performed to narrow the scope of research and find the key mechanism of gout. Results suggested that hub genes such as JUN, FOS, PTGS2, NR4A2, and TNFAIP3 were all up‐regulated in the serum of gout patients and were mainly enriched in IL‐17, TNF, Oxytocin, and NF‐κB signaling pathways, and its biological processes mainly involved cell‐to‐chemical response to stress, oxidative stress, and external stimulation. Both the regulated hub genes and the biological processes and pathways were closely related to the formation and development of gout. 23 , 24 Oxytocin signaling pathway could be activated under acute/chronic pain stimuli to relieve pain and alleviate cartilage matrix degradation through nerve and body fluid regulation 25 , 26 , 27 ; IL−17 signal existed in Th17 helper cell, and it could stimulate monocytes and macrophages to secrete inflammatory factors, thus aggravate the acute and chronic inflammation induced by MSU crystals. Studies have shown that increasing NR4A2 induced Th17 differentiation, which could up‐regulate IL‐23 receptor expression and increase the secretion of inflammatory factors such as IFN‐γ, IL‐23, and IL‐17 28 , 29 ; TNF pathway mediated eosinophils cells and lymphocytes to accumulate in the inflammation site. When TNF bound to its receptor TNFR, RIP1 could be recruited and subunit IKKγ ubiquitination could be regulated to activate NF‐κB and AP‐1 pathways, thereby inducing sustained inflammation 30 , 31 ; Elevated blood uric acid also activated NF‐κB pathway. When NF‐κB protein was stimulated by blood uric acid, it would be transported to the nucleus, bind with PTGS2 (Cyclooxygenase‐2, COX‐2) promoter region (including NF‐kB site), activate the oxidative stress response, release IL‐1β and other inflammatory factors, and further stimulate the expression of IL‐17 pathway. 32 , 33 , 34 TNFAIP3 had the biological function of deubiquitinase, which could block the interaction between ubiquitin ligase and conjugation enzyme, thereby inhibiting the activation of NF‐κB signaling 35 ; A complex formed by FOS and JUN in the nucleus could bind to the AP‐1 site of the target gene, which would not only activate matrix metalloproteinase (MMP) to destroy cartilage matrix, promote NF‐κB signal to induce osteoclast differentiation and damage bone, but also promote the secretion of inflammatory factors and exacerbate joint inflammation. 36 , 37 , 38 Therefore, the author believes that by acting on the above targets and pathways, the inflammatory factors in the blood can be effectively regulated to inhibit the body's inflammatory response as well as the proliferation, differentiation, and apoptosis of chondrocytes and osteoclasts, thereby alleviating the destruction of articular cartilage to treat gout and its complications (Detailed information is shown in Figure 7).
FIGURE 7.
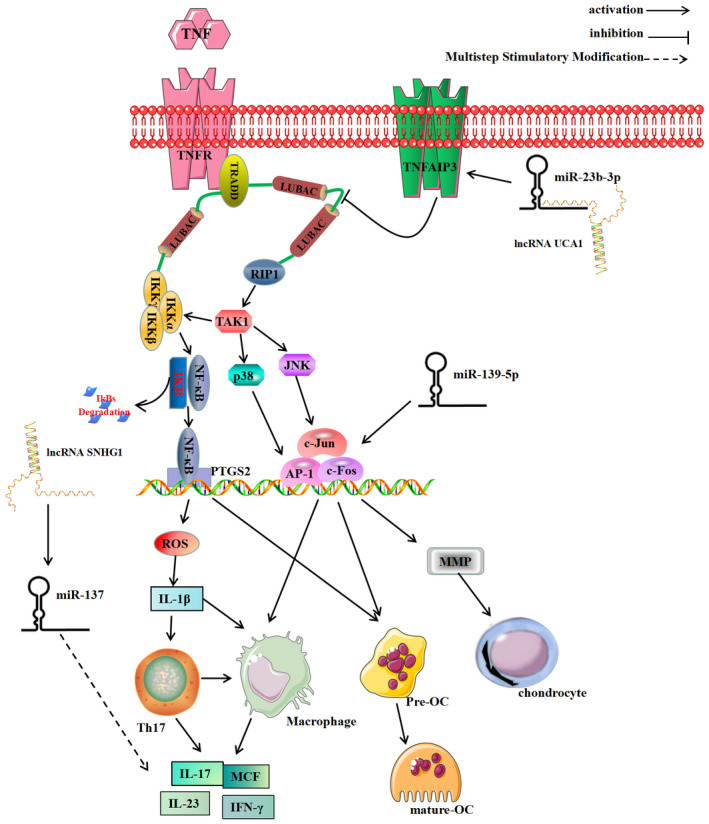
Mechanistic map of hub genes and their enrichment pathways. NOTE: TNF receptor signaling complex (TNF‐RSC) is formed when TNF binds with TNF receptor (TNFR). The receptor‐interacting protein 1 (RIP1) and inhibitor of nuclear factor kappa‐B kinase (IKKα, β, γ) can be recruited and ubiquitinated by TNF‐RSC through linear ubiquitin chain assembly complex (LUBAC). (1) TAK1 is activated by ubiquitination of RIP1, which could further activate IKK, JNK, and p38. Then, NF‐κB and AP‐1 are respectively upregulated by IKK, JNK, and p38. AP‐1 is a transcription gene which is related to chondrocyte degradation, OC differentiation, macrophages, and Th17 cells secrete inflammation factors (IL‐17, IL‐23, etc). (2) NF‐κB binding protein (IKB) can be phosphorylated and cleaved by IKK kinase, which enables NF‐κB to transfer from cytoplasm to nucleus. This process can trigger the transactivation of PTGS2, which can promote the release of ROS‐dependent IL‐1β. The secretion of inflammatory factors in macrophages and TH17 can be promoted by IL‐1β
In order to further explore the correlation information of hub genes in the ceRNA network, this study screened and analyzed miRNA that lncRNA and mRNA competed to bind. According to the key ceRNA network, key miRNAs include miR‐429, miR‐137, miR‐139‐5p, miR‐217, miR‐23b‐3p, and key lncRNAs include SNHG1, FAM182A, SPAG5‐AS1, HNF1A‐AS1, UCA1. These miRNAs and lncRNAs play an important role in affecting the interpretation and expression of hub genes. Recent studies have shown that increasing the expression of miR‐429 reduces the levels of MMP2 and MMP9 and effectively inhibits the induction of IL‐8 by TNF‐α 39 , 40 ; miR‐137 in osteoarthritis exhibits low expression and involves in processes such as the release of TNF‐α, IL‐1β, IL‐6, or chondrocyte apoptosis, 41 , 42 while lncRNA SNHG1 can negatively regulate the expression of miR‐137 and participate in gene expression regulation of the above‐mentioned molecules. 43 miR‐139‐5p can directly target JUN or FOS to achieve the effect of inhibiting AP‐1 activity, thereby inhibiting cell proliferation, inflammation, migration, and invasion. 44 , 45 miR‐23b‐3p is involved in the regulation of cartilage matrix degradation and chondrocyte apoptosis, which can target TNFAIP3 to regulate NF‐κB Signal pathway, thus enhancing the inflammatory response of macrophages. 46 , 47 , 48 Xian Z et al. found that lncRNA UCA1 can reduce the level of miR‐23b‐3p and affect the expression of target genes by adsorbing miR‐23b‐3p. 49
Therefore, through regulating the signal axis mediated by key lncRNAs, inflammatory response, the proliferation, differentiation, and apoptosis of chondrocytes and osteoclasts can be regulated to control the formation and development of gout. Moreover, the screening of these specific index proteins can provide reliable detection indexes for further research on clinical or animal gout experiments, which can effectively shorten the experimental period and reduce the experimental cost. Clarifying the interaction between lncRNA‐miRNA‐mRNA and the function mechanism of lncRNA in gout is still the focus of future research.
5. CONCLUSION
In conclusion, this study explored possible pathogenic mechanism related to the formation and development of gout by constructing the ceRNA network of gout, and provided a reference and direction for further research on the regulatory relationship between gout genes that were expected to become diagnosis markers and therapeutic targets in the future.
6. LIMITATIONS
This study has some limitations. On the one hand, only GSE160170 contains high‐throughput data for gout in GEO database. Beside, we did not search other databases for high‐throughput data on gout because most of the current databases, such as TCGA and Oncomine, mainly provide microarray data for cancer‐related research. Therefore, we will perform additional high‐throughput sequencing of gout in the future. On the other hand, results are only partially verified in the query literature and the rest of them still lack experimental verification, thus further molecular biology experiments will be conducted in the follow‐up work to verify gene functions at the cell or sample level.
7. CONSENT FOR PUBLICATION
Patient provided consent for publication of the data and images.
AUTHOR CONTRIBUTIONS
Feng Chen and Huanan Li designed the study. Xiaoyun Zhang and Yuan Chai helped to analyze the data. Xiao Jiang and Yueping Chen prepared the manuscript. All authors were responsible for critical revisions, and all authors read and approved the final version of this work.
ACKNOWLEDGEMENTS
We thank the technical assistance of Technology and funding in the Ruikang Hospital Affiliated to Guangxi University of Traditional Chinese Medicine and The Second Hospital of Dalian Medical University, and Affiliated Hospital of Jiangxi University of Chinese Medicine.
Chen F, Zhang X, Chen Y, Chai Y, Jiang X, Li H. Construction of lncRNA‐miRNA‐mRNA network based on ceRNA mechanism reveals the function of lncRNA in the pathogenesis of gout. J Clin Lab Anal. 2022;36:e24451. doi: 10.1002/jcla.24451
Funding information
This study was funded by the National Natural Science Foundation of China, Grant/Award Number: 81860857 and 82060871; Jiangxi Natural Science Foundation (No.20202BAB206071); Jiangxi University of Chinese Medicine Science and Technology Innovation Team Development Program
Contributor Information
Feng Chen, Email: cf609226271@126.com.
Xiaoyun Zhang, Email: zhangxiaoyun520@126.com.
Yueping Chen, Email: chenyueping0007@126.com.
Yuan Chai, Email: chaizxy@163.com.
Xiao Jiang, Email: doctorjx0726@163.com.
Huanan Li, Email: lihuanan1974@126.com.
DATA AVAILABILITY STATEMENT
The data used to support the findings of this study are available from the corresponding author upon request.
REFERENCES
- 1. Su HY, Yang C, Liang D, et al. Research advances in the mechanisms of hyperuricemia‐induced renal injury. Biomed Res Int. 2020;2020:5817348. [DOI] [PMC free article] [PubMed] [Google Scholar]
- 2. Tang YM, Zhang L, Zhu SZ, et al. Gout in China, 1990–2017: the Global Burden of Disease Study 2017. Public Health. 2021;191:33‐38. [DOI] [PubMed] [Google Scholar]
- 3. Dalbeth N, Choi HK, Joosten LAB, et al. Gout. Nat Rev Dis Primers. 2019;5(1):69. [DOI] [PubMed] [Google Scholar]
- 4. Min HK, Kim HR. Does normouricemic status in acute gouty arthritis really reflect a normal status? Consider confounders of serum levels of urate. Korean J Intern Med. 2020;35(1):62‐64. [DOI] [PMC free article] [PubMed] [Google Scholar]
- 5. Williams LA. The history, symptoms, causes, risk factors, types, diagnosis, treatments, and prevention of gout, part 2. Int J Pharm Compd. 2019;23(1):14‐21. [PubMed] [Google Scholar]
- 6. Tsagakis I, Douka K, Birds I, et al. Long non‐coding RNAs in development and disease: conservation to mechanisms. J Pathol. 2020;250(5):480‐495. [DOI] [PMC free article] [PubMed] [Google Scholar]
- 7. Qing YF, Zheng JX, Tang YP, et al. LncRNAs Landscape in the patients of primary gout by microarray analysis. PLoS One. 2021;16(2):e0232918. [DOI] [PMC free article] [PubMed] [Google Scholar]
- 8. Lee CP, Huang YN, Nithiyanantham S, et al. LncRNA‐Jak3:Jak3 coexpressed pattern regulates monosodium urate crystal‐induced osteoclast differentiation through Nfatc1/Ctsk expression. Environ Toxicol. 2019;34(2):179‐187. [DOI] [PubMed] [Google Scholar]
- 9. Liu YF, Xing GL, Chen Z, et al. Long non‐coding RNA HOTAIR knockdown alleviates gouty arthritis through miR‐20b upregulation and NLRP3 downregulation. Cell Cycle. 2021;20(3):332‐344. [DOI] [PMC free article] [PubMed] [Google Scholar]
- 10. Clough E, Barrett T. The gene expression omnibus database. Methods Mol Biol. 2016;1418:93‐110. [DOI] [PMC free article] [PubMed] [Google Scholar]
- 11. Pearson WR. Finding protein and nucleotide similarities with FASTA. Curr Protoc Bioinformatics. 2016;53:3.9.1–3.9.25. [DOI] [PMC free article] [PubMed] [Google Scholar]
- 12. Huang HY, Lin YC, Li J, et al. miRTarBase 2020: updates to the experimentally validated microRNA‐target interaction database. Nucleic Acids Res. 2020;48(D1):D148‐D154. [DOI] [PMC free article] [PubMed] [Google Scholar]
- 13. Agarwal V, Bell GW, Nam JW, et al. Predicting effective microRNA target sites in mammalian mRNAs. Elife. 2015;4:e05005. [DOI] [PMC free article] [PubMed] [Google Scholar]
- 14. Chen Y, Wang X. miRDB: an online database for prediction of functional microRNA targets. Nucleic Acids Res. 2020;48(D1):D127‐D131. [DOI] [PMC free article] [PubMed] [Google Scholar]
- 15. Szklarczyk D, Gable AL, Lyon D, et al. STRING v11: protein‐protein association networks with increased coverage, supporting functional discovery in genome‐wide experimental datasets. Nucleic Acids Res. 2019;47(D1):D607‐D613. [DOI] [PMC free article] [PubMed] [Google Scholar]
- 16. Feng H, Gu ZY, Li Q, et al. Identification of significant genes with poor prognosis in ovarian cancer via bioinformatical analysis. J Ovarian Res. 2019;12(1):35. [DOI] [PMC free article] [PubMed] [Google Scholar]
- 17. Xu F, Jin L, Jin Y, et al. Long noncoding RNAs in autoimmune diseases. J Biomed Mater Res A. 2019;107(2):468‐475. [DOI] [PubMed] [Google Scholar]
- 18. Ahmad I, Valverde A, Ahmad F, et al. Long noncoding RNA in myeloid and lymphoid cell differentiation, polarization and function. Cells. 2020;9(2):269. [DOI] [PMC free article] [PubMed] [Google Scholar]
- 19. Chen YG, Satpathy AT, Chang HY. Gene regulation in the immune system by long noncoding RNAs. Nat Immunol. 2017;18(9):962‐972. [DOI] [PMC free article] [PubMed] [Google Scholar]
- 20. Miao C, Bai L, Yang Y, et al. Dysregulation of lncRNAs in rheumatoid arthritis: biomarkers, pathogenesis and potential therapeutic targets. Front Pharmacol. 2021;12:652751. [DOI] [PMC free article] [PubMed] [Google Scholar]
- 21. Zhang X, Zou Y, Zheng J, et al. lncRNA‐MM2P downregulates the production of pro‐inflammatory cytokines in acute gouty arthritis. Mol Med Rep. 2020;22(3):2227‐2234. [DOI] [PMC free article] [PubMed] [Google Scholar]
- 22. Yi R, Yang L, Zeng S, et al. Different expression profile of mRNA and long noncoding RNA in autoimmune thyroid diseases patients. J Cell Biochem. 2019;120(12):19442‐19456. [DOI] [PubMed] [Google Scholar]
- 23. Yu W, Cheng JD. Uric acid and cardiovascular disease: an update from molecular mechanism to clinical perspective. Front Pharmacol. 2020;11:582680. [DOI] [PMC free article] [PubMed] [Google Scholar]
- 24. Furuhashi M. New insights into purine metabolism in metabolic diseases: role of xanthine oxidoreductase activity. Am J Physiol Endocrinol Metab. 2020;319(5):E827‐E834. [DOI] [PubMed] [Google Scholar]
- 25. Lussier D, Cruz‐Almeida Y, Ebner NC. Musculoskeletal pain and brain morphology: oxytocin's potential as a treatment for chronic pain in aging. Front Aging Neurosci. 2019;11:338. [DOI] [PMC free article] [PubMed] [Google Scholar]
- 26. Matsuura T, Motojima Y, Kawasaki M.,, et al. [Relationship Between Oxytocin and Pain Modulation and Inflammation]. J UOEH. 2016;38(4):325‐334. [DOI] [PubMed] [Google Scholar]
- 27. Wu Y, Wu T, Xu B, et al. Oxytocin prevents cartilage matrix destruction via regulating matrix metalloproteinases. Biochem Biophys Res Commun. 2017;486(3):601‐606. [DOI] [PubMed] [Google Scholar]
- 28. Crean D, Murphy EP. Targeting NR4A nuclear receptors to control stromal cell inflammation, metabolism, angiogenesis, and tumorigenesis. Front Cell Dev Biol. 2021;9:589770. [DOI] [PMC free article] [PubMed] [Google Scholar]
- 29. Raucci F, Iqbal AJ, Saviano A, et al. In‐depth immunophenotyping data relating to IL‐17Ab modulation of circulating Treg/Th17 cells and of in situ infiltrated inflammatory monocytes in the onset of gouty inflammation. Data Brief. 2019;25:104381. [DOI] [PMC free article] [PubMed] [Google Scholar]
- 30. Haugen J, Chandyo RK, Brokstad KA, et al. Cytokine concentrations in plasma from children with severe and non‐severe community acquired pneumonia. PLoS One. 2015;10(9):e0138978. [DOI] [PMC free article] [PubMed] [Google Scholar]
- 31. Chu WM. Tumor necrosis factor. Cancer Lett. 2013;328(2):222‐225. [DOI] [PMC free article] [PubMed] [Google Scholar]
- 32. Mao X, Su Z, Mookhtiar AK. Long non‐coding RNA: a versatile regulator of the nuclear factor‐κB signalling circuit. Immunology. 2017;150(4):379‐388. [DOI] [PMC free article] [PubMed] [Google Scholar]
- 33. Ruiz‐Miyazawa KW, Staurengo‐Ferrari L, Pinho‐Ribeiro FA, et al. 15d‐PGJ2‐loaded nanocapsules ameliorate experimental gout arthritis by reducing pain and inflammation in a PPAR‐gamma‐sensitive manner in mice. Sci Rep. 2018;8(1):13979. [DOI] [PMC free article] [PubMed] [Google Scholar]
- 34. Sandoughi M, Saravani M, Rokni M, et al. Association between COX‐2 and 15‐PGDH polymorphisms and SLE susceptibility. Int J Rheum Dis. 2020;23(5):627‐632. [DOI] [PubMed] [Google Scholar]
- 35. Kim SW, Ramasamy K, Bouamar H, et al. MicroRNAs miR‐125a and miR‐125b constitutively activate the NF‐κB pathway by targeting the tumor necrosis factor alpha‐induced protein 3 (TNFAIP3, A20). Proc Natl Acad Sci U S A. 2012;109(20):7865‐7870. [DOI] [PMC free article] [PubMed] [Google Scholar]
- 36. Huber R, Augsten S, Kirsten H, et al. Identification of new, functionally relevant mutations in the coding regions of the human Fos and Jun Proto‐Oncogenes in rheumatoid arthritis synovial tissue. Life (Basel). 2020;11(1):5. [DOI] [PMC free article] [PubMed] [Google Scholar]
- 37. Hannemann N, Jordan J, Paul S, et al. The AP‐1 transcription factor c‐Jun promotes arthritis by regulating cyclooxygenase‐2 and arginase‐1 expression in macrophages. J Immunol. 2017;198(9):3605‐3614. [DOI] [PubMed] [Google Scholar]
- 38. Gul A, Kunwar B, Mazhar M, et al. N‐(2‐Hydroxyphenyl)acetamide: a novel suppressor of RANK/RANKL pathway in collagen‐induced arthritis model in rats. Inflammation. 2017;40(4):1177‐1190. [DOI] [PubMed] [Google Scholar]
- 39. Zhang C, Chang C, Gao H, et al. MiR‐429 regulates rat liver regeneration and hepatocyte proliferation by targeting JUN/MYC/BCL2/CCND1 signaling pathway. Cell Signal. 2018;50:80‐89. [DOI] [PubMed] [Google Scholar]
- 40. Kawasaki H, Amano H. Anti‐inflammatory role of microRNA‐429 in human gingival epithelial cells‐inhibition of IL‐8 production through direct binding to IKKβ mRNA. Mol Med Rep. 2021;24(2):581. [DOI] [PMC free article] [PubMed] [Google Scholar]
- 41. Gao ST, Yu YM, Wan LP, et al. LncRNA GAS5 induces chondrocyte apoptosis by down‐regulating miR‐137. Eur Rev Med Pharmacol Sci. 2020;24(21):10984‐10991. [DOI] [PubMed] [Google Scholar]
- 42. Wang J, Fang L, Ye L, et al. miR‐137 targets the inhibition of TCF4 to reverse the progression of osteoarthritis through the AMPK/NF‐κB signaling pathway. Biosci Rep. 2020;40(6):BSR20200466. [DOI] [PMC free article] [PubMed] [Google Scholar]
- 43. Zhao S, Wang Y, Luo M, et al. Long noncoding RNA Small Nucleolar RNA Host Gene 1 (SNHG1) promotes renal cell carcinoma progression and metastasis by negatively regulating miR‐137. Med Sci Monit. 2018;24:3824‐3831. [DOI] [PMC free article] [PubMed] [Google Scholar]
- 44. Luo YF, Wan XX, Zhao LL, et al. MicroRNA‐139‐5p upregulation is associated with diabetic endothelial cell dysfunction by targeting c‐jun. Aging (Albany NY). 2020;13(1):1186‐1211. [DOI] [PMC free article] [PubMed] [Google Scholar]
- 45. Du F, Cao T, Xie H, et al. KRAS Mutation‐Responsive miR‐139‐5p inhibits colorectal cancer progression and is repressed by Wnt signaling. Theranostics. 2020;10(16):7335‐7350. [DOI] [PMC free article] [PubMed] [Google Scholar]
- 46. Guo Y, Min Z, Jiang C, et al. Downregulation of HS6ST2 by miR‐23b‐3p enhances matrix degradation through p38 MAPK pathway in osteoarthritis. Cell Death Dis. 2018;9(6):699. [DOI] [PMC free article] [PubMed] [Google Scholar]
- 47. Yang Q, Zhou Y, Cai P, et al. Downregulation of microRNA‐23b‐3p alleviates IL‐1β‐induced injury in chondrogenic CHON‐001 cells. Drug Des Devel Ther. 2019;13:2503‐2512. [DOI] [PMC free article] [PubMed] [Google Scholar]
- 48. He LP, Zhao XS, He LP. Abnormally expressed miR‐23b in Chinese Mongolian at high cardiovascular risk may contribute to monocyte/macrophage inflammatory reaction in atherosclerosis. Biosci Rep. 2018;38(6):BSR20180673. [DOI] [PMC free article] [PubMed] [Google Scholar]
- 49. Xian Z, Hu B, Wang T, et al. lncRNA UCA1 contributes to 5‐fluorouracil resistance of colorectal cancer cells through miR‐23b‐3p/ZNF281 axis. Onco Targets Ther. 2020;13:7571‐7583. [DOI] [PMC free article] [PubMed] [Google Scholar]
Associated Data
This section collects any data citations, data availability statements, or supplementary materials included in this article.
Data Availability Statement
The data used to support the findings of this study are available from the corresponding author upon request.


