

Abstract
Background
In order to ensure the accuracy of the product, we established 1st model of metrological traceability hierarchy for light‐initiated chemiluminescent assay (LICA) of 17β‐estradiol (E2) at the manufacturer, based on International Organization for Standardization (ISO) 17511:2020. Moreover, we verified/validated the basic performance (such as matrix effect and long‐term stability of end‐user IVD MD calibrator, precision, linearity interval, accuracy/ trueness, and detection capability) at the clinical end‐user.
Methods
Human serum samples were used in this study. E2 was detected by mass spectrometry (MS) and LICA. The metrological traceability of LICA for E2 was established according to ISO 17511: 2020 standards, and pools of human samples were used as the m.3. secondary calibrator. Precision was validated according to Clinical and Laboratory Standards Institute (CLSI) EP05‐A3. The linear interval was verified according to CLSI EP06‐ED2. Comparison of accuracy and trueness of E2 with MS and Roche according to CLSI EP09‐A3. The detection capability was validated according to EP17‐A2. Matrix effect and long‐term stability evaluation of end‐user IVD MD calibrator were carried out according to CLSI EP14‐A2, EP25‐A. Statistical software was used for data analyses.
Results
The use of pools of human samples and fine adjusting calibrators ensured the accuracy of end‐user test results. The metrological traceability of LICA for E2 was established. It showed excellent precision, meeting the requirements of allowable imprecision (7.5%). The allowable deviation from linearity (ADL) of 5% was allowed to show a good linear interval (12.52–4167.25 pg/ml). The accuracy/ trueness was verified, and relative deviation in the medical decision level met the performance specification of 10.03% compared with MS or Roche. The validated limit of blank, limit of detection, and limit of quantitation of E2 were 4.95 pg/ml, 8.93 pg/ml, and 9.88 pg/ml, respectively (the allowed imprecision is 20.00%). The interference rate of E2 ranged from −5.5% to 6.6%.
Conclusion
LICA showed high sensitivity, high specificity, excellent precision, wide linearity interval, IVD MD calibrator has long‐term stability, and no matrix effect. The metrological traceability of E2 established by using pools of human samples as M.3. can deliver accuracy to the end‐user IVD MD and show good consistency with MS and Roche.
Keywords: 17β‐estradiol, metrological traceability, performance evaluation
Light‐initiated chemiluminescent assay of 17β‐estradiol metrological traceability system established by manufacturer according to ISO17511:2020. In addition, in order to ensure that the clinical sample results can be correctly traced to a primary RM and RMP, this study explored a new approach to correct calibrator bias.
1. INTRODUCTION
17β‐estradiol (E2) is one of the most biologically active estrogens. In females, E2 is mainly synthesized by the ovaries, while in males, it is mainly produced by the adrenal cortex and testicles. E2 is a fat‐soluble molecule. Most of E2 secreted into the blood is bound to serum albumin and sex hormone‐binding globulin. E2 in the bound state is physiologically inert and shows no biological activity. The small amount of E2 in the free state can enter the target cells and combine with corresponding receptors to exert its biological effects. 1 In clinical settings, assessment of E2 level plays an important role in the evaluation of ovarian function, ovarian hyperstimulation syndrome, and in the auxiliary diagnosis and treatment of precocious puberty. 2
Light‐initiated chemiluminescent assay (LICA) is a homogeneous quantitative immunoassay technology developed in recent years. Light‐induced chemiluminescence is a homogeneous immunoassay which integrates various cutting‐edge technological advances, such as use of nanoparticle polymers, light‐initiated chemiluminescent signaling technology, and the unique wash‐free immunoassay technique. Previous studies have shown good repeatability and intermediate imprecision of LICA in detecting total testosterone and thyroid‐stimulating hormone. 3 , 4
In this study, the manufacturer of Chemclin established LICA metrological traceability system using pools of human samples according to ISO17511:2020 in order to ensure the accuracy, and evaluated the accuracy of assignment of end‐user in vitro diagnostic medical device (IVD MD) calibrator. Moreover, as a clinical end‐user, clinical laboratory verified/validated the performance characteristics of the LICA for the quantitative determination of E2.
2. MATERIAL AND METHODS
2.1. Apparatus and reagents
Anonymized routine human serum samples were used in this study after clinical chemistry testing had been completed. The Ethical Committee of the Second Affiliated Hospital of Guangzhou University of Chinese Medicine approved the study. All the tests were carried out using the LICA 800 (China) and reagent of lot 2101.
2.2. Establishment of mass spectrometry system by NCCL
The reference material used for calibration was a Joint Committee for Traceability in Laboratory Medicine (JCTLM) list certified reference material NMIJ CRM 6004‐a (Assigned Value 0.984 kg/kg, Expanded Uncertainty 0.003 kg/kg), provided by the National Metrology Institute of Japan. The internal standard solution was 17β‐[16,16,17‐d3]estradiol (Isotope abundance >99%), purchased from CDN Isotopes (Québec, Canada).
The panel used in this study comprised of 27 de‐identified pools of residual fresh frozen human serum samples (stored at −70°C) which were collected from 137 apparently healthy individuals who came for routine health examination at the Second Affiliated Hospital of Guangzhou University of Chinese Medicine.
ISO 17511: 2020 is the second edition which supersedes the first edition (ISO 17511: 2003). One of the changes in the second edition is that the final reported values on human samples are required to be metrologically traceable to the highest order reference material, and the title and scope have been modified to include metrological traceability of values assigned to human samples. 5 The 27 serum human samples and 3 end‐user IVD MD calibrators detected by mass spectrometry above were used in the metrological traceability system as the pool of human samples to ensure accuracy of delivery.
The value assigned of serum human samples and calibrators was independently completed by the National Center for Clinical Laboratories (NCCL, China) in accordance with the CDC ID LC‐MS/MS reference measurement procedure for total 17β‐estradiol, which are listed as the JCTLM reference measurement procedure.
2.3. Establishment of metrological traceability system by manufacturer
E2 has the reference measurement procedure (RMP) and primary reference material (RM), with full metrological traceability to the SI. Manufacturer can establish the 1st model metrological traceability hierarchy according to ISO17511:2020. The establishment of E2 metrological traceability system in this study was based on the use of pools of human samples as m.3. secondary calibrator.
In the process of metrological traceability, methodological comparison was carried out by using the m.3. secondary calibrator. When the comparison meets the performance specification, the accuracy of the m.1.‐certified primary reference material is delivered to the measurement system of the next level, and the calibrator of the measurement system is assigned a value.
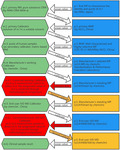
In this study, 30 E2 samples (27 clinical serum pools and 3 end‐user IVD MD calibrators) were detected using the MS as the RMP. The metrological traceability and values assigned process of end‐user IVD MD calibrator are shown in Figure 1.
FIGURE 1.
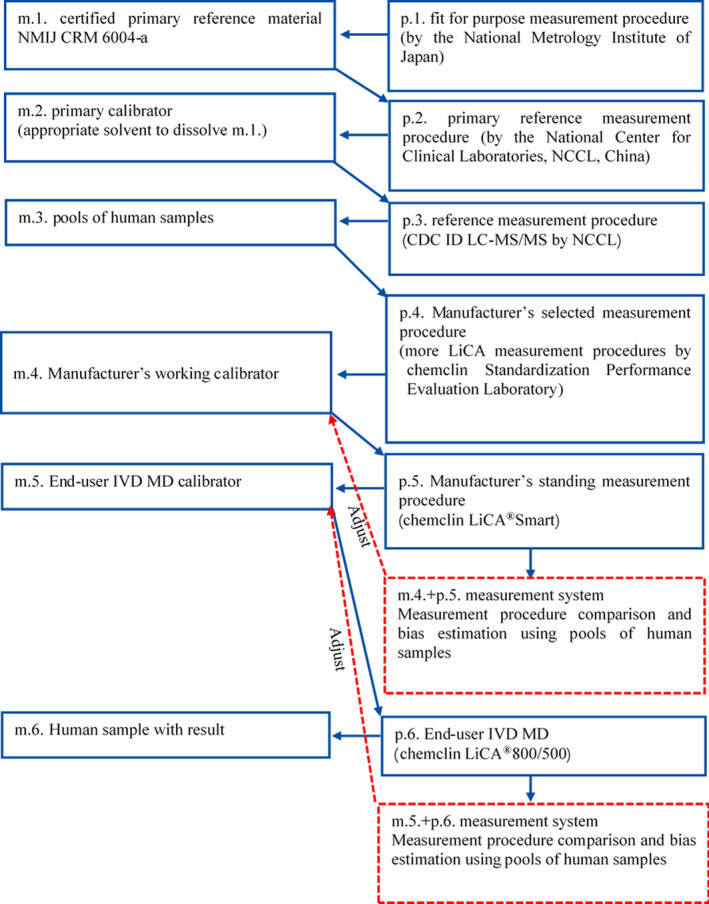
Metrological traceability and values assigned process of End‐user IVD MD calibrator
Serum human samples as M.3. and end‐user IVD MD calibrators need to calculate the uncertainty, consider samples with similar concentration, and adopts the same relative standard uncertainty. The relative standard uncertainty (UA, ref) of Class A is established in this study. This study will evaluate the uncertainty introduced by homogeneity, long‐term stability, and value assignment process of this panel. The relative standard uncertainty (UB, ref) of Class B is derived from certified reference material statements.
2.4. Performance evaluation by Clinical End‐user
2.4.1. Matrix effect and long‐term stability evaluation of end‐user IVD MD calibrator
The End‐user IVD MD calibrator of Chemclin E2 is formulated based on hormone‐free serum, it is a processed preparation and needs to be evaluated for its matrix effect. Matrix effect was evaluated according to CLSI EP14‐A2. The comparative measurement procedure (MP) was MS, and the evaluated MP was Chemclin LiCA®800. Twenty clinical samples and the End‐user IVD MD calibrators were detected simultaneously by the two MPs.
Stability was assessed according to CLSI document EP25‐A. Manufacturer's Working Calibrator and Manufacturer's standing MP were used to build measurement system to detect the stability of signal values of end‐user IVD MD calibrator and to calibrate it according to the calibration cycle. In the first four months, measurements were monitored every month. Subsequently, the signal values were monitored once every 2–3 months.
2.4.2. Precision study
Precision was validated based on the single‐site precision assessment scheme of CLSI EP05‐A3. Assays were performed in multiple samples on 20 days (not necessarily consecutive), with two runs per day, and two replicates per run (20 × 2 × 2 design).
2.4.3. Linearity interval study
Linearity interval was verified based on CLSI EP06‐ED2. Samples with Upper limit of the linearity interval and Lower limit of the linearity interval were collected as high value (H) and low value (L) samples. Proportional mixing of H and L samples was performed. Relative Concentrations (RC) were 1.0, 0.9, 0.8, 0.7, 0.6, 0.5, 0.4, 0.3, 0.2, 0.1, and 0. Each mixed sample was tested repeatedly for 4 replicates.
2.4.4. Accuracy/Trueness study
Accuracy/Trueness was evaluated according to CLSI EP09‐A3. The samples were repeatedly tested with the evaluated MP Chemclin for 3 times, and the results compared with those of the comparative MP MS and Roche E601. The bias at the medical decision level was required to be at least less than or equal to the performance specification.
2.4.5. Detection capability validation study
The performance of detection capability was validated according to EP17‐A2. Limit of blank (LoB) was calculated by nonparametric statistical approach. Limit of detection (LoD) was calculated by parametric statistical approach. The precision profile approach was used to calculate limit of quantitation (LoQ).
2.4.6. Interference study
The interference was verified according to EP07‐A2. Interference was evaluated with three serum samples by adding bilirubin, hemoglobin, and triglyceride at different concentrations. The interference rates for E2 in these samples were calculated from the concentrations of E2 determined before and after addition of the interfering substances.
2.5. Statistical analysis
Curve estimation and linear regression analysis were performed using SPSS 25.0. MedCalc 13.3.3 was used to carry out outlier test, Bland‐Altman analysis, and Passing‐Bablok regression model establishment. Minitab 17.0 was used to perform stability evaluation. Excel and Origin Pro 9.1 were used to draw the confidence intervals of deviation from linearity and matrix effect analysis diagram.
3. RESULTS
3.1. Establishment of the metrological traceability system by manufacturer
3.1.1. Establishment of traceable serum panel
E2 was determined by LC‐MS/MS, and stable isotope d3‐labeled estradiol was added to 27 serum human samples and 3 end‐user IVD MD calibrators were used as the internal standard, and detected by MS. The combined relative uncertainty of the serum human samples was 3.1%–4.8%, and of the end‐user IVD MD calibrators was 2.8%–3.9% (Appendix 1).
3.1.2. Fine adjustment of end‐user IVD MD calibrator
Chemclin E2 End‐user IVD MD calibrator and End‐user IVD MD LiCA®800 were used for measurement system, and 27 human serum samples (assigned value by MS) were detected. According to performance specification of the Royal College of Pathologists of Australasia Quality Assurance Programs (RCPAQAP), 5 samples with detection results <26.8 pg/ml, 1 sample greater than the upper limit of linear range were deleted, and the remaining 21 serum samples were included in the analysis.
For samples ≥26.8 pg/ml, the allowable bias was 10.03%. The required limit of agreement (LoA) is within ±20%. Bland‐Altman plots were drawn before and after fine adjustment with the End‐user IVD MD calibrator. Results before fine adjustment were adjusted by m.3. six secondary calibrators rather than pools of human samples. Results after fine adjustment were adjusted by m.3. pools of human samples.
After fine adjustment end‐user IVD MD calibrator, the medicine decision level of bias was −2.63%–4.14%; the bias after fine adjustment was much less than that before adjustment (−16.84%–12.73%). In addition, LoA after fine adjustment (−18.9%–19.5%) was better than that before adjustment (−35.6%–40.5%) (Figure 2, Table 1).
FIGURE 2.
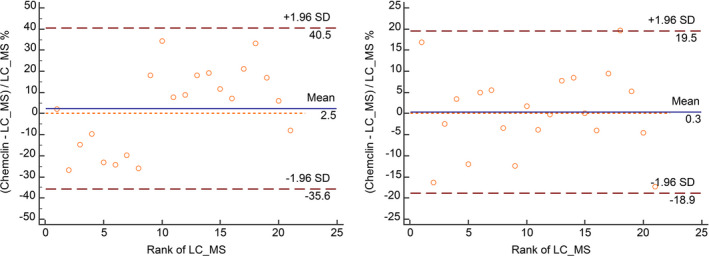
Bland‐Altman plots with the vertical axis as proportional difference (left is before fine adjustment End‐user IVD MD calibrator; right panel is after fine adjustment End‐user IVD MD calibrator). Note: X‐axis is the rank of LC‐MS; Y‐axis is the relative deviation of chemclin and LC‐MS
TABLE 1.
Summary table of bias at the medicine decision level
| Medicine decision level (pg/ml) | Before fine adjustment | After fine adjustment | ||||
|---|---|---|---|---|---|---|
| Estimated value (pg/ml) | Bias (%) | 95 CI (%) | Estimated value (pg/ml) (pg/ml) | Bias (%) | 95 CI (%) | |
| 50 | 42.23 | −16.84 | −50.31–13.42 | 48.70 | −2.63 | −14.68–8.61 |
| 100 | 99.80 | −0.20 | −11.98–13.14 | 100.99 | 0.99 | −5.36–5.76 |
| 500 | 560.32 | 11.38 | 4.24–17.65 | 519.34 | 3.80 | −3.72–8.20 |
| 1000 | 1135.97 | 12.73 | 5.24–18.71 | 1042.28 | 4.14 | −3.88–8.79 |
3.2. Clinical end‐user performance evaluation
3.2.1. Matrix effect of end‐user IVD MD calibrator
A total of 21 serum samples and 3 end‐user IVD MD calibrators were detected by the comparative MP MS (X) and the evaluated MP Chemclin (Y). The multiple regression equation of the 21 samples was Y = 1.049X‐3.007 (Figure 3). The predicted value and the predicted confidence intervals were calculated by inserting 3 end‐user IVD MD calibrators into the equation. No matrix effect was found in all 3 end‐user IVD MD calibrators (Table 2).
FIGURE 3.
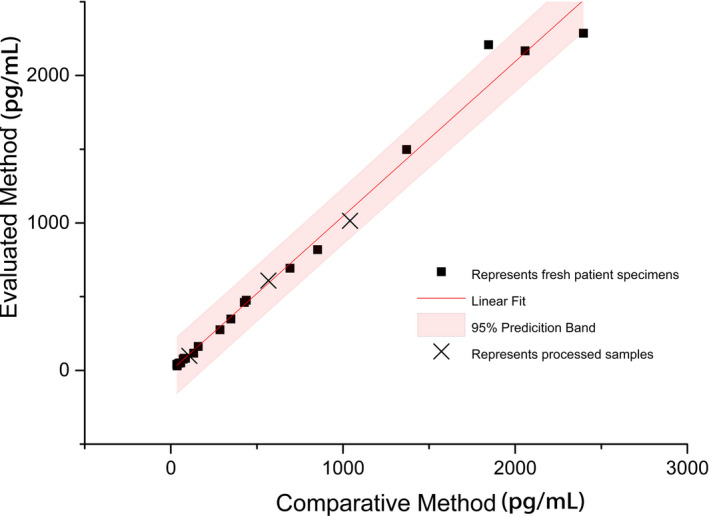
Matrix effect multiple regression equation. Note: X‐axis is the detection result of LC‐MS; Y‐axis is the detection result of chemclin
TABLE 2.
Matrix effect assessment of end‐user IVD MD calibrators (pg/ml)
| Sample | Mean () | Mean () |
|
95% CI Upper limit | 95% CI Lower limit | Result | |
|---|---|---|---|---|---|---|---|
| Preparation1 | 107.35 | 98.96 | 109.61 | 331.82 | −112.61 | No matrix effect | |
| Preparation2 | 566.54 | 609.22 | 591.30 | 811.37 | 371.22 | No matrix effect | |
| Preparation3 | 1040.80 | 1015.35 | 1088.79 | 1311.03 | 866.55 | No matrix effect |
Mean is mean of MS values; Mean is mean of Chemclin values; and is expected value; 95% CI refers to 95% confidence interval of .
3.2.2. Long‐term stability evaluation of end‐user IVD MD calibrator
The long‐term stability of end‐user IVD MD calibrator was monitored for 432 days, and the allowable drift of the measurement was set to 10.03%.
The CAL3 signal value was p value <0.05 (Table 3). The slope was negative. The lower limit of allowable bias of CAL3 was 6635.29RLU (signal value of day 0 × 89.97%), which was substituted into the equation Y = 7271–1.11X (X was the day), and the stable period was 386 days (Figure 4).
TABLE 3.
Monitoring of the stability of product calibration signal value (RLU)
| Day | CAL1 | CAL2 | CAL3 | CAL4 | CAL5 | CAL6 |
|---|---|---|---|---|---|---|
| 0 | 72076 | 24547 | 7375 | 3223 | 2171 | 1412 |
| 31 | 72008 | 23968 | 7169 | 3048 | 2021 | 1367 |
| 62 | 77442 | 24903 | 7491 | 2912 | 2006 | 1322 |
| 90 | 69407 | 23587 | 6937 | 3070 | 2054 | 1326 |
| 121 | 71428 | 23433 | 7156 | 3071 | 2022 | 1302 |
| 182 | 69180 | 23333 | 6820 | 3022 | 2048 | 1305 |
| 272 | 69383 | 24419 | 6983 | 3154 | 2026 | 1313 |
| 368 | 71198 | 23194 | 6986 | 3271 | 2167 | 1387 |
| 432 | 68529 | 24321 | 6785 | 3026 | 2024 | 1310 |
| Slope | −9.158 | −0.883 | −1.113 | 0.159 | 0.015 | −0.068 |
| Y‐int | 72768.71 | 24120.04 | 7270.61 | 3060.96 | 2057.23 | 1350.02 |
| SE Slope | 5.697 | 1.469 | 0.420 | 0.266 | 0.157 | 0.096 |
| Slope t‐stat | −1.607 | −0.601 | −2.646 | 0.599 | 0.098 | −0.711 |
| p value | 0.152 | 0.567 | 0.033 | 0.568 | 0.925 | 0.500 |
FIGURE 4.

Long‐term stability diagram of CAL3 end‐user IVD MD calibrator
3.2.3. Precision evaluation
According to the preliminary precision validated results and outlier test, no outlier was found in the 80 test results of 5 clinical samples and 2 quality control materials, respectively. The intermediate imprecision and repeatability of samples near 30 pg/ml was less than 10%. The repeatability of samples ≥30 pg/ml was 2.10%–5.35%, which is lower than the allowable imprecision (6.0%). In addition, the intermediate imprecision of samples ≥30 pg/ml was 2.10%–5.62%, which is less than the allowable imprecision (7.5%) (Appendix 2).
3.2.4. Linearity interval verification
H sample was 4167.25 pg/ml, and L sample was 12.52 pg/ml. For samples <26.8 pg/ml, according to RCPAQAP performance specification, the ADL was 6.81 pg/ml. For samples ≥26.8 pg/ml, the ADL was 5.0%.
For all proportionally mixed samples, the absolute value of deviation from linearity was less than or equal to ADL, or the confidence interval (CI) of deviation from linearity was intersecting within the range of ±ADL. The linear range of Chemclin E2 project was verified to be 12.52–4167.25 pg/ml (Figure 5, Appendix 3).
FIGURE 5.
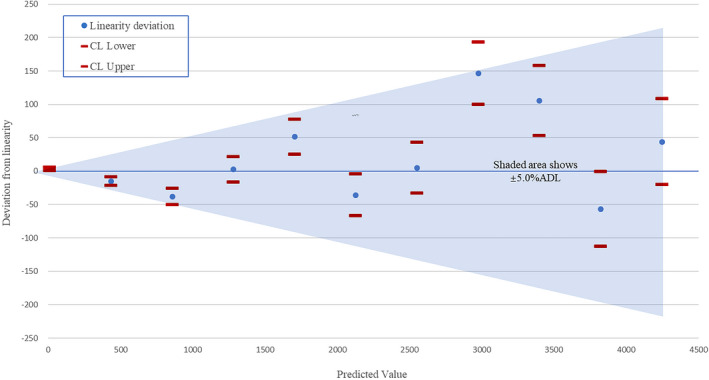
The confidence interval of deviation from linearity
3.2.5. Comparison of Chemclin and MS
The clinical laboratory carried out this study to prove metrological traceability. The Bland‐Altman plot with the relative deviation on the vertical axis is shown in Figure 6. The samples with MS measurement value less than 26.8 pg/ml were separately evaluated. There were two cases that did not meet the RCPAQAP performance specification.
FIGURE 6.
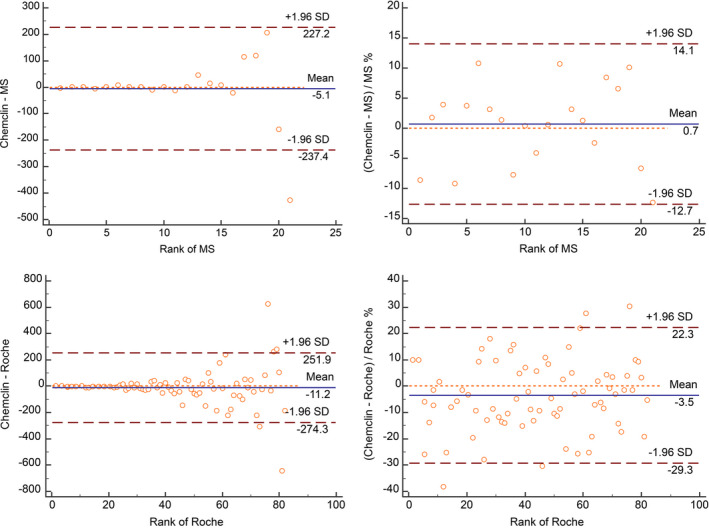
Chemclinin vs. MS and Chemclinin vs. Roche Bland‐Altman plots
For samples ≥26.8 pg/ml, there were no outliers and basically showed the characteristics of constant coefficient of variation. The LoA was set ±20%, and Chemclin met the performance specification (Figure 6). The initial estimate of bias was 0.70% (−2.40%–3.80%). Concordance Correlation Coefficient (CCC) was calculated to be 0.985.
The Passing‐Bablok regression model showed that the slope of 95% CI of Chemclin included 1, and the intercept of 95% CI included 0. The bias at the levels of clinical concern, the allowable bias is 10.03% (Table 4). The results showed that Chemclin met the performance specification. Chemclin E2 used the established metrological traceability to deliver accuracy to end‐user IVD MD.
TABLE 4.
Summary of Passing‐Bablok regression analysis results
| Evaluated MP | Passing‐Bablok | Bias at medical decision level | |||
|---|---|---|---|---|---|
| Equation | Slope (95% CI) | Intercept (95% CI) | Point of focus (pg/ml) | Bias% (95% CI) | |
| Chemclin | Y = 1.016X−0.139 | 1.016 (0.971–1.071) | −0.139 (−7.660–3.787) | 50 | 1.28 (−8.73–7.03) |
| 100 | 1.42 (−3.72–4.99) | ||||
| 300 | 1.51 (−4.43–6.84) | ||||
| 1000 | 1.54 (−6.31–7.86) | ||||
3.2.6. Comparison of Chemclin and Roche E601
The clinical laboratory carried out this study to prove comparability with IVD manufacturer with higher market share. Using the same performance specification as in 3.2.5, a total of 12 serum samples with detection results <26.80 pg/ml met the RCPAQAP quality specifications, The samples ≥26.80 pg/ml had no outliers, and 82 serum samples were finally included. The sample concentration ranged from 27.0 pg/ml to 3342.0 pg/ml.
Bland‐Altman diagram was plotted for all values, the data basically showing the characteristics of constant coefficient of variation (Figure 6). The Passing‐Bablok model was niY = 0.981x‐1.114 and Spearman correlation coefficient was 0.993. The medical decision level was substituted into the equation, the percentage deviations at 50.0 pg/ml, 100 pg/ml, 300.0 pg/ml, and 1000.0 pg/ml were −4.17%, −3.02%, −2.25%, and −1.99%, respectively. The relative deviation at each level met the performance specification.
3.2.7. Detection capability validation
LoB
The results of 60 tests were sorted from lowest to highest, and the percentile distribution (PctB) was calculated, α = 0.05, PctB = 1‐α = 0.95, and the LoB was 4.59 pg/ml.
LoD
The calculated mean value and SD are summarized (Appendix 4). All samples passed the homogeneity test of variance of test results; Levene statistic was 0.375 (p value = 0.826), and LoD was 8.93 pg/ml.
LoQ
The coefficient of variation and mean values are summarized (Appendix 5). Origin Pro software was used to perform functional regression analysis, and the allowable imprecision was derived to be 20.00%. The regression curve was Y = 165.08* X−0.94 (Figure 7). By substituting the 20% into the equation as X, Y = 9.88 pg/ml.
FIGURE 7.
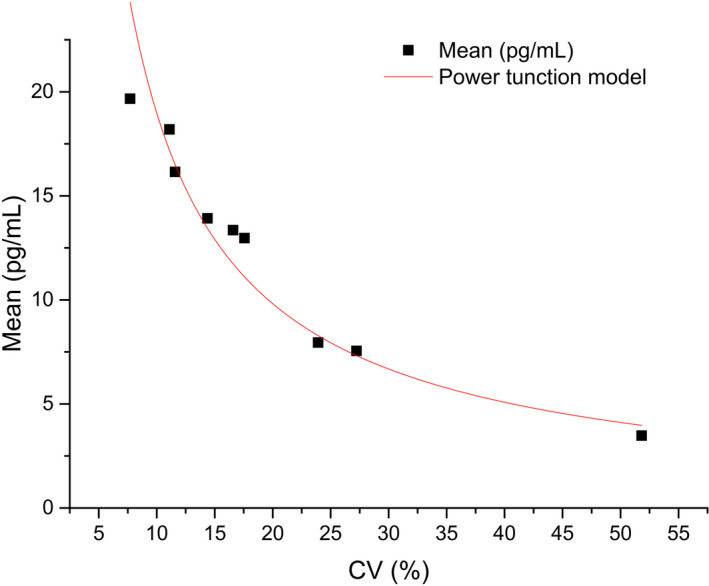
Function curve of LoQ
3.2.8. Interference
E2 concentrations of 1739.5, 188.5, and 60.5 pg/ml were selected. The interference rate of E2 ranged from −5.5% to 6.6% and met the E2 detection requirements for hyperbilirubinemia, hemolysis, and lipemia in the manufacturer's specification statement (Table 5).
TABLE 5.
Interference from addition of hemoglobin, total bilirubin, and triglyceride to serum samples
| Interfering substance | High (pg/ml) | Interference (%) | Middle (pg/ml) | Interference (%) | Low (pg/ml) | Interference (%) |
|---|---|---|---|---|---|---|
| Hemoglobin (mg/dl) | ||||||
| 0 | 1739.5 | – | 188.5 | – | 60.5 | – |
| 200 | 1659.4 | 4.6 | 192.4 | −2.1 | 56.5 | 6.6 |
| Total Bilirubin (mg/dl) | ||||||
| 0 | 1739.5 | – | 188.5 | – | 60.5 | – |
| 20 | 1708.9 | 1.8 | 179.9 | 4.6 | 57.1 | 5.6 |
| Triglyceride(mg/dl) | ||||||
| 0 | 1739.5 | – | 188.5 | – | 60.5 | – |
| 300 | 1792.1 | −3.0 | 195.2 | −3.6 | 63.8 | −5.5 |
4. DISCUSSION
As an important feedback regulator of the hypothalamic‐pituitary‐gonad axis, estradiol plays an important role in female sexual maturation, entire reproductive cycle, and in the aging process. 6 In addition, estradiol has a wide range of metabolic regulatory functions. 7 Increased estradiol concentration is commonly caused by hypothalamic‐pituitary‐ovarian axis hyperfunction, heterologous secretion of gonadotropin, and nonspecific metabolic diseases, often leading to disorders such as precocious puberty and irregular menstruation. Similarly, pathological decrease in E2 caused by dysfunction of the hypothalamic‐pituitary‐ovarian axis and other nonspecific reasons often leads to disorders such as female sexual infantile syndrome, delayed puberty, and secondary amenorrhea. In addition, decreased blood E2 concentration can also lead to bone loss, uterine atrophy, and aging. 8 , 9 , 10 , 11 Therefore, the ability to accurately measure E2 levels is of much clinical significance. Moreover, improving the detection sensitivity of E2 at low levels is important for the diagnosis and monitoring of various diseases characterized by decreased E2 levels. 12
E2 has full metrological traceability system to the SI. A reference measurement procedure for the determination of E2 by MS has been recommended by the JCTLM. The test results of different detection systems are supposed to be reproducible. However, in clinical practice, due to the differences in metrological traceability methods, there is considerable variability in the test results of different detection systems. According to the results of the endocrine project of the National Center for Clinical Laboratories national External Quality Assessment scheme in endocrinology (2021), the coefficient of variation of the robust mean of E2 was 17.87%–35.22% among groups.
We emphasized the role of pools of human samples in the metrological traceability process and assessed the matrix effect and stability of end‐user IVD MD calibrator. Compared to M.3. six secondary calibrators, the use of m.3. pools of human samples to adjust end‐user IVD MD calibrator to ensure the accuracy of end‐user significantly decreased the LoA and bias at the medical decision level. According to 17511: 2020, pools of human samples play a crucial role in the adjustment of end‐user IVD MD calibrator.
The competitive LICA provided a rapid, highly sensitive, and specific method for the measurement of serum E2. Li et al established a novel assay based on the luminescent oxygen channeling immunoassay using E3 instead of E2 as a competitive antigen for quantification of E2 in human serum. 4 In the present study, we used E2 isomer instead of E3. Using E2 isomer as a competitor can prevent interference of E2 analogs in serum. This greatly improved the detection sensitivity of E2, the correlation of some samples was solved. Compared with MS, the CCC approached 0.985 at the end‐user level. Moreover, a good correlation with MS was observed even for samples with levels less than 26.8 pg/ml.
In this paper, we established a complete metrological traceability system for E2 at the manufacturer and evaluated the performance at the clinical end‐user. First, we evaluated the precision of E2. The repeatability of samples with E2 level >30 pg/ml ranged from CV 2.10% to CV 5.35%, and the intermediate imprecision ranged from CV 2.10% to CV 5.62%, both lower than the allowable imprecision. Secondly, according to EP06‐ED2, E2 showed excellent linearity interval of 12.52 pg/ml to 4167.25 pg/ml. On evaluation of accuracy compared to MS, the deviation for samples with E2 <26.8 pg/ml was −8.75–1.55 pg/ml. For samples with E2 >26.8 pg/ml, the Bland‐Altman plot showed characteristics of constant coefficient of variation, and the LoA was −12.7%–14.1%, which is less than ±20%. The bias at the medical decision level was‐1.28%–1.54%, which was highly consistent with the results of MS. On evaluation of trueness compared to Roche, the bias at the medical decision level was found to be −1.99% to −4.17%, and showed good consistency with Roche. In addition, we also verified the detection capability of E2, with LoB of 4.59 pg/ml, LoD of 8.93 pg/ml, and LoQ of 9.88 pg/ml, respectively (allowed imprecision is 20.00%). LICA showed high sensitivity for detection of E2 at low levels. The interference rate of E2 ranged from −5.5% to 6.6%, which qualified the E2 detection requirements for hyperbilirubinemia, hemolysis, and lipemia in the manufacturer's specification statement.
5. CONCLUSION
In summary, in strict accordance with the ISO17511:2020, we established the metrological traceability of E2, strengthened the role of metrological traceability pools of human samples. The metrological traceability of E2 established by using pools of human samples as M.3. can deliver accuracy to the end‐user IVD MD and show good consistency with MS and Roche, and demonstrating excellent performance in measuring E2 levels. LICA for E2 is a promising assay for detection of E2 in clinical settings.
CONFLICT OF INTERESTS
All authors state no conflict of interests.
AUTHOR CONTRIBUTIONS
(I) Conception and design: Di Huang and Xiyang Lin; (II) Administrative support: Chenyu Shang; (III) Provision of study materials or patients: Chenyu Shang and Xiaoxin Yan; (IV) Collection and assembly of data: Xinxin Ren; (V) Data analysis and interpretation: Xiyang Lin; (VI) Manuscript writing: All authors; (VII) Final approval of manuscript: All authors.
ETHICAL APPROVAL
Research involving human subjects complied with all relevant national regulation, institutional policies, and is in accordance with the tenets of the Helsinki Declaration (as revised in 2013), and has been approved by the Ethical Committee of the Second Affiliated Hospital of Guangzhou University of Chinese Medicine.
PATIENT CONSENT
Anonymized routine serum samples were used in this study after clinical chemistry testing had been completed. The Ethical Committee of the Second Affiliated Hospital of Guangzhou University of Chinese Medicine approved the study.
PERMISSION TO REPRODUCE MATERIAL FROM OTHER SOURCES
Not applicable.
CLINICAL TRIAL REGISTRATION
Not applicable.
ACKNOWLEDGMENTS
Establishing metrological traceability of values assigned to m.2.‐m.3. was supported by the National Center for Clinical Laboratories (NCCL, China). We thank Tianjiao Zhang, NCCL. Thanks for her work in assigning values to calibrators. This work was supported by a grant from the Traditional Chinese Medicine Bureau of Guangdong Province.
APPENDIX 1.
The relative uncertainty of this panel
| Sample | Assigned value | The relative uncertainty of Class A (%) | The relative uncertainty of Class B (%) | Combined relative uncertainty (%) | |||
|---|---|---|---|---|---|---|---|
| Ubb, ref | U lts, ref | U bias, ref | U ε, ref | ||||
| Sample1 | 6.86 | 1.86 | 3.26 | 0.74 | 0.51 | 0.0015 | 3.9 |
| Sample2 | 10.79 | 1.86 | 3.26 | 0.74 | 0.51 | 0.0015 | 3.9 |
| Sample3 | 14.28 | 1.86 | 3.26 | 0.74 | 0.51 | 0.0015 | 3.9 |
| Sample4 | 24.36 | 1.86 | 3.26 | 0.74 | 0.51 | 0.0015 | 3.9 |
| Sample5 | 24.92 | 1.86 | 3.26 | 0.74 | 0.51 | 0.0015 | 3.9 |
| Sample6 | 36.55 | 1.86 | 3.26 | 0.74 | 0.51 | 0.0015 | 3.9 |
| Sample7 | 35.17 | 1.86 | 3.26 | 0.74 | 0.51 | 0.0015 | 3.9 |
| Sample8 | 37.68 | 1.86 | 3.26 | 0.74 | 0.51 | 0.0015 | 3.9 |
| Sample9 | 46.85 | 1.86 | 4.08 | 0.74 | 0.51 | 0.0015 | 4.6 |
| Sample10 | 57.60 | 1.86 | 4.08 | 0.74 | 0.51 | 0.0015 | 4.6 |
| Sample11 | 72.42 | 0.50 | 4.08 | 0.74 | 0.51 | 0.0015 | 4.2 |
| Sample12 | 85.55 | 0.50 | 4.08 | 0.74 | 0.51 | 0.0015 | 4.2 |
| Sample13 | 77.79 | 0.50 | 4.08 | 0.74 | 0.51 | 0.0015 | 4.2 |
| Sample14 | 133.34 | 0.50 | 4.06 | 0.74 | 0.51 | 0.0015 | 4.2 |
| Sample15 | 159.06 | 0.50 | 4.06 | 0.74 | 0.51 | 0.0015 | 4.2 |
| Sample16 | 286.00 | 0.50 | 4.06 | 0.74 | 0.51 | 0.0015 | 4.2 |
| Sample17 | 348.99 | 0.49 | 4.72 | 0.74 | 0.51 | 0.0015 | 4.8 |
| Sample18 | 438.41 | 0.49 | 4.72 | 0.74 | 0.51 | 0.0015 | 4.8 |
| Sample19 | 427.38 | 0.49 | 4.72 | 0.74 | 0.51 | 0.0015 | 4.8 |
| Sample20 | 691.91 | 0.49 | 2.91 | 0.74 | 0.51 | 0.0015 | 3.1 |
| Sample21 | 852.71 | 0.49 | 2.91 | 0.74 | 0.51 | 0.0015 | 3.1 |
| Sample22 | 1369.58 | 0.24 | 3.05 | 0.74 | 0.51 | 0.0015 | 3.2 |
| Sample23 | 1845.45 | 0.24 | 3.05 | 0.74 | 0.51 | 0.0015 | 3.2 |
| Sample24 | 2057.83 | 0.24 | 3.05 | 0.74 | 0.51 | 0.0015 | 3.2 |
| Sample25 | 2396.60 | 0.30 | 3.05 | 0.74 | 0.51 | 0.0015 | 3.2 |
| Sample26 | 3456.42 | 0.30 | 3.75 | 0.74 | 0.51 | 0.0015 | 3.9 |
| Sample27 | 4558.84 | 0.30 | 3.75 | 0.74 | 0.51 | 0.0015 | 3.9 |
| Calibrator1 | 107.35 | 0.50 | 2.65 | 0.74 | 0.51 | 0.0015 | 2.8 |
| Calibrator2 | 566.54 | 0.49 | 2.57 | 0.74 | 0.51 | 0.0015 | 2.8 |
| Calibrator3 | 1040.80 | 0.24 | 3.74 | 0.74 | 0.51 | 0.0015 | 3.9 |
U bb, ref refers to relative uncertainty introduced by homogeneity. Five clinical samples with similar concentration to panel were selected, which were divided into 4 aliquots, and each aliquot was detected repeatedly for 3 times. U lts, ref refers to relative uncertainty introduced by long‐term stability; 7 clinical samples with similar concentration in panel were selected to monitor long‐term stability. Data in Table 4 were used for calibrators. U bias, ref refers to relative uncertainty introduced by bias, which is calculated according to recovery evaluation data after the establishment of mass spectrometry; U ε, ref refers to relative uncertainty introduced by imprecision, which is calculated according to imprecision evaluation data after the establishment of mass spectrometry.
APPENDIX 2.
Precision evaluation results
| Sample | Mean (pg/ml) | Repeatability | Intermediate imprecision | ||||
|---|---|---|---|---|---|---|---|
| SD (pg/ml) | CV (%) | 95% CI (%) | SD (pg/ml) | CV (%) | 95% CI (%) | ||
| Sample 1 | 31.74 | 2.80 | 8.83 | 7.25–11.30 | 2.80 | 8.83 | 7.56–10.58 |
| Sample 2 | 54.83 | 2.94 | 5.35 | 4.40–6.85 | 3.08 | 5.61 | 4.84–6.66 |
| Sample 3 | 186.80 | 3.92 | 2.10 | 1.37–2.69 | 3.92 | 2.10 | 1.82–2.51 |
| Sample 4 | 632.03 | 15.98 | 2.53 | 2.08–3.24 | 16.19 | 2.56 | 2.29–3.20 |
| Sample 5 | 1738.64 | 41.70 | 2.64 | 2.17–3.38 | 43.38 | 2.75 | 2.38–3.27 |
| QL | 48.90 | 2.18 | 4.46 | 3.66–5.70 | 2.75 | 5.62 | 4.79–6.85 |
| QH | 232.38 | 4.88 | 2.10 | 1.72–2.69 | 4.88 | 2.10 | 1.81–2.48 |
APPENDIX 3.
Linear range verification data (pg/ml)
| Dilution ratio | Expected Value | Mean Value | Sigma | Predicted value | Deviation from linearity | CI Lower | CI Upper | ±ADL |
|---|---|---|---|---|---|---|---|---|
| L | 12.52 | 12.69 | 0.167 | 10.52 | 3.17 | 0.63 | 5.72 | 6.81* |
| 0.9L+0.1H | 428.89 | 419.14 | 5.109 | 434.20 | −15.06 | −21.32 | −8.81 | 21.71 |
| 0.8L+0.2H | 844.27 | 819.48 | 9.989 | 857.88 | −38.40 | −50.63 | −26.16 | 42.89 |
| 0.7L+0.3H | 1259.64 | 1284.05 | 15.652 | 1281.56 | 2.49 | −16.68 | 21.66 | 64.08 |
| 0.6L+0.4H | 1675.01 | 1756.73 | 21.414 | 1705.24 | 51.49 | 25.26 | 77.72 | 85.26 |
| 0.5L+0.5H | 2090.39 | 2093.00 | 25.513 | 2128.92 | −35.92 | −67.17 | −4.67 | 106.45 |
| 0.4L+0.6H | 2505.76 | 2557.35 | 31.173 | 2552.60 | 4.75 | −33.43 | 42.94 | 127.63 |
| 0.3L+0.7H | 2921.13 | 3122.34 | 38.060 | 2976.28 | 146.06 | 99.44 | 192.69 | 148.81 |
| 0.2L+0.8H | 3336.50 | 3505.61 | 42.731 | 3399.96 | 105.65 | 53.30 | 157.99 | 170.00 |
| 0.1L+0.9H | 3751.88 | 3766.81 | 45.915 | 3823.64 | −56.83 | −113.08 | −0.58 | 191.18 |
| H | 4167.25 | 4291.26 | 52.308 | 4247.32 | 43.94 | −20.14 | 108.02 | 212.37 |
*For samples <26.8 pg/ml, ADL was set to 6.81 pg/ml.
APPENDIX 4.
Performance verification data of lod (pg/ml)
| Sample ID | Mean | SD |
|---|---|---|
| 1 | 5.67 | 1.54 |
| 2 | 5.96 | 1.43 |
| 3 | 9.73 | 1.71 |
| 4 | 10.01 | 1.66 |
| 5 | 10.44 | 1.50 |
APPENDIX 5.
Performance verification data of loq
| Sample ID | Mean (pg/ml) | CV (%) |
|---|---|---|
| 1 | 3.48 | 51.82 |
| 2 | 7.55 | 27.23 |
| 3 | 7.95 | 23.92 |
| 4 | 12.97 | 17.57 |
| 5 | 13.35 | 16.59 |
| 6 | 13.92 | 14.37 |
| 7 | 16.15 | 11.58 |
| 8 | 18.19 | 11.10 |
| 9 | 19.67 | 7.71 |
Shang C, Yuan X, Lin H, et al. Light‐initiated chemiluminescent assay of 17β‐estradiol metrological traceability system established by manufacturer according to ISO17511:2020 and basic performance evaluation performed by clinical end‐users. J Clin Lab Anal. 2022;36:e24436. doi: 10.1002/jcla.24436
Funding information
This work was supported by a grant from the Traditional Chinese Medicine Bureau of Guangdong Province (#20201161)
DATA AVAILABILITY STATEMENT
The datasets generated during the current study are available from the corresponding author on reasonable request.
REFERENCES
- 1. Zhu JL, Chen Z, Feng WJ, Long SL, Mo ZC. Sex hormone‐binding globulin and polycystic ovary syndrome. Clin Chim Acta. 2019;499:142‐148. [DOI] [PubMed] [Google Scholar]
- 2. Abide Yayla C, Ozkaya E, Beydilli Nacak G, et al. High estrogen exposure may not be detrimental on endometrial receptivity in women with PCOS. Gynecol Endocrinol. 2018;34(9):798‐803. [DOI] [PubMed] [Google Scholar]
- 3. Cui Y, She T, Zhao H, et al. Competitive light‐initiated chemiluminescent assay: using 5‐α‐dihydrotestosterone‐BSA as competitive antigen for quantitation of total testosterone in human sera. Anal Bioanal Chem. 2019;411(3):745‐754. [DOI] [PubMed] [Google Scholar]
- 4. Li J, Li L, Bian Y, et al. Quantitation of estradiol by competitive light‐initiated chemiluminescent assay using estriol as competitive antigen. J Clin Lab Anal. 2020;34(1):e23014. [DOI] [PMC free article] [PubMed] [Google Scholar]
- 5. ISO 17511:2020 . In vitro diagnostic medical devices‐Requirements for establishing metrological traceability of values assigned to calibrators, trueness control materials and human samples.
- 6. Hamilton KJ, Hewitt SC, Arao Y, Korach KS. Estrogen Hormone Biology. Curr Top Dev Biol. 2017;125:109‐146. [DOI] [PMC free article] [PubMed] [Google Scholar]
- 7. Cui J, Shen Y, Li R. Estrogen synthesis and signaling pathways during aging: from periphery to brain. Trends Mol Med. 2013;19(3):197‐209. [DOI] [PMC free article] [PubMed] [Google Scholar]
- 8. Khosla S, Oursler MJ, Monroe DG. Estrogen and the skeleton. Trends Endocrinol Metab. 2012;23(11):576‐581. [DOI] [PMC free article] [PubMed] [Google Scholar]
- 9. Huang JH, Duan H, Wang S, Wang YY. Estrogen 17β‐estradiol accelerates the proliferation of uterine junctional zone smooth muscle cells via the let‐7a/Lin28B axis in adenomyosis. Mol Med Rep. 2021;23(5):337. [DOI] [PubMed] [Google Scholar]
- 10. Russell JK, Jones CK, Newhouse PA. The role of estrogen in brain and cognitive aging. Neurotherapeutics. 2019;16(3):649‐665. [DOI] [PMC free article] [PubMed] [Google Scholar]
- 11. Hayashi M, Nakashima T, Yoshimura N, Okamoto K, Tanaka S, Takayanagi H. Autoregulation of osteocyte Sema3A orchestrates estrogen action and counteracts bone aging. Cell Metab. 2019;29(3):627‐637.e5. [DOI] [PubMed] [Google Scholar]
- 12. Deroo BJ, Korach KS. Estrogen receptors and human disease. J Clin Invest. 2006;116(3):561‐570. [DOI] [PMC free article] [PubMed] [Google Scholar]
Associated Data
This section collects any data citations, data availability statements, or supplementary materials included in this article.
Data Availability Statement
The datasets generated during the current study are available from the corresponding author on reasonable request.