Abstract
Background
Breast cancer is a frequently occurring malignant tumor in women. Angiotensin‐converting enzyme 2 (ACE2) is widely expressed in most organs; however, the association of ACE2 with prognosis and immune infiltration in breast invasive carcinoma (BRCA) remains elusive.
Methods
We explored the expression level and prognostic value of ACE2 in patients with BRCA using a series of online bioinformatics analysis databases encompassing Oncomine, UALCAN, Kaplan–Meier plotter, TIMER, LinkedOmics, and GEO. qRT‐PCR was performed to verify our findings.
Results
Angiotensin‐converting enzyme 2 mRNA and protein expression levels were decreased in BRCA tissues, and patients with low ACE2 expression levels had a poor prognosis. DNA promoter methylation of ACE2 significantly downregulated ACE2 expression in BRCA, while the expression of this protein was positively linked to immune infiltration of B cells, CD8+ and CD4+ T cells, neutrophils, and dendritic cells in BRCA tissues. The high expression level of ACE2 in enriched basophils, CD8+ T cells, and type‐2 helper T cells, which showed decreasing levels, indicated a better prognosis for BRCA. Enrichment analyses revealed that NF‐κB, IL‐17, and TNF signaling pathways were highly correlated to ACE2 in BRCA. Verification study revealed that downregulation of ACE2 was associated with a better prognosis in BRCA. Univariate and multivariate analysis confirmed ACE2 expression and clinical stage as independent prognostic factors for breast cancer.
Conclusions
Angiotensin‐converting enzyme 2 may be a potential prognostic biomarker and target for BRCA. Nevertheless, future investigations are needed for validating our findings and promoting the clinical application of ACE2 in BRCA.
Keywords: ACE2, breast cancer, immune infiltration, prognostic biomarker
Breast cancer is a frequently occurring malignant tumor in females. Angiotensin‐converting enzyme 2 (ACE2) is widely expressed in most organs; however, the association of ACE2 with prognosis and immune infiltration in breast invasive carcinoma (BRCA) remains elusive. We explored the expression level and prognostic value of ACE2 in patients with BRCA using a series of online bioinformatics analysis databases encompassing Oncomine, UALCAN, Kaplan–Meier plotter, TIMER, LinkedOmics, and GEO. qRT‐PCR was performed to verify our findings. ACE2 mRNA and protein expression levels were decreased in BRCA tissues, and patients with low ACE2 expression levels had a poor prognosis. DNA promoter methylation of ACE2 significantly downregulated ACE2 expression in BRCA, while the expression of this protein was positively linked to immune infiltration of B cells, CD8+ and CD4+ T cells, neutrophils, and dendritic cells in BRCA tissues. The high expression level of ACE2 in enriched basophils, CD8+ T cells, and type‐2 helper T cells, which showed decreasing levels, indicated a better prognosis for BRCA. Enrichment analyses revealed that NF‐κB, IL‐17, and TNF signaling pathways were highly correlated to ACE2 in BRCA. Verification study revealed that downregulation of ACE2 was associated with a better prognosis in BRCA. Univariate and multivariate analysis confirmed ACE2 expression and clinical stage as independent prognostic factors for breast cancer. ACE2 may be a potential prognostic biomarker and target for BRCA. Nevertheless, future investigations are needed for validating our findings and promoting the clinical application of ACE2 in BRCA.

1. INTRODUCTION
Breast cancer mostly occurs in women and is associated with high mortality. Classically, the prognosis of breast cancer correlates with age, stage, tumor type, tumor grade, and lymphovascular status. 1 According to Global Cancer Statistics 2018, breast cancer accounted for 11.6% of cases, being the second‐largest commonly diagnosed cancer. 2 BRCA1 and BRCA2 genes are tumor suppressor genes that help repair DNA damage to suppress breast cancer tumorigenesis. People with mutations in BRCA genes are vulnerable to breast cancer. Statistics show that BRCA1 and BRCA2 mutations could increase the susceptibility of 80‐year‐olds individuals by 72% and 69%, respectively. 3 The treatment options available for noninvasive and invasive breast cancer are complicated and diverse. The NCCN guidelines for breast cancer treatment encourage HR‐positive, HER2‐negative early invasive breast cancer patients to undergo testing using multigene assays with or without adjuvant systemic therapy based on nodal status and other clinicopathological features. 4 Invasive ductal breast cancer (IDC) and invasive lobular breast cancer (ILC) are the most frequent histological subtypes of invasive breast cancer. ER‐positive, HER2‐negative patients with IDC or ILC show differences in immune infiltration in the light of clinical relevance, prevalence location, among other factors. 5
Angiotensin‐converting enzyme 2 balances the function of ACE. Most organs, including lungs, intestines, heart, arteries, and kidneys, as well as the female reproductive system, express ACE2. 6 Furthermore, in the cardiovascular system, ACE2 can protect the heart and relax blood vessels. ACE2 also plays important roles in the renal and reproductive system. 7 ACE2 deficiency results in hypertension, diabetes, and several cardiovascular diseases. 8 Recently, ACE2 has been reported to protect breast cancer patients. One possible mechanism of ACE2 to suppress the carcinogenesis of breast cancer can be the inhibition of the VEGFa/VEGFR2/ERK pathway. 9 However, the complete mechanism of how ACE2 acts in breast cancer, especially BRCA, remains unclear.
In this work, we evaluated ACE2 mRNA and protein expression, as well as promoter methylation levels using the Oncomine and UALCAN databases. BRCA survival analysis was performed in the Kaplan–Meier plotter database (KMPD). The relationship between ACE2 expression and immune infiltration and immune cell gene biomarkers was explored in Tumor Immune Assessment Resource (TIMER) database. Furthermore, Gene Set Enriching Analysis (GSEA) was utilized to perform the GO and KEGG enrichment analyses using the LinkedOmics database.
2. MATERIALS AND METHODS
2.1. Oncomine
Oncomine contains 715 datasets and 86,733 samples, being the most comprehensive online cancer gene chips database worldwide. 10 The expression of ACE2 in BRCA and other tumors was studied in Oncomine (https://www.oncomine.org/resource/main.html). The threshold was a p‐value of 1E‐4, a twofold change, and a top 10% of the gene ranking.
2.2. UALCAN
UALCAN is a comprehensive database providing diverse in‐depth analysis of TCGA expression data (http://ualcan.path.uab.edu/cgi‐bin/ualcan‐res.pl). 11 The TCGA BRCA dataset (N = 537) in the “Expression Analysis” module in TCGA was adopted for assessing ACE2 mRNA levels in various subgroups of BRCA patients.
2.3. Kaplan–Meier plotter (KM‐plotter)
Kaplan–Meier plotters analyze the influence of various genes on the survival of patients with certain types of cancers, including breast, ovarian, lung, and gastric cancer (https://kmplot.com/analysis/). 12 The TCGA BRCA dataset was obtained by selecting “breast cancer” from the Pan‐cancer RNA‐seq module. We analyzed the association of ACE2 expression with overall survival (OS) and relapse‐free survival (RFS) in BRCA patients (n = 1090) using a KM survival plot. Furthermore, the correlation of ACE2 expression and the RFS of BRCA patients with different clinicopathological features was analyzed. Patients were split based on "automatically select the best cut‐off point," and the follow‐up threshold covered all patients.
2.4. Tumor Immune Assessment Resource (TIMER)
Tumor immune assessment resource tool is used for investigating correlations between immune infiltration and TCGA tumor (https://cistrome.shinyapps.io/timer/). 13 We used TIMER database Gene and SCNA modules to evaluate the correlation between ACE2 expression and immune infiltration and gene biomarkers of immune cells using the TCGA BRCA dataset (N = 537).
2.5. LinkedOmics
The LinkedOmics database is an online platform that helps analyze 32 types of cancer and 11,158 patients from TCGA (http://www.linkedomics.org/login.php) 14 . Differentially expressed genes that correlated to ACE2 expression were determined by the LinkFinder module (n = 1093). The Spearman test was used to analyze the results statistically. In the LinkInterpreter module, GSEA (Gene Set Enriching Analysis) tool was utilized for carrying out GO (CC, BP, and MF), KEGG pathway, kinase‐target enrichment, miRNA‐target enrichment, and transcription factor enrichment analyses. The rank criteria were based on p‐value from LinkFinder results. The minimal gene size was 3 and 500 simulations were tested.
2.6. Clinical specimens
After obtaining informed consent from patients of Enze Hospital, Taizhou Enze Medical Center (Group), breast cancer tissues and pair‐normal breast tissues (n = 52) of these patients were used for the study. Our study was approved and supported by the ethics committee of Enze Hospital, Taizhou Enze Medical Center (Group). None of the patients received local or systemic treatment preoperatively.
2.7. qRT‐PCR
TRIzol reagent (Vazyme) was used to isolate total RNA. The synthesis of cDNAs corresponding to the mRNAs of interest was conducted using PrimeScript RT‐polymerase (Vazyme), SYBR‐Green Premix (Vazyme), and specific PCR primers (Sangon). Glyceraldehyde‐3‐phosphate dehydrogenase was used as an internal control. The 2−ΔΔCt method was used to calculate fold‐changes. The difference in the expression of ACE2 and the prognosis of ACE2 in breast cancer were explored with Student's t test and Kaplan–Meier analysis.
3. RESULTS
3.1. ACE2 expression in BRCA
We initially analyzed the Oncomine database to study differential ACE2 expression between various cancers and normal tissues. From the results, an abnormal expression level of ACE2 was observed in breast, colorectal, renal, and lung cancers, as well as sarcoma. For breast cancer, ACE2 expression increased particularly in Invasive Breast Carcinoma Stroma and decreased in IDC and ILC (Figure 1A). Then, we evaluated the transcription and protein expression level of ACE2 in BRCA using the Oncomine and UALCAN databases. Both databases showed that samples from BRCA patients had a significantly lower level of ACE2 compared to normal tissues (p < 0.001) (Figure 1B–E). Furthermore, analysis of numerous clinicopathological features of BRCA samples in the TCGA showed that ACE2 mRNA expression mainly correlates with gender, histologic subtypes, cancer stages, TP53 mutation status, menopause status, and cancer subclasses (Figure 2). By CPTAC analysis, ACE2 protein expression decreased significantly on the basis of age, race, stages, major subclass, tumor histology, and Pan‐cancer subtype (Figure 3).
FIGURE 1.
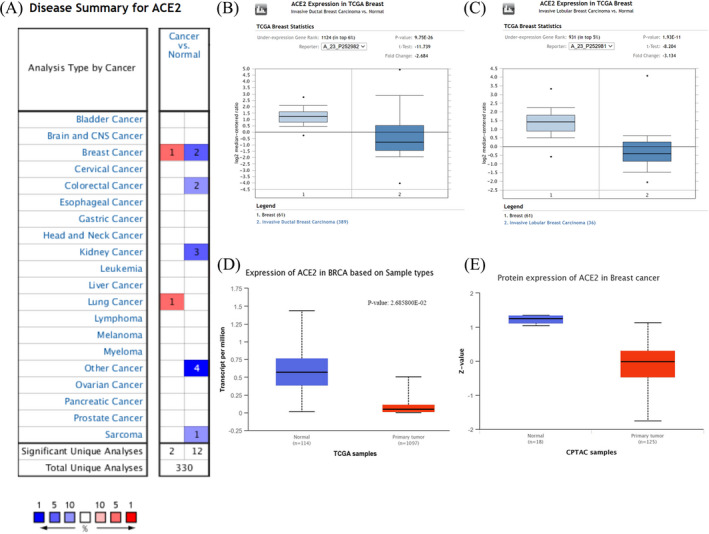
The mRNA and protein expression of ACE2 in breast invasive carcinoma (BRCA). (A) ACE2 expression variations in different cancers and normal tissues analyzed via the Oncomine database. (B) ACE2 mRNA expression in Invasive Ductal Breast Cancer (Oncomine). (C) ACE2 mRNA expression in Invasive Lobular Breast Cancer (Oncomine). (D) ACE2 mRNA expression in BRCA analyzed via the UALCAN database. (E) ACE2 protein expression in BRCA (UALCAN)
FIGURE 2.
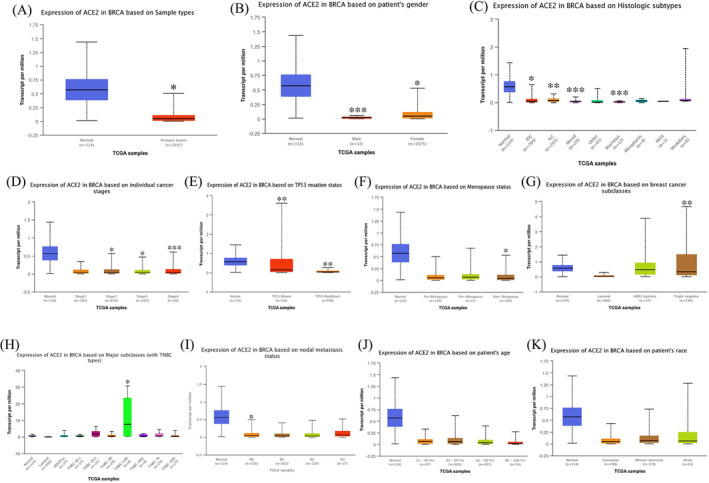
Angiotensin‐converting enzyme 2 mRNA expression based on various clinicopathological characteristics (UALCAN). (A) Relative expression of ACE2 in normal and BRCA samples. (B) Relative expression of ACE2 in normal individuals or male or female BRCA patients. (C) Relative expression of ACE2 in normal individuals or patients with IDC (Infiltrating Ductal Carcinoma), ILC (Infiltrating Lobular Carcinoma), Mixed histology, Mucinous Carcinoma, Medullary Carcinoma, Infiltrating Carcinoma NOS, Metaplastic Carcinoma, or other BRCA patients. (D) Relative expression of ACE2 in normal individuals or stages 1, 2, 3, or 4 BRCA patients. (E) Relative expression of ACE2 in normal individuals or TP53‐Mutant or TP53‐NonMutant BRCA patients. (F) Relative expression of ACE2 in normal individuals or Pre‐Menopause, Peri‐Menopause, or Post‐Menopause BRCA patients. (G) Relative expression of ACE2 in normal individuals or Luminal, HER2 positive, or Triple‐negative BRCA patients. (H) Relative expression of ACE2 in normal individuals or Luminal, HER2 positive, TNBC‐BL1 (TNBC Basal‐like 1), TNBC‐BL2 (TNBC Basal‐like 2), TNBC‐IM (TNBC Immunomodulatory), TNBC‐M (TNBC Mesenchymal), TNBC‐MSL (TNBC mesenchymal stem‐like), TNBC‐LAR (TNBC luminal androgen receptor), or TNBC‐UNS (TNBC unspecified) BRCA patients. (I) Relative expression of ACE2 in normal individuals or nodal metastasis status N0, N1, N2, N3 BRCA patients. (J) Relative expression of ACE2 in normal individuals at any age or BRCA patients aged 21–40, 41–60, 61–80, or 81–100 yrs. (K) Relative expression of ACE2 in normal individuals of any race or BRCA patients of Caucasian, African‐American, or Asian race. (*p < 0.05, **p < 0.01, ***p < 0.001)
FIGURE 3.
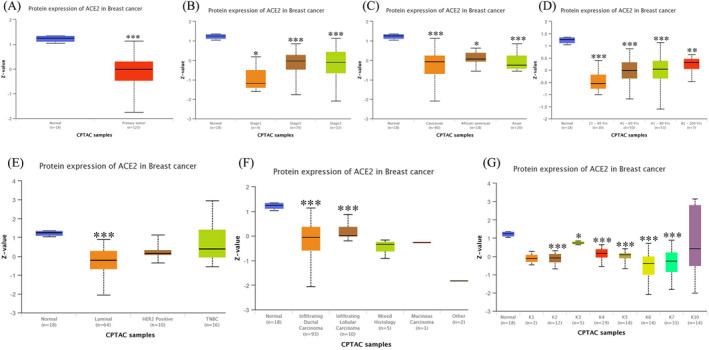
The protein expression levels of ACE2 in BRCA (UALCAN). (A) ACE2 protein expression in normal or breast cancer patients. (B) ACE2 protein expression in normal individuals or stage 1, 2, or 3 breast cancer patients. (C) ACE2 protein expression in normal individuals of any race or breast cancer patients of Caucasian, African‐American, or Asian race. (D) ACE2 protein expression in normal individuals at any age or breast cancer patients aged 21–40, 41–60, 61–80, or 81–100 years. (E) ACE2 protein expression in normal individuals or Luminal, HER2 positive, or Triple‐negative breast cancer (TNBC) patients. (F) ACE2 protein expression in normal individuals or patients with IDC, ILC, Mixed histology, Mucinous Carcinoma, Medullary Carcinoma, or other types of breast cancer. (G) ACE2 protein expression in normal individuals or breast cancer patients with pan‐cancer subtypes of cancer (K1 to K10). (*p < 0.05, **p < 0.01, ***p < 0.001)
3.2. The methylation level of ACE2 promoter decreased in BRCA
DNA promoter methylation usually inhibits gene transcription. To explore the influence of ACE2 methylation on ACE2 expression in BRCA, we first determined the ACE2 promoter methylation level in BRCA by utilizing the TCGA analysis module of the UALCAN database. ACE2 promoter methylation significantly reduced ACE2 expression, and this decrease was dependent on different clinicopathological features (Figure 4).
FIGURE 4.
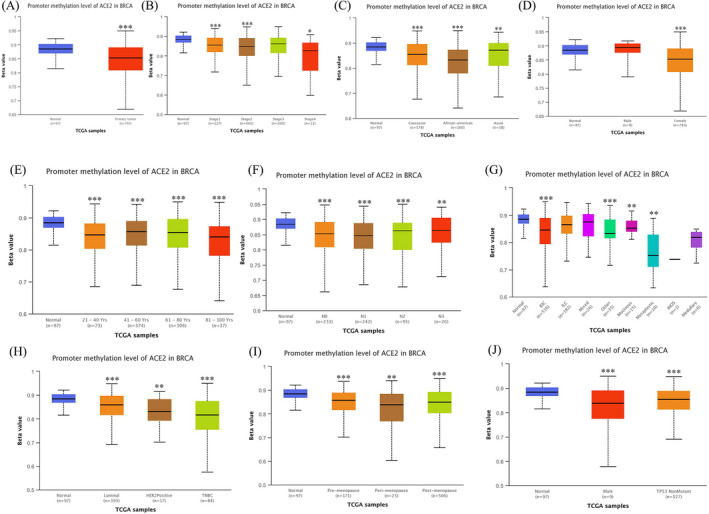
ACE2 promoter methylation levels in BRCA (UALCAN). (A) ACE2 promoter methylation levels in normal or BRCA samples. (B) ACE2 promoter methylation levels in normal individuals or stage 1, 2, 3, or 4 breast cancer patients. (C) ACE2 promoter methylation levels in normal individuals of any race or breast cancer patients of Caucasian, African‐American, or Asian race. (D) ACE2 promoter methylation levels in normal individuals or male or female BRCA patients. (E) ACE2 promoter methylation levels in normal individuals at any age or breast cancer patients aged 21–40, 41–60, 61–80, or 81–100 yrs. (F) ACE2 promoter methylation levels in normal individuals or nodal metastasis status N0, N1, N2, N3 BRCA patients. (G) ACE2 promoter methylation levels in normal individuals or patients with IDC, ILC, Mixed histology, Mucinous Carcinoma, Mucinous Carcinoma, Infiltrating Carcinoma NOS (INOS), Metaplastic Carcinoma, Medullary Carcinoma, or any other type of BRCA. (H) ACE2 promoter methylation levels in normal individuals or Luminal, HER2 positive, or TNBC patients. (I) ACE2 promoter methylation levels in normal individuals or Pre‐Menopause, Peri‐Menopause, or Post‐Menopause BRCA patients. (J) ACE2 promoter methylation levels in normal individuals or TP53‐Mutant or TP53‐NonMutant BRCA patients. (*p < 0.05, **p < 0.01, ***p < 0.001)
3.3. ACE2 served as a potential prognostic biomarker in BRCA
By using KMPD, we investigated the effect of ACE2 expression on RFS and OS of BRCA patients. BRCA patients with elevated ACE2 expression had a better prognosis, but the OS rate was not affected (Figure 5A,B). Further univariate and multivariate analysis revealed that ACE2 expression, pT stage, pN stage, and pM stage were independent factors affecting the prognosis of BRCA patients (Figure 5C,D). To better unveil the potential mechanism of ACE2 in BRCA, we evaluated the association of ACE2 expression and multiple clinicopathological factors in the Kaplan–Meier plotter databases. ACE2 overexpression was related to better RFS in stage 2 (HR = 0.49 (0.25–0.98), p = 0.04) and 3 (HR = 2.22 (1.13–4.37), p = 0.018) BRCA patients. In addition, high mutation burden might be a potential factor affecting BRCA prognosis (HR = 0.53 (0.26–1.08), p = 0.074) (Table 1).
FIGURE 5.
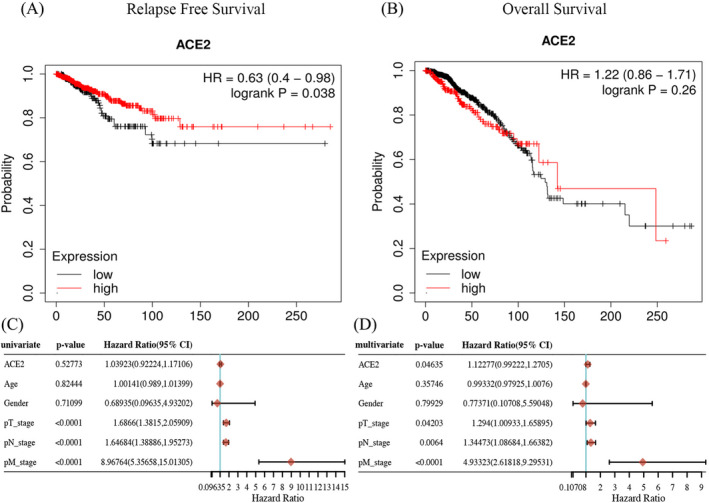
Kaplan‐Meier survival curves obtained by comparing the high and low expression of ACE2 in BRCA in the Kaplan‐Meier plotter database. (A) The relapse‐free survival (RFS) curve with respect to ACE2 expression in BRCA. (B) The overall survival (OS) curve with respect to ACE2 expression in BRCA. (C and D) Univariate and multivariate analysis of ACE2 expression and clinical parameters in BRCA
TABLE 1.
Correlation of ACE2 expression and the relapse‐free survival of BRCA with different clinicopathological factors (Kaplan‐Meier plotter)
| Pathological parameters | Case number | Hazard radio | p‐Value |
|---|---|---|---|
| Stage status | |||
| 1 | 253 | 3.16 (0.39–25.38) | 0.25 |
| 2 | 749 | 0.49 (0.25–0.98) | 0.04 |
| 3 | 265 | 2.22 (1.13–4.37) | 0.018 |
| 4 | NA | NA | NA |
| Gender | |||
| Female | 1277 | 0.61 (0.4–0.96) | 0.029 |
| Male | NA | NA | NA |
| Race | |||
| White | 928 | 9.29 (0.78–110.02) | 0.035 |
| Asian | 87 | 1109935981.52 (0‐Inf) | 0.27 |
| Black/African‐American | 213 | 0.52 (0.21–1.29) | 0.15 |
| Mutation burden | |||
| High | 574 | 0.53 (0.26–1.08) | 0.074 |
| Low | 584 | 0.65 (0.34–1.23) | 0.18 |
3.4. ACE2 was related to immune infiltration in BRCA
Substantial studies have reported that ACE2 plays key roles in immunity. 15 Therefore, we adopted the TIMER database for exploring the link between ACE2 expression and immune infiltration level in BRCA. From the results, we observed that ACE2 expression levels increased as the abundance of immune cells, including B cells, CD8+ T cells, CD4+ T cells, Neutrophils, and Dendritic cells, increased (Figure 6A, all p < 0.05). In addition, copy number mutation of ACE2 could partly inhibit the immune infiltration level of these immune cells except for B cells (Figure 6B). We then explored the link between ACE2 expression and the gene biomarkers of distinct immune cells in BRCA. The immune biomarkers of CD8+ T cells (CD8A and CD8B), T cells (CD3D, CD3E, and CD2), B cells (CD19 and CD79A), Monocytes (CD86), TAM (CCL2 and IL‐10), M1 Macrophages (INOS and COX2), M2 Macrophages (CD163 and MS4A4A), Neutrophils (CD66b and CCR7) NK cells (KIR2DL1, KIR2DL3, KIR2DL4, KIR3DL1, KIR3DL2, KIR3DL3, and KIR2DS4), Dendritic cell (HLA‐DQB1, HLA‐DRA, and BDCA‐4), Th1 (T‐bet, STAT4, STAT1, IFN‐g, and TNF‐a), Th2 (GATA3, STAT6, STAT5A, and IL13), Tfh (IL21), Th17 (IL17A), Treg (FOXP3, CCR8, STAT5B, and TGFb), T‐cell exhaustion (PD‐1, CTLA4, LAG3, and GZMB) were significantly associated with ACE2 expression level in BRCA after purity adjustment (Table 2). Thus, all these results suggest a strong relationship between ACE2 and immune infiltrating cells. Moreover, ACE2 expression may hold the key to the immune response in BRCA, indicating the potential of ACE2 as a target for BRCA immunotherapy.
FIGURE 6.
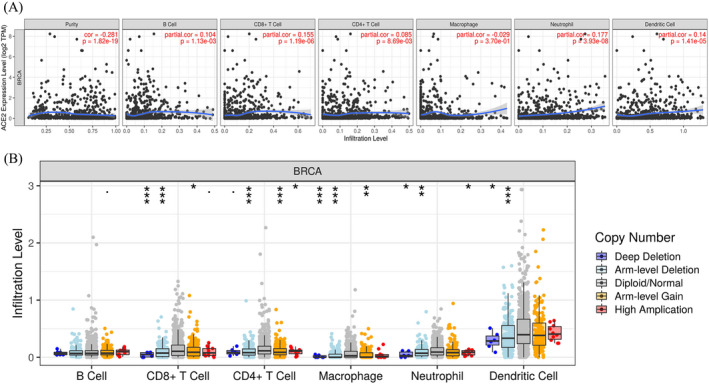
Correlation of ACE2 expression with immune infiltration level in BRCA (TIMER). (A) ACE2 expression is significantly negatively correlated to tumor purity and has significant positive correlations with infiltrating levels of B cells, CD8+ T cells, CD4+ T cells, neutrophils, and dendritic cells in BRCA, but not with that of macrophages. (B) Copy number mutation of ACE2 in BRCA could partly inhibit the immune infiltration level of CD8+ T cells, CD4+ T cells, neutrophils, macrophages, and dendritic cells, but not of B cells (p‐value Significant Codes: 0 ≤ *** <0.01 ≤ * <0.05≤. <0.1)
TABLE 2.
Correlation analysis between ACE2 and gene biomarkers of immune cells in BRCA (TIMER)
| Description | Biomarkers | None | Purity | ||
|---|---|---|---|---|---|
| Cor | p‐Value | Cor | p‐Value | ||
| CD8+ T cell | CD8A | 0.0226 | 3.36e‐14 | 0.116 | 2.42e‐04 |
| CD8B | 0.284 | 8.06e‐22 | 0.191 | 1.21e‐09 | |
| T cell (general) | CD3D | 0.265 | 3.54e‐19 | 0.146 | 3.67e‐06 |
| CD3E | 0.264 | 4.62e‐19 | 0.145 | 4.36e‐06 | |
| CD2 | 0.264 | 5.76e‐19 | 0.154 | 1.07e‐06 | |
| B cell | CD19 | 0.273 | 3.26e‐20 | 0.156 | 7.14e‐07 |
| CD79A | 0.283 | 9.33e‐22 | 0.163 | 2.43e‐07 | |
| Monocyte | CD86 | 0.148 | 7.71e‐07 | 0.06 | 5.69e‐02 |
| CD115(CSF1R) | 0.102 | 6.63e‐04 | ‐0.016 | 6.18e‐01 | |
| TAM | CCL2 | 0.293 | 3.09e‐23 | 0.228 | 3.48e‐13 |
| CD68 | 0.093 | 2.04e‐03 | 0.006 | 8.42e‐01 | |
| IL10 | 0.166 | 2.91e‐08 | 0.096 | 2.36e‐03 | |
| M1 Macrophage | INOS (NOS2) | 0.09 | 2.71e‐03 | 0.063 | 4.54e‐02 |
| IRF5 | 0.009 | 7.7e‐01 | ‐0.048 | 1.33e‐01 | |
| COX2(PTGS2) | 0.402 | 6.47e‐44 | 0.331 | 6.61e‐27 | |
| M2 Macrophage | CD163 | 0.173 | 7.7e‐09 | 0.11 | 5.06e‐04 |
| VSIG4 | 0.107 | 3.61e‐04 | 0.032 | 3.14e‐01 | |
| MS4A4A | 0.173 | 8.18e‐09 | 0.086 | 6.42e‐03 | |
| Neutrophils | CD66b (CEACAM8) | 0.069 | 2.17e‐02 | 0.074 | 2.02e‐02 |
| CD11b (ITGAM) | 0.066 | 2.94e‐02 | ‐0.021 | 5.03e‐01 | |
| CCR7 | 0.244 | 2.1e‐16 | 0.128 | 5.26e‐05 | |
| Natural killer cell | KIR2DL1 | 0.165 | 3.47e‐08 | 0.112 | 4.15e‐04 |
| KIR2DL3 | 0.188 | 3.39e‐10 | 0.115 | 2.74e‐04 | |
| KIR2DL4 | 0.273 | 2.83e‐20 | 0.207 | 4.17e‐11 | |
| KIR3DL1 | 0.188 | 3.42e‐10 | 0.114 | 3.34e‐04 | |
| KIR3DL2 | 0.234 | 3.92e‐15 | 0.15 | 2.08e‐06 | |
| KIR3DL3 | 0.125 | 3.08e‐05 | 0.092 | 3.75e‐03 | |
| KIR2DS4 | 0.219 | 2.34e‐13 | 0.151 | 1.79e‐06 | |
| Dendritic cell | HLA‐DPB1 | 0.138 | 4.11e‐06 | ‐0.017 | 5.89e‐01 |
| HLA‐DQB1 | 0.169 | 1.82e‐08 | 0.071 | 2.47e‐02 | |
| HLA‐DRA | 0.19 | 1.99e‐10 | 0.068 | 3.18e‐02 | |
| HLA‐DPA1 | 0.128 | 2.12e‐05 | ‐0.007 | 8.24e‐01 | |
| BDCA‐1(CD1C) | 0.179 | 2.28e‐09 | 0.032 | 3.13e‐01 | |
| BDCA‐4(NRP1) | 0.151 | 4.62e‐07 | 0.078 | 1.37e‐02 | |
| CD11c (ITGAX) | 0.118 | 9.11e‐05 | 0.003 | 9.35e‐01 | |
| Th1 | T‐bet (TBX21) | 0.285 | 5.55e‐22 | 0.185 | 4.10e‐09 |
| STAT4 | 0.303 | 8.14e‐25 | 0.201 | 1.5e‐10 | |
| STAT1 | 0.154 | 296e‐07 | 0.127 | 5.62e‐05 | |
| IFN‐g (IFNG) | 0.275 | 1.33e‐20 | 0.196 | 4.15e‐10 | |
| TNF‐a (TNF) | 0.172 | 9.72e‐09 | 0.123 | 9.83e‐05 | |
| Th2 | GATA3 | ‐0.553 | 4.88e‐89 | ‐0.522 | 1.69e‐70 |
| STAT6 | ‐0.112 | 2e‐04 | ‐0.151 | 1.80e‐06 | |
| STAT5A | 0.149 | 6.68e‐07 | 0.082 | 9.81e‐03 | |
| IL13 | 0.212 | 1.11e‐12 | 0.16 | 3.74e‐07 | |
| Tfh | BCL6 | 0.076 | 1.2e‐02 | 0.027 | 3.96e‐01 |
| IL21 | 0.202 | 1.28e‐11 | 0.15 | 2.06e‐06 | |
| Th17 | STAT3 | 0.036 | 2.37e‐01 | 0.017 | 6.01e‐01 |
| IL17A | 0.194 | 8e‐11 | 0.158 | 5.38e‐07 | |
| Treg | FOXP3 | 0.282 | 1.75e‐21 | 0.187 | 2.64e‐09 |
| CCR8 | 0.173 | 7.24e‐09 | 0.109 | 5.97e‐04 | |
| STAT5B | ‐0.061 | 4.27e‐02 | ‐0.093 | 3.49e‐03 | |
| TGFb (TGFB1) | ‐0.063 | 3.77e‐02 | ‐0.196 | 4.88e‐10 | |
| T cell exhaustion | PD‐1 (PDCD1) | 0.272 | 4.25e‐20 | 0.172 | 5.30e‐08 |
| CTLA4 | 0.326 | 1.4e‐28 | 0.244 | 5.67e‐15 | |
| LAG3 | 0.252 | 2.39e‐17 | 0.201 | 1.65e‐10 | |
| TIM‐3 (HAVCR2) | 0.087 | 3.98e‐03 | 0.002 | 9.39e‐01 | |
| GZMB | 0.356 | 4.06e‐34 | 0.281 | 1.83e‐19 | |
3.5. Prognostic value of ACE2 expression in BRCA
According to the results of section 3.4, ACE2 affects both the prognosis and the immune infiltration in BRCA. Moreover, immune infiltration affects BRCA prognosis. However, whether ACE2 affects the BRCA prognosis through immune infiltration is unknown. Hence, we adopted the KMPD for analyzing the BRCA prognosis on basis of the expression level of ACE2 in related immune cell subsets. The results revealed that ACE2 levels were enriched in basophils (HR = 0.56, p = 0.021) and CD8+ T‐cells (HR = 0.56, p = 0.03) and type‐2 T‐helper cells (HR = 0.48, p=0.02), which showed decreasing numbers and positively correlated with BRCA prognosis (Figure S1). However, there was no significant association between these factors in B cell, CD4+ memory T‐cell, eosinophils, macrophage, Mesenchymal stem cell, NK T‐cell, and regulatory and Type 1 helper T‐cells (Figure S2). Thus, the results indicate that ACE2 affects the prognosis of BRCA partly through immune infiltration.
3.6. Enrichment analysis of ACE2 in BRCA
According to the mRNA sequencing data of 1093 TCGA BRCA patients from LinkedOmics, we discovered that 8628 genes were positively correlated while 5817 genes were negatively correlated with ACE2 expression (Figure 7A–C). show the top 50 genes positively and negatively correlated with ACE2, respectively. GO enrichment analysis of ACE2 using GSEA revealed that terms related to adaptive immune response, regulation of innate immune response, cell chemotaxis, cell‐substrate junction, and receptor‐ligand activity were enriched (Figure 7D–F). Moreover, according to KEGG enrichment analysis, ACE2 was demonstrated to be involved in NF‐κB, IL‐17, and TNF signaling pathways (Figure 7G).
FIGURE 7.
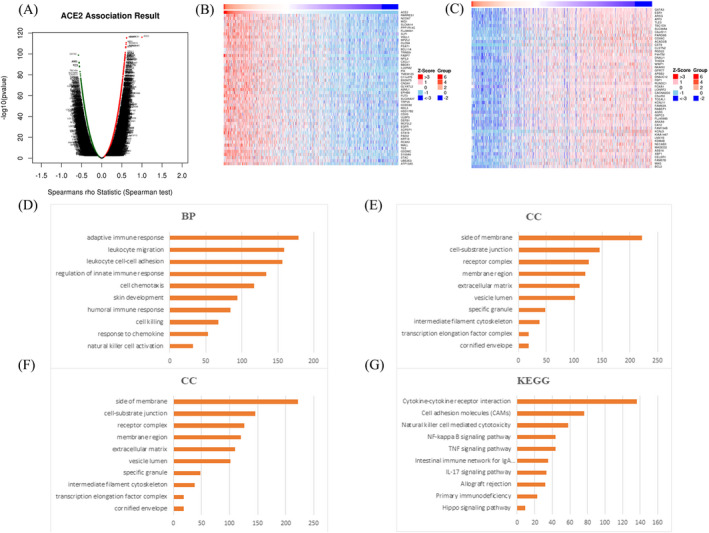
Genes related to ACE2 and enrichment analyses in BRCA (LinkedOmics). (A) Volcano plot showing ACE2 and associated genes’ expression in BRCA by using Spearman test (n = 1093). Dark red dots represent genes positively correlated with ACE2 and dark green dots represent genes negatively correlated with ACE2. (B) Heat map showing top 50 genes positively correlated with ACE2 in BRCA. (C) Heat map showing top 50 genes negatively correlated with ACE2 in BRCA
3.7. ACE2‐associated kinase, miRNA, or transcription factor targets in BRCA
Given the significance of ACE2 in BRCA, the kinase, miRNA, and transcription factor networks of ACE2 in BRCA were further analyzed with LinkedOmics by utilizing GSEA (Table 3). The top five most important kinase target networks were found to be Mitogen‐activated protein kinase 8 (MAPK8), Protein Kinase C Alpha (PRKCA), PAK3 (P21 (RAC1) Activated Kinase 3), PAK5 (P21 (RAC1) Activated Kinase 5), and Pyruvate Kinase M1/2 (PKM). The miRNA target network involved the following miRNAs: (ATGTACA) MIR‐493, (GTCAACC) MIR‐380‐5P, (ACAGGGT) MIR‐10A, and MIR‐10B, (TACTTGA) MIR‐26A and MIR‐26B, and (AATGTGA) MIR‐23A and MIR‐23B. The target network of transcription factors included V$IRF_Q6, V$NFKB_Q6_01, V$SRF_Q4, V$PBX1_02, and V$CEBPB_02.
TABLE 3.
The kinase, miRNA and transcription factor‐target networks of ACE2 in BRCA (LinkedOmics)
| Enriched category | Geneset | Leading Edge Numer | p Value |
|---|---|---|---|
| Kinase target | Kinase_MAPK8 | 14 | 0.0022075 |
| Kinase_PRKCA | 98 | 0.0031746 | |
| Kinase_PAK3 | 7 | 0.0031746 | |
| Kinase_PAK5 | 7 | 0.0046729 | |
| Kinase_PKM | 2 | 0.0054054 | |
| miRNA target | ATGTACA, MIR‐493 | 63 | 0 |
| GTCAACC, MIR‐380‐5P | 8 | 0.0030769 | |
| ACAGGGT, MIR‐10A, MIR‐10B | 38 | 0.0047619 | |
| TACTTGA, MIR‐26A, MIR‐26B | 73 | 0.012739 | |
| AATGTGA, MIR‐23A, MIR‐23B | 86 | 0.014553 | |
| Transcription factor target | V$IRF_Q6 | 74 | 0 |
| V$NFKB_Q6_01 | 56 | 0 | |
| V$SRF_Q4 | 78 | 0 | |
| V$PBX1_02 | 28 | 0 | |
| V$CEBPB_02 | 54 | 0 |
3.8. Validation of the expression and prognostic value of ACE2 in breast cancer
qRT‐PCR was performed to verify the expression and prognostic value of ACE2 in breast cancer using the clinical tissues from Taizhou First People's Hospital (N = 52). As shown in Figure 8A, ACE2 was downregulated in breast cancer versus normal tissues (p < 0.001). Moreover, OS analysis indicated a better prognosis in breast cancer patients with high ACE2 expression (p < 0.001, Figure 8B). As shown in Figure 8C,D, the univariate and multivariate analysis also demonstrated ACE2 expression and clinical stage as independent prognostic factors for breast cancer. These data further confirm the prognostic value of ACE2 in BRCA.
FIGURE 8.
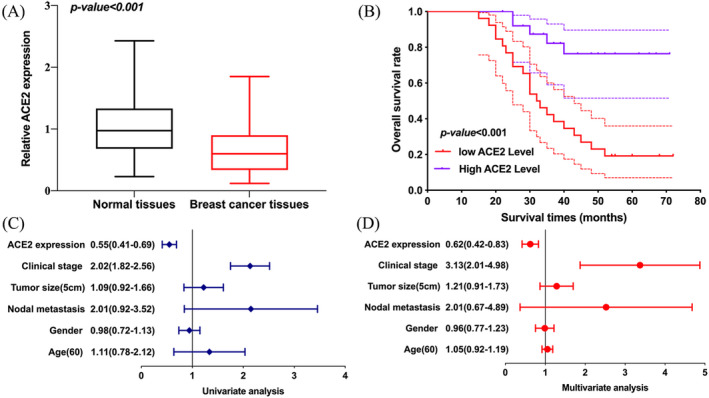
The expression and prognosis value of ACE2 in breast cancer. (A) The relative expression of ACE2 in breast cancer tissues versus normal tissues. (B) Overall survival curve of high and low ACE2 expression group. (C and D) Univariate and multivariate analysis considering clinical parameters and ACE2 expression in breast cancer
4. DISCUSSION
Recent studies have reported that ACE2 levels negatively correlate with tumor grade and the ability to metastasize. 16 In UCEC (Uterine Corpus Endometrial Carcinoma) and KIRP (Kidney Renal Papillary Cell Carcinoma), ACE2 expression shows a positive correlation with the prognosis, accompanied by elevated immune cell infiltration levels. 17 As for SARS‐CoV‐2 infection, ACE2 together with TMPRSS2 acts as a receptor for host cell entry. 18 In this study, Oncomine and UALCAN databases were used to assess ACE2 expression levels. RFS and OS survival analyses were performed in the KMPD. We also explored the interaction between ACE2 expression and immune cell infiltration via the TIMER database. Moreover, the LinkedOmics database was utilized for enrichment analyses.
From the results, we observed that ACE2 expression levels decreased in breast cancer, especially BRCA. ACE2 may serve as a probable prognosis factor for BRCA, partly by affecting immune infiltration. ACE2 performs both positive and negative roles in cancer therapies. Low ACE2 expression level is commonly a sign of cancer presence along with diabetes. 19 In several cancers such as pancreatic, lung, colon, and breast cancers, ACE2 inhibits metastasis and angiogenesis. 20 Specifically, in hepatocellular carcinoma (HCC) patients, increased ACE2 expression reflects a longer survival time compared to those with decreased ACE2 expression, which implies the prognosis role of ACE2 in HCC. 21 Likewise, ACE2 has been pointed out as a prognostic factor in gallbladder carcinoma. 22 Several other factors including age, gender, and health status of cancer patients need to be considered as well. 23
The human epidermal growth factor receptor (HER2), estrogen receptor (ER), and progesterone receptor (PR) are the most meaningful classical biomarkers in all breast cancer patients. 24 Moreover, BRCA1 and BRCA2 are genomic markers, encoding large proteins acting as tumor suppressor products that affect transcription and regulate the cell cycle, thus protecting DNA during replication. BRCA1/2 mutations are responsible for almost half of hereditary breast cancers. 25 Immune infiltration largely influences the prognosis and clinical outcome of breast cancer. T regulatory cells (Tregs), M0 macrophages, and M2 macrophages, contributing to tumorigenesis, are associated with a poor prognosis regardless of ER status. M1 macrophages are anti‐tumoral and M2 macrophages are pro‐tumoral. Lack of immune infiltration is correlated to the worst prognosis of ER‐negative breast cancer and intermediate prognosis of ER‐positive disease. 26
Our KEGG enrichment analysis of ACE2 in BRCA showed that IL‐17 and NF‐κB signaling pathways are of major importance. IL‐17 family proteins (IL17A to IL17F), secreted by T helper 17 (Th17) cells, are effective in several inflammatory diseases and tumors. 27 IL‐17 cytokines family can activate the production of NF‐κB, IL8, IL6, TNF‐α, and IL1b, contributing to various inflammatory diseases and cancers. 28 Recently, another study shows that high expression of IL17B and its receptor IL17RB relates to poor prognosis of breast cancer patients. 29 Moreover, Protein kinase C α (PKCα) has been reported to contribute to the metastasis and aggravation of breast cancer. Specifically, high expression levels of PKCα and FOX2 are found in TNBC tumors. 30 Activation of PKCα is reported to enhance the internalization of HER2. 31 In breast cancer patients, miR‐23A is involved in the regulation of autophagy pathways, implying a future potential therapeutic target and biomarker. 32
To explore the reasons for reduced ACE2 expression in BRCA, we investigated the DNA methylation level of ACE2 in BRCA. Usually, high expression levels of ACE2 in tumors, including colon adenocarcinoma (COAD), Kidney renal papillary cell carcinoma (KIRP), pancreatic cancer (PAAD), rectal adenocarcinoma (READ), and lung adenocarcinoma (LUAD), are always accompanied by low DNA methylation level of ACE2. 33 Surprisingly, in our study, the ACE2 expression level was found to decrease after DNA promoter methylation. ACE2 may be inactivated and downregulated due to hypermethylation, which may partly explain the decreased ACE2 expression in BRCA.
Our study had a few limitations. First, most analyses were performed at the mRNA level but not at the protein and gene level. Furthermore, our results need to be validated by performing in vivo and in vitro experiments. In addition, histochemistry staining should be performed to verify the expression of ACE2 in BRCA.
5. CONCLUSION
In conclusion, ACE2 expression declined in BRCA, which to some extent resulted from ACE2 methylation. ACE2 exhibited good prognostic value and was associated with better RFS and immune infiltration in BRCA. Thus, ACE2 may serve as a potential biomarker and therapeutic target for BRCA.
CONFLICT OF INTEREST
The authors declare no conflicts of interests.
Supporting information
Figure S1
Figure S2
ling J, Peng N, luo L. ACE2 maybe serve as a prognostic biomarker in breast invasive carcinoma. J Clin Lab Anal. 2022;36:e24362. doi: 10.1002/jcla.24362
DATA AVAILABILITY STATEMENT
The analyzed datasets generated during the study are available from the corresponding author on reasonable request.
REFERENCES
- 1. Harbeck N, Penault‐Llorca F, Cortes J, et al. Breast cancer. Nat Rev Dis Primers. 2019;5(1):66. [DOI] [PubMed] [Google Scholar]
- 2. Bray F, Ferlay J, Soerjomataram I, Siegel RL, Torre LA, Jemal A. Global cancer statistics 2018: GLOBOCAN estimates of incidence and mortality worldwide for 36 cancers in 185 countries. CA Cancer J Clin. 2018;68(6):394‐424. [DOI] [PubMed] [Google Scholar]
- 3. Kuchenbaecker KB, Hopper JL, Barnes DR, et al. Risks of breast, ovarian, and contralateral breast cancer for BRCA1 and BRCA2 mutation carriers. JAMA. 2017;317(23):2402‐2416. [DOI] [PubMed] [Google Scholar]
- 4. Goetz MP, Gradishar WJ, Anderson BO, et al. NCCN guidelines insights: breast cancer, version 3.2018. J Natl Compr Canc Netw. 2019;17(2):118‐126. [DOI] [PubMed] [Google Scholar]
- 5. Desmedt C, Salgado R, Fornili M, et al. Immune infiltration in invasive lobular breast cancer. J Natl Cancer Inst. 2018;110(7):768‐776. [DOI] [PMC free article] [PubMed] [Google Scholar]
- 6. Jing Y, Run‐Qian L, Hao‐Ran W, et al. Potential influence of COVID‐19/ACE2 on the female reproductive system. Mol Hum Reprod. 2020;26(6):367‐373. [DOI] [PMC free article] [PubMed] [Google Scholar]
- 7. Donoghue M, Hsieh F, Baronas E, et al. A novel Angiotensin‐Converting Enzyme‐related Carboxypeptidase (ACE2) converts angiotensin I to angiotensin 1–9. Circ Res. 2000;87(5):E1‐E9. [DOI] [PubMed] [Google Scholar]
- 8. Anguiano L, Riera M, Pascual J, Soler MJ. Circulating ACE2 in cardiovascular and kidney diseases. Curr Med Chem. 2017;24(30):3231‐3241. [DOI] [PubMed] [Google Scholar]
- 9. Zhang Q, Lu S, Li T, et al. ACE2 inhibits breast cancer angiogenesis via suppressing the VEGFa/VEGFR2/ERK pathway. J Exp Clin Cancer Res. 2019;38(1):173. [DOI] [PMC free article] [PubMed] [Google Scholar]
- 10. Zhou L, Li Y, Li Z, Huang Q. Mining therapeutic and prognostic significance of STATs in renal cell carcinoma with bioinformatics analysis. Genomics. 2020;112(6):4100‐4114. [DOI] [PubMed] [Google Scholar]
- 11. Zeng Q, Sun S, Li Y, Li X, Li Z, Liang H. Identification of therapeutic targets and prognostic biomarkers among CXC chemokines in the renal cell carcinoma microenvironment. Front Oncol. 2019;9:1555. [DOI] [PMC free article] [PubMed] [Google Scholar]
- 12. Györffy B, Lanczky A, Eklund AC, et al. An online survival analysis tool to rapidly assess the effect of 22,277 genes on breast cancer prognosis using microarray data of 1,809 patients. Breast Cancer Res Treat. 2010;123(3):725‐731. [DOI] [PubMed] [Google Scholar]
- 13. Liang F, Liang H, Li Z, Huang P. JAK3 is a potential biomarker and associated with immune infiltration in kidney renal clear cell carcinoma. Int Immunopharmacol. 2020;86:106706. [DOI] [PubMed] [Google Scholar]
- 14. Vasaikar SV, Straub P, Wang J, Zhang B. LinkedOmics: analyzing multi‐omics data within and across 32 cancer types. Nucleic Acids Res. 2018;46(D1):D956‐D963. [DOI] [PMC free article] [PubMed] [Google Scholar]
- 15. Li Y, Zhou W, Yang L, You R. Physiological and pathological regulation of ACE2, the SARS‐CoV‐2 receptor. Pharmacol Res. 2020;157:104833. [DOI] [PMC free article] [PubMed] [Google Scholar]
- 16. Yu C, Tang W, Wang Y, et al. Downregulation of ACE2/Ang‐(1–7)/Mas axis promotes breast cancer metastasis by enhancing store‐operated calcium entry. Cancer Lett. 2016;376(2):268‐277. [DOI] [PubMed] [Google Scholar]
- 17. Yang J, Li H, Hu S, Zhou Y. ACE2 correlated with immune infiltration serves as a prognostic biomarker in endometrial carcinoma and renal papillary cell carcinoma: implication for COVID‐19. Aging (Albany NY). 2020;12(8):6518‐6535. [DOI] [PMC free article] [PubMed] [Google Scholar]
- 18. Hoffmann M, Kleine‐Weber H, Schroeder S, et al. SARS‐CoV‐2 cell entry depends on ACE2 and TMPRSS2 and Is blocked by a clinically proven protease inhibitor. Cell. 2020;181(2):271‐280 e278. [DOI] [PMC free article] [PubMed] [Google Scholar]
- 19. Pedersen KB, Chodavarapu H, Porretta C, Robinson LK, Lazartigues E. Dynamics of ADAM17‐mediated shedding of ACE2 applied to pancreatic islets of male db/db mice. Endocrinology. 2015;156(12):4411‐4425. [DOI] [PMC free article] [PubMed] [Google Scholar]
- 20. Xu J, Fan J, Wu F, et al. The ACE2/Angiotensin‐(1–7)/mas receptor axis: pleiotropic roles in cancer. Front Physiol. 2017;8:276. [DOI] [PMC free article] [PubMed] [Google Scholar]
- 21. Ye G, Qin Y, Lu X, et al. The association of renin‐angiotensin system genes with the progression of hepatocellular carcinoma. Biochem Biophys Res Commun. 2015;459(1):18‐23. [DOI] [PubMed] [Google Scholar]
- 22. Li J, Yang ZL, Ren X, et al. ACE2 and FZD1 are prognosis markers in squamous cell/adenosquamous carcinoma and adenocarcinoma of gallbladder. J Mol Histol. 2014;45(1):47‐57. [DOI] [PubMed] [Google Scholar]
- 23. van Dam PA, Huizing M, Mestach G, et al. SARS‐CoV‐2 and cancer: are they really partners in crime? Cancer Treat Rev. 2020;89:102068. [DOI] [PMC free article] [PubMed] [Google Scholar]
- 24. Braunstein LZ, Taghian AG. Molecular phenotype, multigene assays, and the locoregional management of breast cancer. Semin Radiat Oncol. 2016;26(1):9‐16. [DOI] [PubMed] [Google Scholar]
- 25. Venkitaraman AR. Cancer susceptibility and the functions of BRCA1 and BRCA2. Cell. 2002;108(2):171‐182. [DOI] [PubMed] [Google Scholar]
- 26. Ali HR, Chlon L, Pharoah PD, Markowetz F, Caldas C. Patterns of immune infiltration in breast cancer and their clinical implications: a gene‐expression‐based retrospective study. PLoS Medicine. 2016;13(12):e1002194. [DOI] [PMC free article] [PubMed] [Google Scholar]
- 27. McGeachy MJ, Cua DJ, Gaffen SL. The IL‐17 family of cytokines in health and disease. Immunity. 2019;50(4):892‐906. [DOI] [PMC free article] [PubMed] [Google Scholar]
- 28. De Simone V, Franze E, Ronchetti G, et al. Th17‐type cytokines, IL‐6 and TNF‐alpha synergistically activate STAT3 and NF‐kB to promote colorectal cancer cell growth. Oncogene. 2015;34(27):3493‐3503. [DOI] [PMC free article] [PubMed] [Google Scholar]
- 29. Alinejad V, Dolati S, Motallebnezhad M, Yousefi M. The role of IL17B‐IL17RB signaling pathway in breast cancer. Biomed Pharmacother. 2017;88:795‐803. [DOI] [PubMed] [Google Scholar]
- 30. Pham TND, Perez White BE, Zhao H, Mortazavi F, Tonetti DA. Protein kinase C alpha enhances migration of breast cancer cells through FOXC2‐mediated repression of p120‐catenin. BMC Cancer. 2017;17(1):832. [DOI] [PMC free article] [PubMed] [Google Scholar]
- 31. Jeong J, Choi J, Kim W, et al. Inhibition of ezrin causes PKCalpha‐mediated internalization of erbb2/HER2 tyrosine kinase in breast cancer cells. J Biol Chem. 2019;294(3):887‐901. [DOI] [PMC free article] [PubMed] [Google Scholar]
- 32. Gu J, Wang Y, Wang X, et al. Effect of the LncRNA GAS5‐MiR‐23a‐ATG3 axis in regulating autophagy in patients with breast cancer. Cell Physiol Biochem. 2018;48(1):194‐207. [DOI] [PubMed] [Google Scholar]
- 33. Chai P, Yu J, Ge S, Jia R, Fan X. Genetic alteration, RNA expression, and DNA methylation profiling of Coronavirus Disease 2019 (COVID‐19) receptor ACE2 in malignancies: a pan‐cancer analysis. J Hematol Oncol. 2020;13(1):43. [DOI] [PMC free article] [PubMed] [Google Scholar]
Associated Data
This section collects any data citations, data availability statements, or supplementary materials included in this article.
Supplementary Materials
Figure S1
Figure S2
Data Availability Statement
The analyzed datasets generated during the study are available from the corresponding author on reasonable request.


