Abstract
The interplay between light receptors and PHYTOCHROME-INTERACTING FACTORs (PIFs) serves as a regulatory hub that perceives and integrates environmental cues into transcriptional networks of plants1,2. Although occupancy of the histone variant H2A.Z and acetylation of histone H3 have emerged as regulators of environmentally responsive gene networks, how these epigenomic features interface with PIF activity is poorly understood3–7. By taking advantage of rapid and reversible light-mediated manipulation of PIF7 subnuclear localization and phosphorylation, we simultaneously assayed the DNA-binding properties of PIF7, as well as its impact on chromatin dynamics genome wide. We found that PIFs act rapidly to reshape the H2A.Z and H3K9ac epigenetic landscape in response to a change in light quality. Furthermore, we discovered that PIFs achieve H2A.Z removal through direct interaction with EIN6 ENHANCER (EEN), the Arabidopsis thaliana homolog of the chromatin remodeling complex subunit INO80 Subunit 6 (Ies6). Thus, we describe a PIF–INO80 regulatory module that is an intermediate step for allowing plants to change their growth trajectory in response to environmental changes.
Light transmitted and reflected from neighboring plants is enriched in far-red (FR) light and shifts the equilibrium of the photoreceptor phyB towards its inactive form8–10. Thus, competing vegetation can be simulated by reducing the red (R) to FR light ratio, while keeping the photosynthetically active radiation constant11,12. We utilized this low R:FR light condition to assess hypocotyl elongation in pif multiple mutant combinations (up to a pif1 pif3 pif4 pif5 pif7 quintuple mutant (pif13457)), as well as in phyB mutants (Fig. 1a,b). Our analysis confirmed that PIF7 was the major growth regulator followed by PIF4 and 5, while mutations in PIF1 and 3 had only marginal influence on hypocotyl elongation in low R:FR light (Fig. 1a,b). Overexpressed PIF7 is rapidly dephosphorylated after low R:FR light exposure and induces hypocotyl growth already in white light (WL)13. To be able to analyze a more switch-like and light-quality-dependent PIF7 activity, we introduced a MYC-tagged PIF7 genomic fragment into the pif457 triple mutant (pif457 PIF7:PIF7:4xMYC) that fully complemented the hypocotyl elongation phenotypes of pif457 and phyB pif457 mutants (Extended Data Fig. 1a,b). Immunoblot analyses revealed that PIF7 is phosphorylated throughout a long day (LD) cycle in WL-grown seedlings and was most abundant at Zeitgeber time (ZT) 4. However, during the night, PIF7 levels were relatively low (Fig. 1c and Extended Data Fig. 1c,d). Upon exposure to low R:FR light, loss of phosphorylated PIF7 protein was observed at all time points, and also in WL-exposed phyB pif457 PIF7:PIF7:4xMYC mutant lines (Fig. 1c,d and Extended Data Fig. 1c,d). Additionally, in nuclei of cotyledon epidermal cells of WL-grown seedlings, PIF7 was colocalized with phyB in discrete photobodies. Interestingly, this photobody localization was abolished and PIF7 dispersed in the nucleoplasm after 30 min of low R:FR treatment or in phyB mutants (Fig. 1e,f and Extended Data Fig. 1e). Altogether, these data indicate that phyB-dependent phosphorylation and photobody localization of PIF7 are functionally linked and revoked by low R:FR to induce PIF7 activity.
Fig. 1 |. Role of PIF7 and phyB in low R:FR–induced hypocotyl growth.
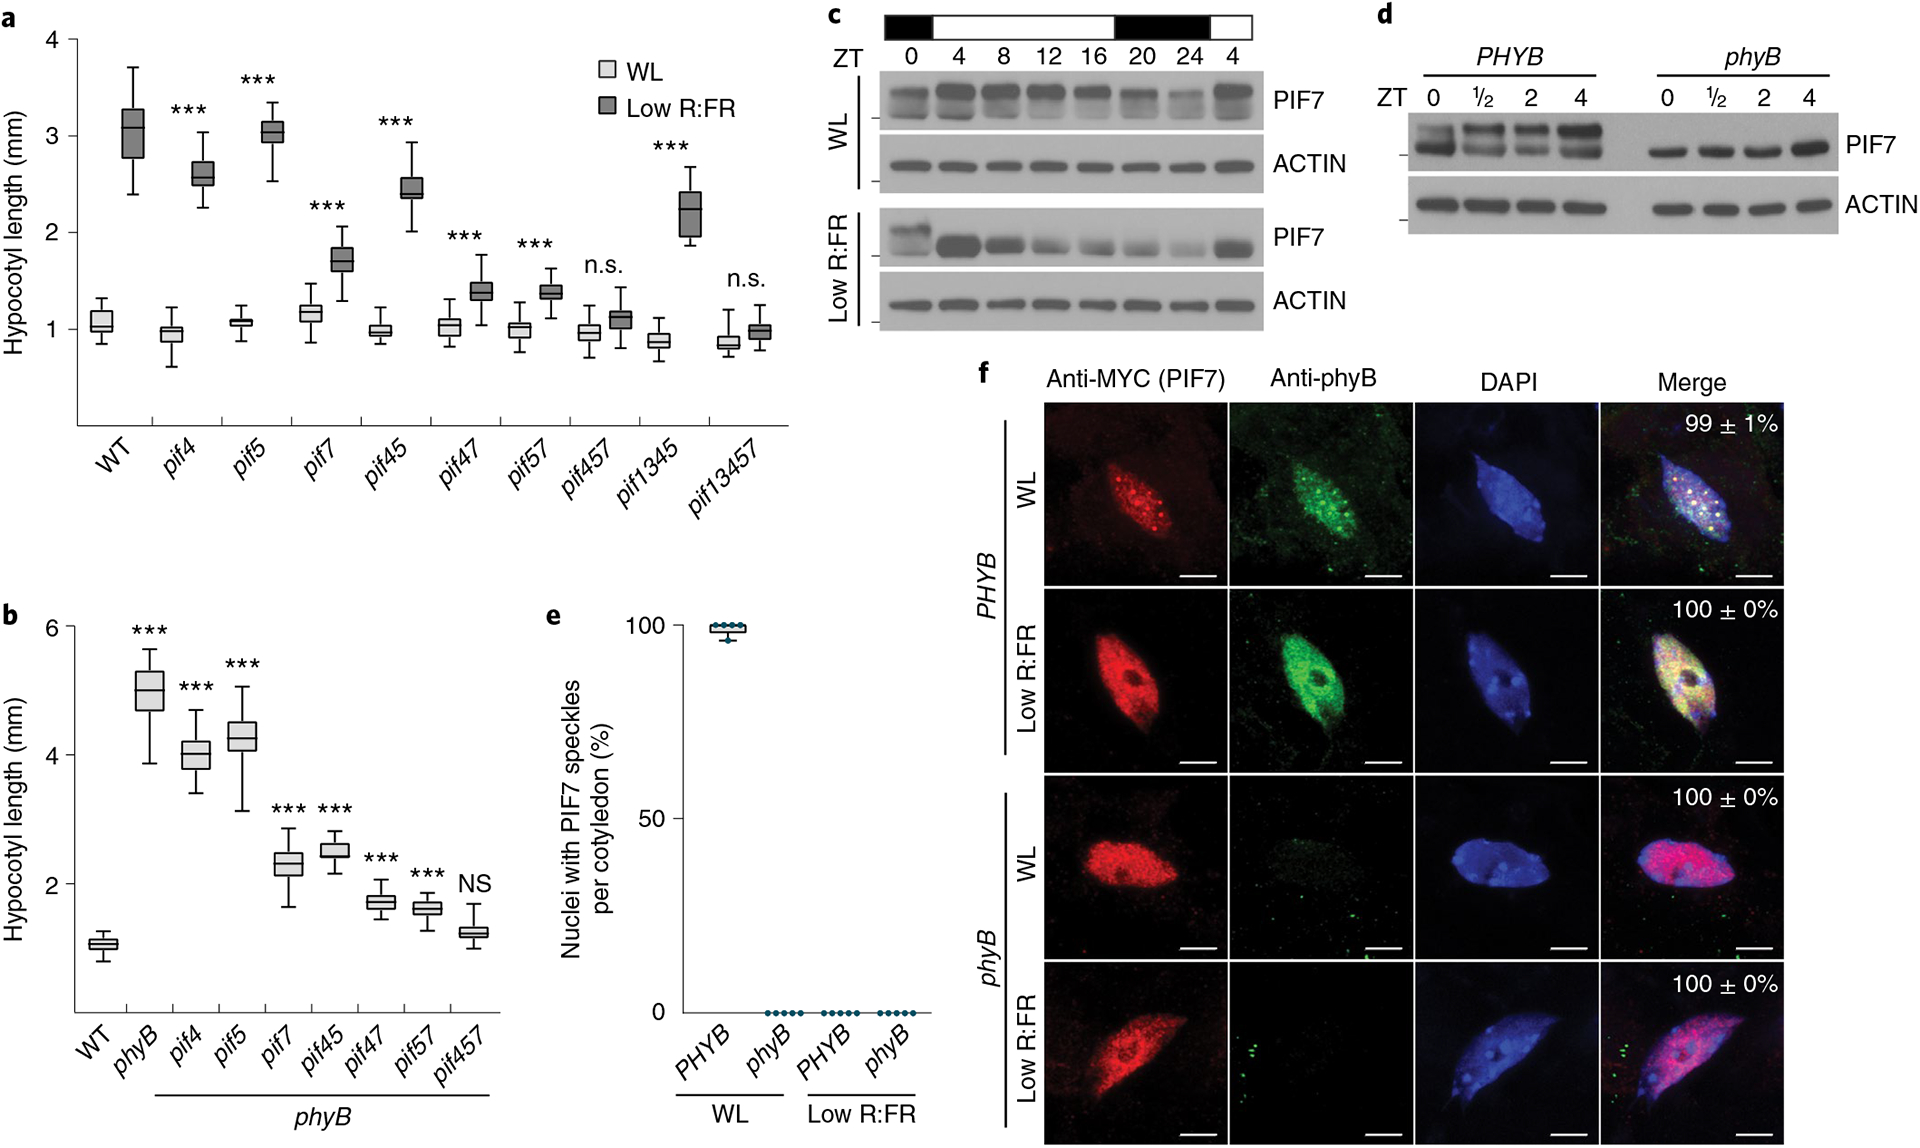
a,b, Hypocotyl length measurements. WT (n = 23/20, P < 0.001), pif4 (n = 27/22, P < 0.001), pif5 (n = 22/24, P < 0.001), pif7 (n = 23/24, P < 0.001), pif45 (n = 27/26, P < 0.001), pif47 (n = 26/28, P < 0.001), pif57 (n = 25/25, P < 0.001), pif457 (n = 25/24, P = 0.275), pif1345 (n = 21/16, P < 0.001) and pif13457 (n = 23/22, P = 0.494) seedlings grown in WL or in response to low R:FR (a) and WT (n = 22), phyB (n = 22, P < 0.001), phyB pif4 (n = 21, P < 0.001), phyB pif5 (n = 26, P < 0.001), phyB pif7 (n = 22, P < 0.001), phyB pif45 (n = 20, P < 0.001), phyB pif47 (n = 22, P < 0.001), phyB pif57 (n = 26, P < 0.001) and phyB pif457 (n = 27, P = 0.218) seedlings grown in WL (b). Stars denote statistically significant differences between light conditions (a) or between WT and mutants (b) (two-way analysis of variance (ANOVA) (a) or one-way ANOVA (b), Tukey’s multiple comparisons test, n.s. (not significant) P > 0.05, *P ≤ 0.05, **P ≤ 0.01, ***P ≤ 0.001). c, Immunoblot of pif457 PIF7:PIF7:4xMYC in LD. Six-day-old seedlings continued to grow in WL or where exposed to low R:FR at ZT0. Marks next to cropped blots represent 50 kDa (PIF7:4xMyC) or 37 kDa (ACTIN), respectively. d, Immunoblot analysis of pif457 PIF7:PIF7:4xMYC and phyB pif457 PIF7:PIF7:4xMYC seedlings (6-day-old, LD, WL). Marks next to cropped blots represent 50 kDa (PIF7:4xMyC) or 37 kDa (ACTIN), respectively. e, Quantification of percentages of nuclei with PIF7:4xMyc nuclear bodies as shown in f. Five seedlings from each condition with at least 15 randomly selected nuclei per seedling were examined. f, Subnuclear localization patterns of PIF7:4xMyc and phyB in cotyledon epidermal nuclei of 6-day-old pif457 PIF7:PIF7:4xMYC and phyB pif457 PIF7:PIF7:4xMYC seedlings grown in LD. Seedlings were fixed at ZT4 (WL) or after a subsequent 30 min low R:FR treatment. PIF7:4xMyC (red) and phyB (green) were labeled by immunolocalization using anti-MyC and anti-phyB antibodies, respectively. Nuclei were stained with DAPI (blue). The percentage of nuclei with the indicated pattern, including s.e.m., is shown in merged images; n indicates the number of nuclei analyzed. Scale bar, 5 μm. In a, b and e, boxes extend from the 25th to 75th percentiles. Middle lines represent medians. Whiskers extend to the smallest and largest values, respectively.
On the basis of these findings, we examined the impact of low R:FR exposure on the genome-wide DNA binding of PIF7 at ZT4 and revealed 998 significant binding events using ChIP–seq (Supplementary Tables 1 and 2). As previously reported for other PIF ChIP experiments14–18, PIF7 preferentially bound to G-boxes (CACGTG) (Fig. 2a). About 30% of PIF7-binding events occurred in proximal (1,000 base pair (bp)) promoter regions (Fig. 2b) and more than 100 transcription factor genes are directly targeted, indicating a large PIF7-initiated transcription factor network (Fig. 2c).
Fig. 2 |. Low R:FR exposure induces genome-wide binding of PIF7.
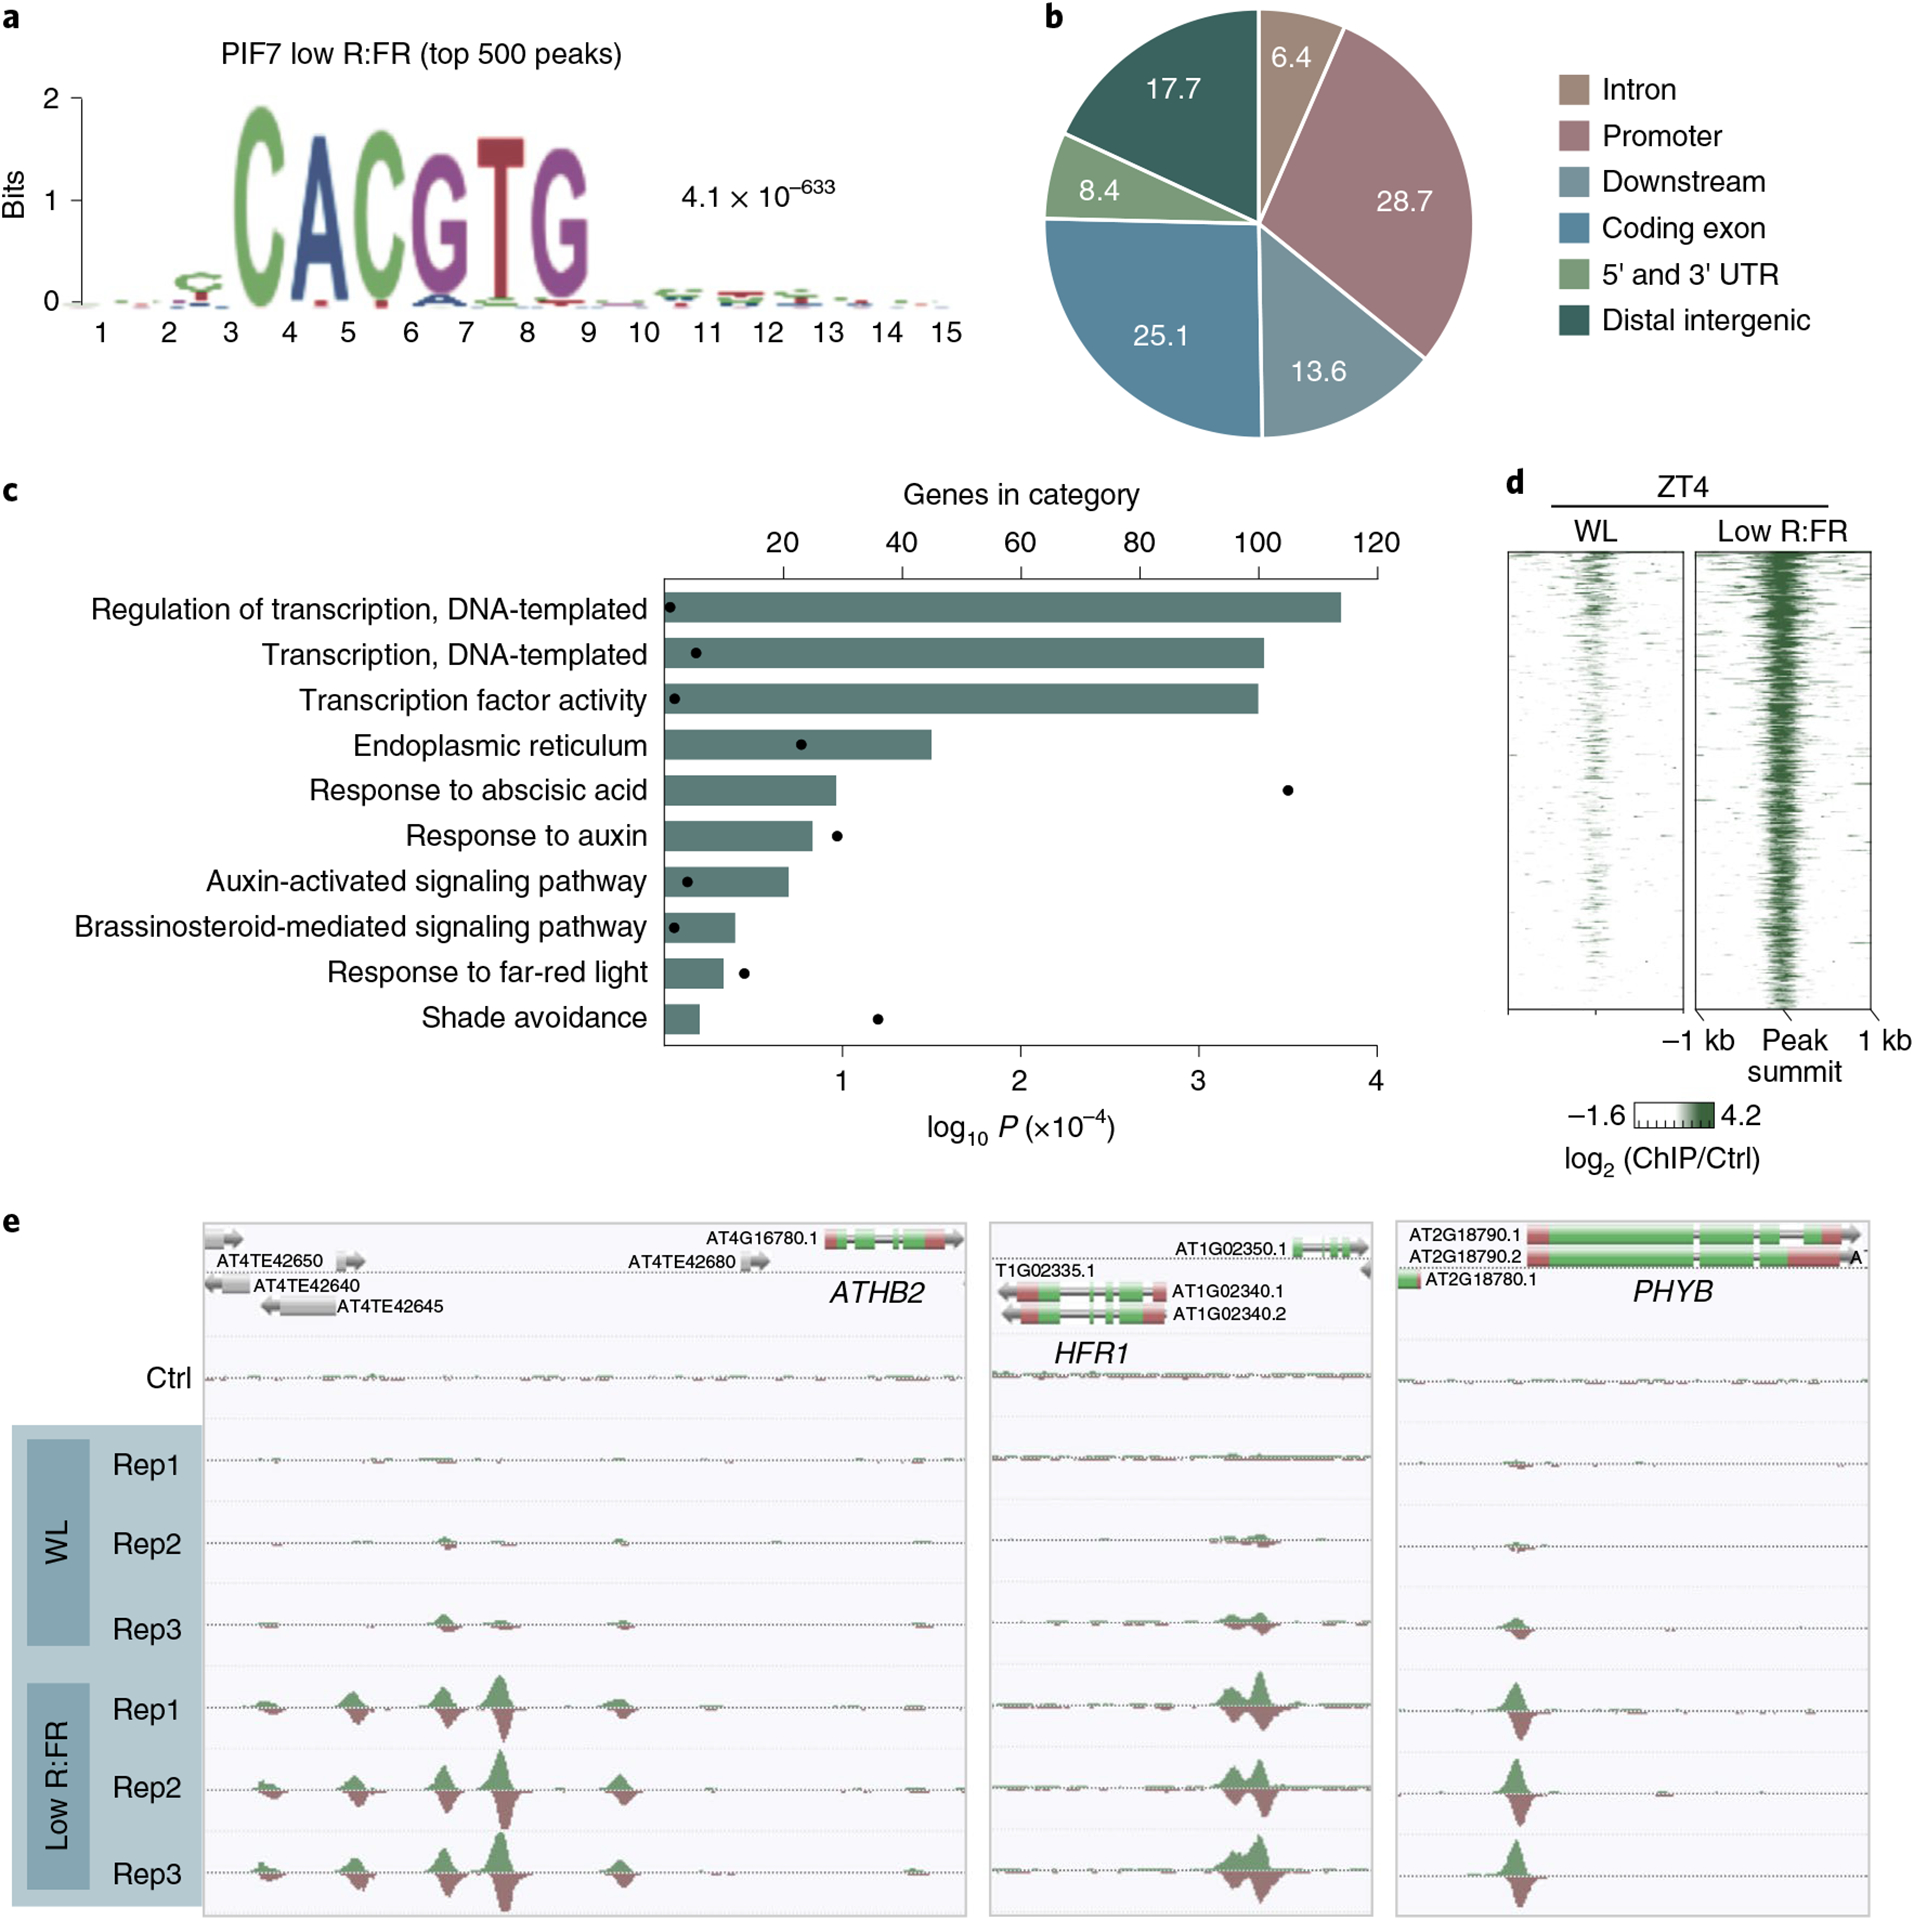
a, The CACGTG motif was the top-ranked motif in PIF7 ChIP–seq derived from low R:FR–exposed pif457 PIF7:PIF7:4xMYC seedlings at ZT4. Motif discovery was done through MEME analysis using the 500 top-ranked peaks. b, Pie chart illustrating the genomic distribution of PIF7-binding events after low R:FR exposure at ZT4. Numbers are proportions in percent. c, Gene ontology enrichment analysis reveals an enrichment for auxin signaling in the 500 top-ranked PIF7 targets. d, Heat map visualizing the low R:FR–induced DNA binding (log2 (fold change)) of PIF7 in pif457 PIF7:PIF7:4xMYC seedlings at ZT4. PIF7 DNA binding is shown for the top 500 binding sites that display the strongest low R:FR–induced PIF7 binding at ZT4 with each row of the heat map representing one binding event. kb, kilobase. e, AnnoJ genome browser screenshot visualizing PIF7 binding at ATHB2, HFR1 and PHYB. All tracks were normalized to the respective sequencing depth. Shown are three replicates (Rep1 to Rep3) per treatment. Ctrl, control.
In contrast to low R:FR light, only very weak PIF7 DNA binding could be detected in WL conditions (Fig. 2d,e and Extended Data Fig. 1f), supporting the idea that PIF7 dephosphorylation and its release from photobodies is required for its DNA binding. Among the genes with the strongest PIF7 binding is the transcription factor ATHB2, which mediates growth in low R:FR conditions19. As part of negative feedback loops, PIF7 also targets the PIF repressors HFR1 (ref.20) as well as PHYB (Fig. 2e). These results demonstrate the light-quality-dependent control of PIF7 phosphorylation, localization and DNA-binding capacity.
Next, our analysis focused on the histone variant H2A.Z, which has an intricate but relatively unclear functional relationship with PIF transcription factors3,4. We investigated, in particular, the reduction of H2A.Z, since gene-body-localized H2A.Z represses gene expression in Arabidopsis and is removed from chromatin in response to various environmental stimuli5–7. We examined the impact of low R:FR exposure on the H2A.Z landscape in LD via ChIP–seq. In line with previous studies5–7, H2A.Z was specifically enriched in gene bodies of up to 20,411 protein-coding genes (Extended Data Fig. 2a and Supplementary Table 3). H2A.Z occupancy was highly responsive to low R:FR treatment, with up to 1,194 genes at dusk (ZT16) showing a low R:FR–induced H2A.Z reduction (Fig. 3a,b and Supplementary Table 3). Only a small overlap (ZT0 versus ZT8: 31 genes; ZT0 versus ZT16: 32 genes; ZT8 versus ZT16: 61 genes) was found between genes that displayed a low R:FR–induced decrease of H2A.Z at ZT0, ZT8 and ZT16 (Fig. 3a,b). This indicates that the diurnal cycle and low R:FR exposure affect global H2A.Z occupancy, as demonstrated by the H2A.Z cycling pattern observed for the flowering regulator COL5 (ref.21) (Extended Data Fig. 2b,c). To lessen the influence of the diurnal cycle on H2A.Z dynamics, wild type (WT) seedlings were grown in constant light and exposed to low R:FR light for up to 2 hours. This was followed by an additional WL phase to capture H2A.Z recovery dynamics (Extended Data Fig. 2d). We found that low R:FR–elicited gene activation was accompanied by H2A.Z reduction, whereas low R:FR–induced gene repression did not coincide with H2A.Z incorporation (Fig. 3c,d and Supplementary Tables 2 and 4). This low R:FR–induced H2A.Z loss was reversible and disappeared after 2 hours of WL recovery (Fig. 3d). Interestingly, the gene that displayed the most dynamic H2A.Z pattern was ATHB2 (Fig. 3e and Supplementary Table 4). After only 30 min of low R:FR exposure, H2A.Z levels at ATHB2 were sharply depleted, but rapidly recovered to normal levels during the WL recovery phase (Fig. 3e). A similar H2A.Z pattern was observed for a set of genes (top 50) with the strongest low R:FR–induced H2A.Z removal (Fig. 3e). These results clearly emphasize the suitability of the approach used for studying light-quality-dependent H2A.Z dynamics.
Fig. 3 |. Low R:FR light exposure controls genome-wide H2A.Z occupancy.
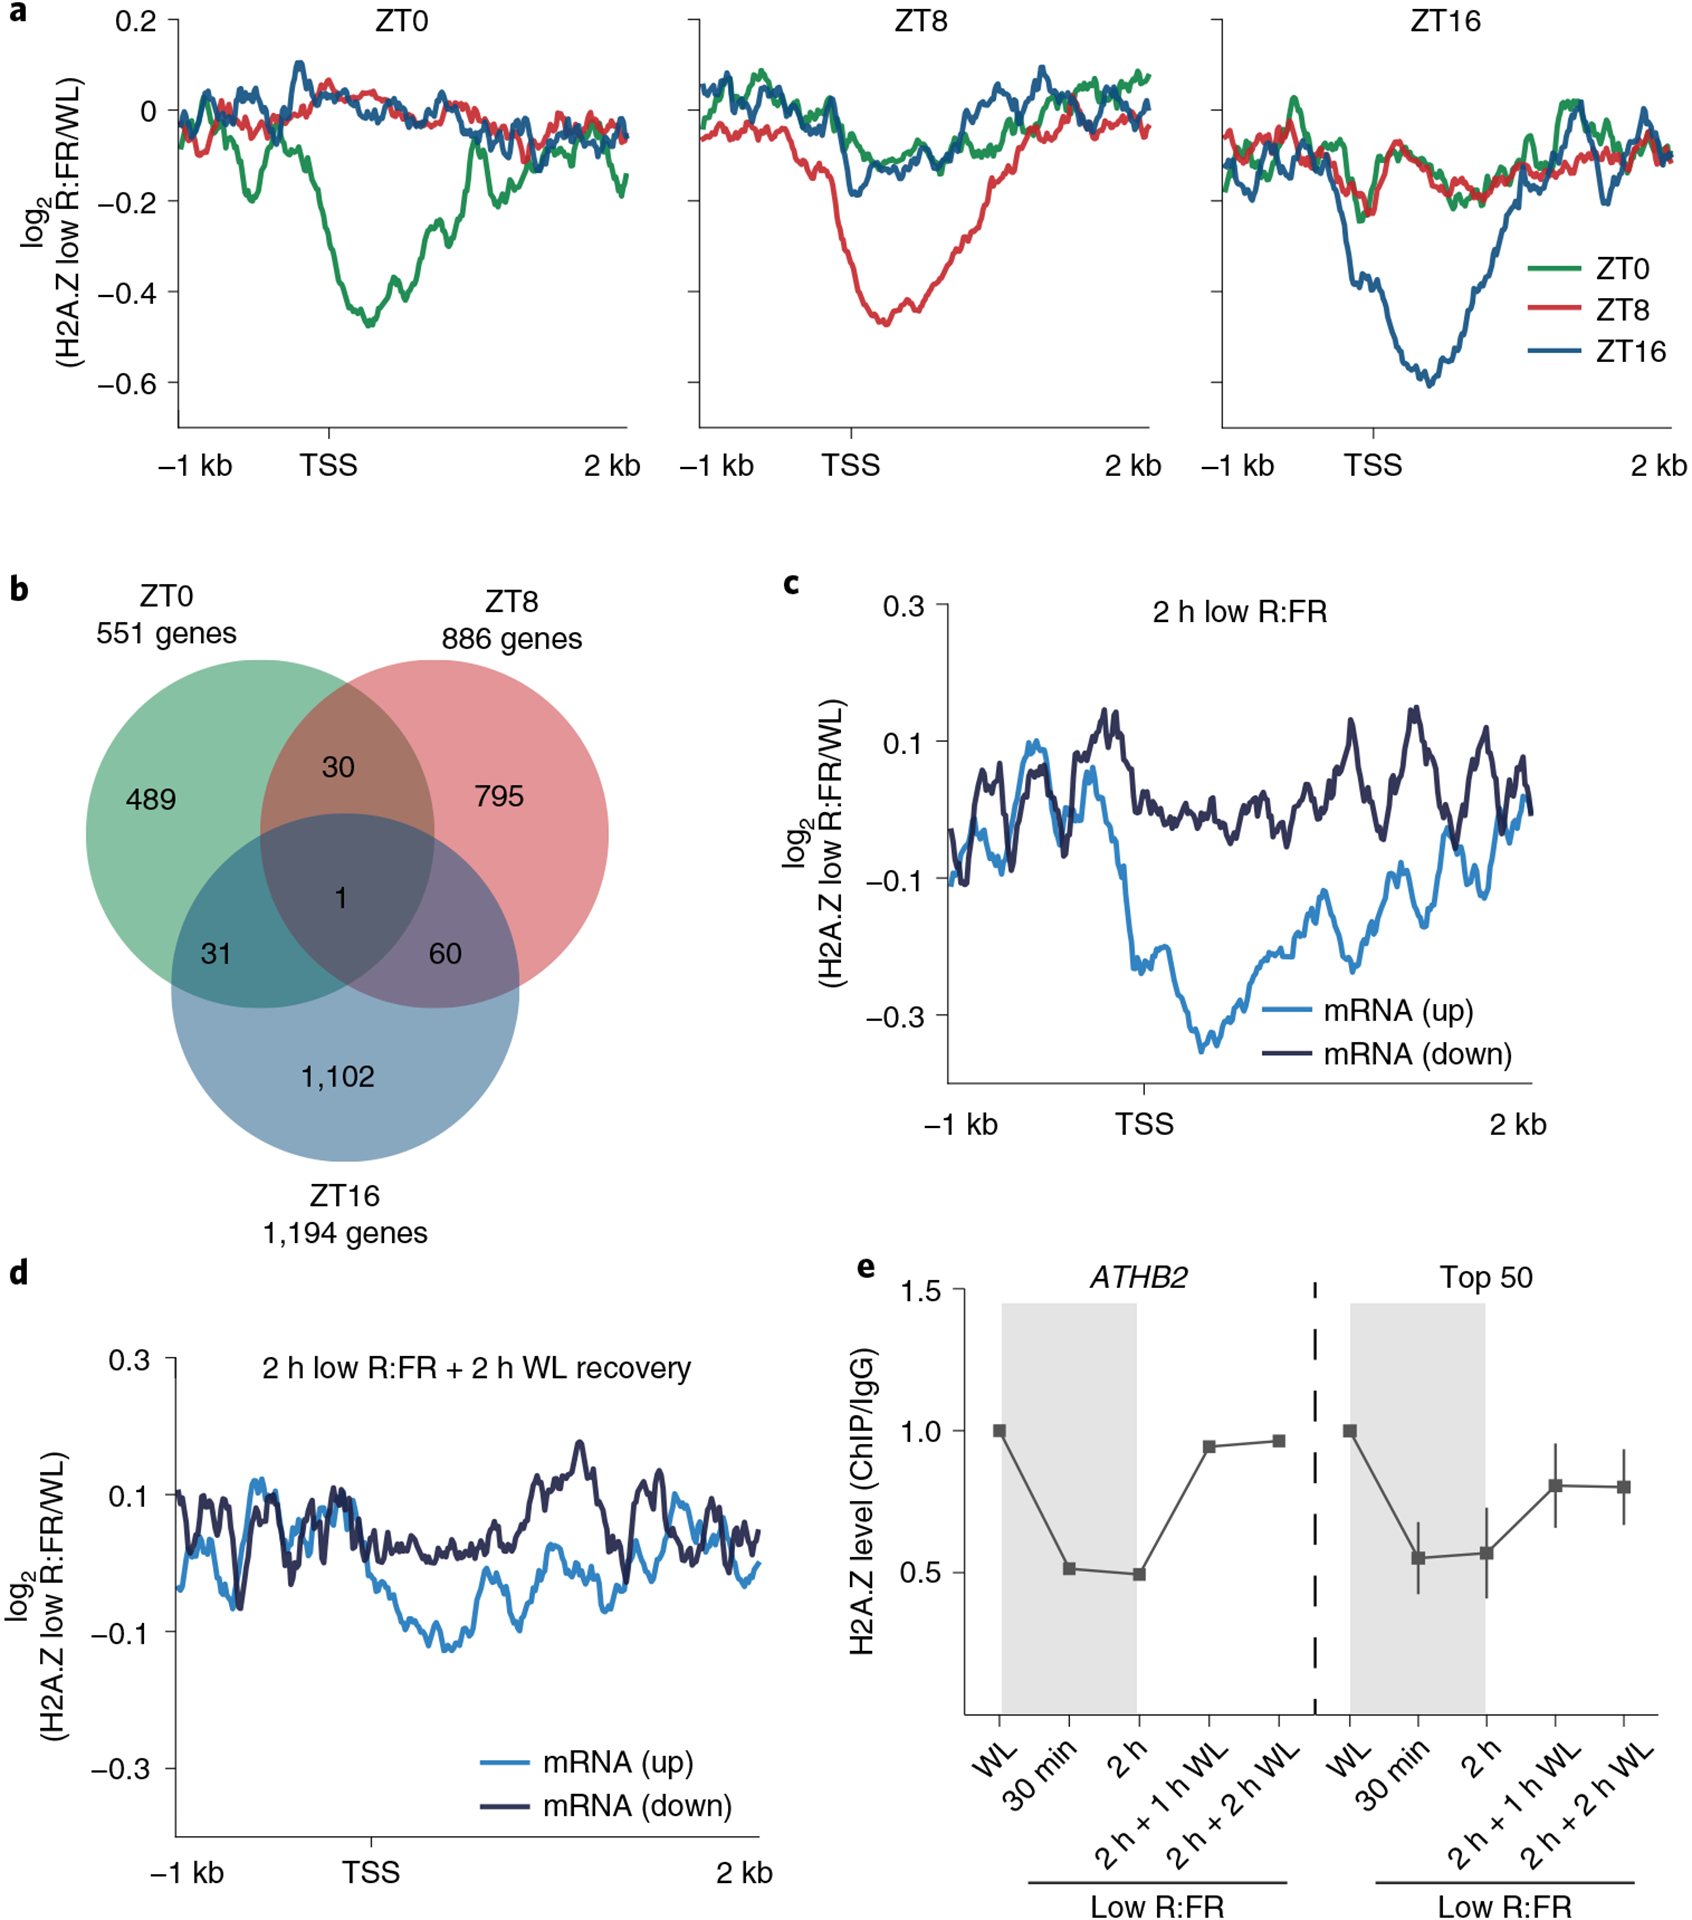
a, Aggregated profiles visualizing low R:FR–induced H2A.Z removal at ZT0, ZT8 and ZT16 in WT seedlings. Reduction of H2A.Z is visualized from 1 kb upstream to 2 kb downstream of the transcription start site (TSS). Low R:FR–induced H2A.Z loss was calculated as the log2 (fold change) between WL and low R:FR–exposed H2A.Z ChIP–seq samples. Genes that show ≥1.3-fold low R:FR–induced H2A.Z depletion at ZT0 (551 genes), ZT8 (886 genes) and ZT16 (1,194 genes) were included in our analysis. b, Venn diagram showing overlap between genes that show low R:FR–induced H2A.Z depletion (≥1.3-fold) at ZT0, ZT8 and ZT16. c,d, Aggregated profiles visualizing low R:FR–induced H2A.Z loss and incorporation after 2 hours of low R:FR exposure (c) and after an additional two-hour-long WL recovery phase (d). Profiles are shown for genes that are differentially expressed after 2 hours of low R:FR exposure. e, Quantification of H2A.Z levels at the gene body of ATHB2 and the 50 genes (top 50) that show the strongest H2A.Z loss after 2 hours of low R:FR exposure. Occupancy of H2A.Z was determined by ChIP–seq and calculated as the ratio between H2A.Z and IgG. H2A.Z levels of WL-exposed seedlings were set to 1. Error bars represent s.e.m. (n = 50).
To test the role of PIFs in facilitating low R:FR–induced H2A.Z depletion, we profiled H2A.Z occupancy in pif457 triple mutants. Low R:FR–induced H2A.Z removal at the most dynamic genes was strongly compromised in pif457 seedlings (Fig. 4a, Extended Data Fig. 3a and Supplementary Table 4). This indicates that PIFs regulate low R:FR–induced H2A.Z reduction. The finding that exposure to low R:FR light for only 15 min was sufficient to trigger PIF-dependent H2A.Z removal (Fig. 4a and Extended Data Fig. 3a) suggested that DNA binding by PIF7 might occur even earlier. To test this, PIF7 DNA binding in parallel with H2A.Z occupancy and messenger RNA expression was examined at even shorter low R:FR exposures (5, 10 and 30 min). Immunoblots revealed that only 5 min of treatment with low R:FR light was sufficient to trigger PIF7 dephosphorylation (Fig. 4b), which correlated with a rapid increase in PIF7 DNA binding (Fig. 4c,d, Extended Data Fig. 3b,c and Supplementary Tables 2 and 5). We next assessed H2A.Z occupancy on a set of 20 genes (PIF7 core genes) that show the strongest PIF7 binding and activated expression (Supplementary Tables 2 and 5). This analysis revealed similar kinetics of low R:FR–induced PIF7 binding and gene body H2A.Z removal at the PIF7 core gene set (Fig. 4d–f). The observation that H2A.Z loss precedes changes in gene expression indicated that chromatin remodeling is not a consequence of transcriptional activation (Fig. 4e,f). Although our experimental resolution was not able to temporally unravel PIF7 DNA binding from H2A.Z removal, our observation of a compromised low R:FR–induced H2A.Z reduction in pif457 triple mutants (Fig. 4a and Extended Data Fig. 3a) supports a scenario where low R:FR–induced PIF7 binding is a prerequisite for H2A.Z loss and subsequent gene activation.
Fig. 4 |. DNA binding of PIF7 initiates low R:FR–induced H2A.Z removal at its target genes.
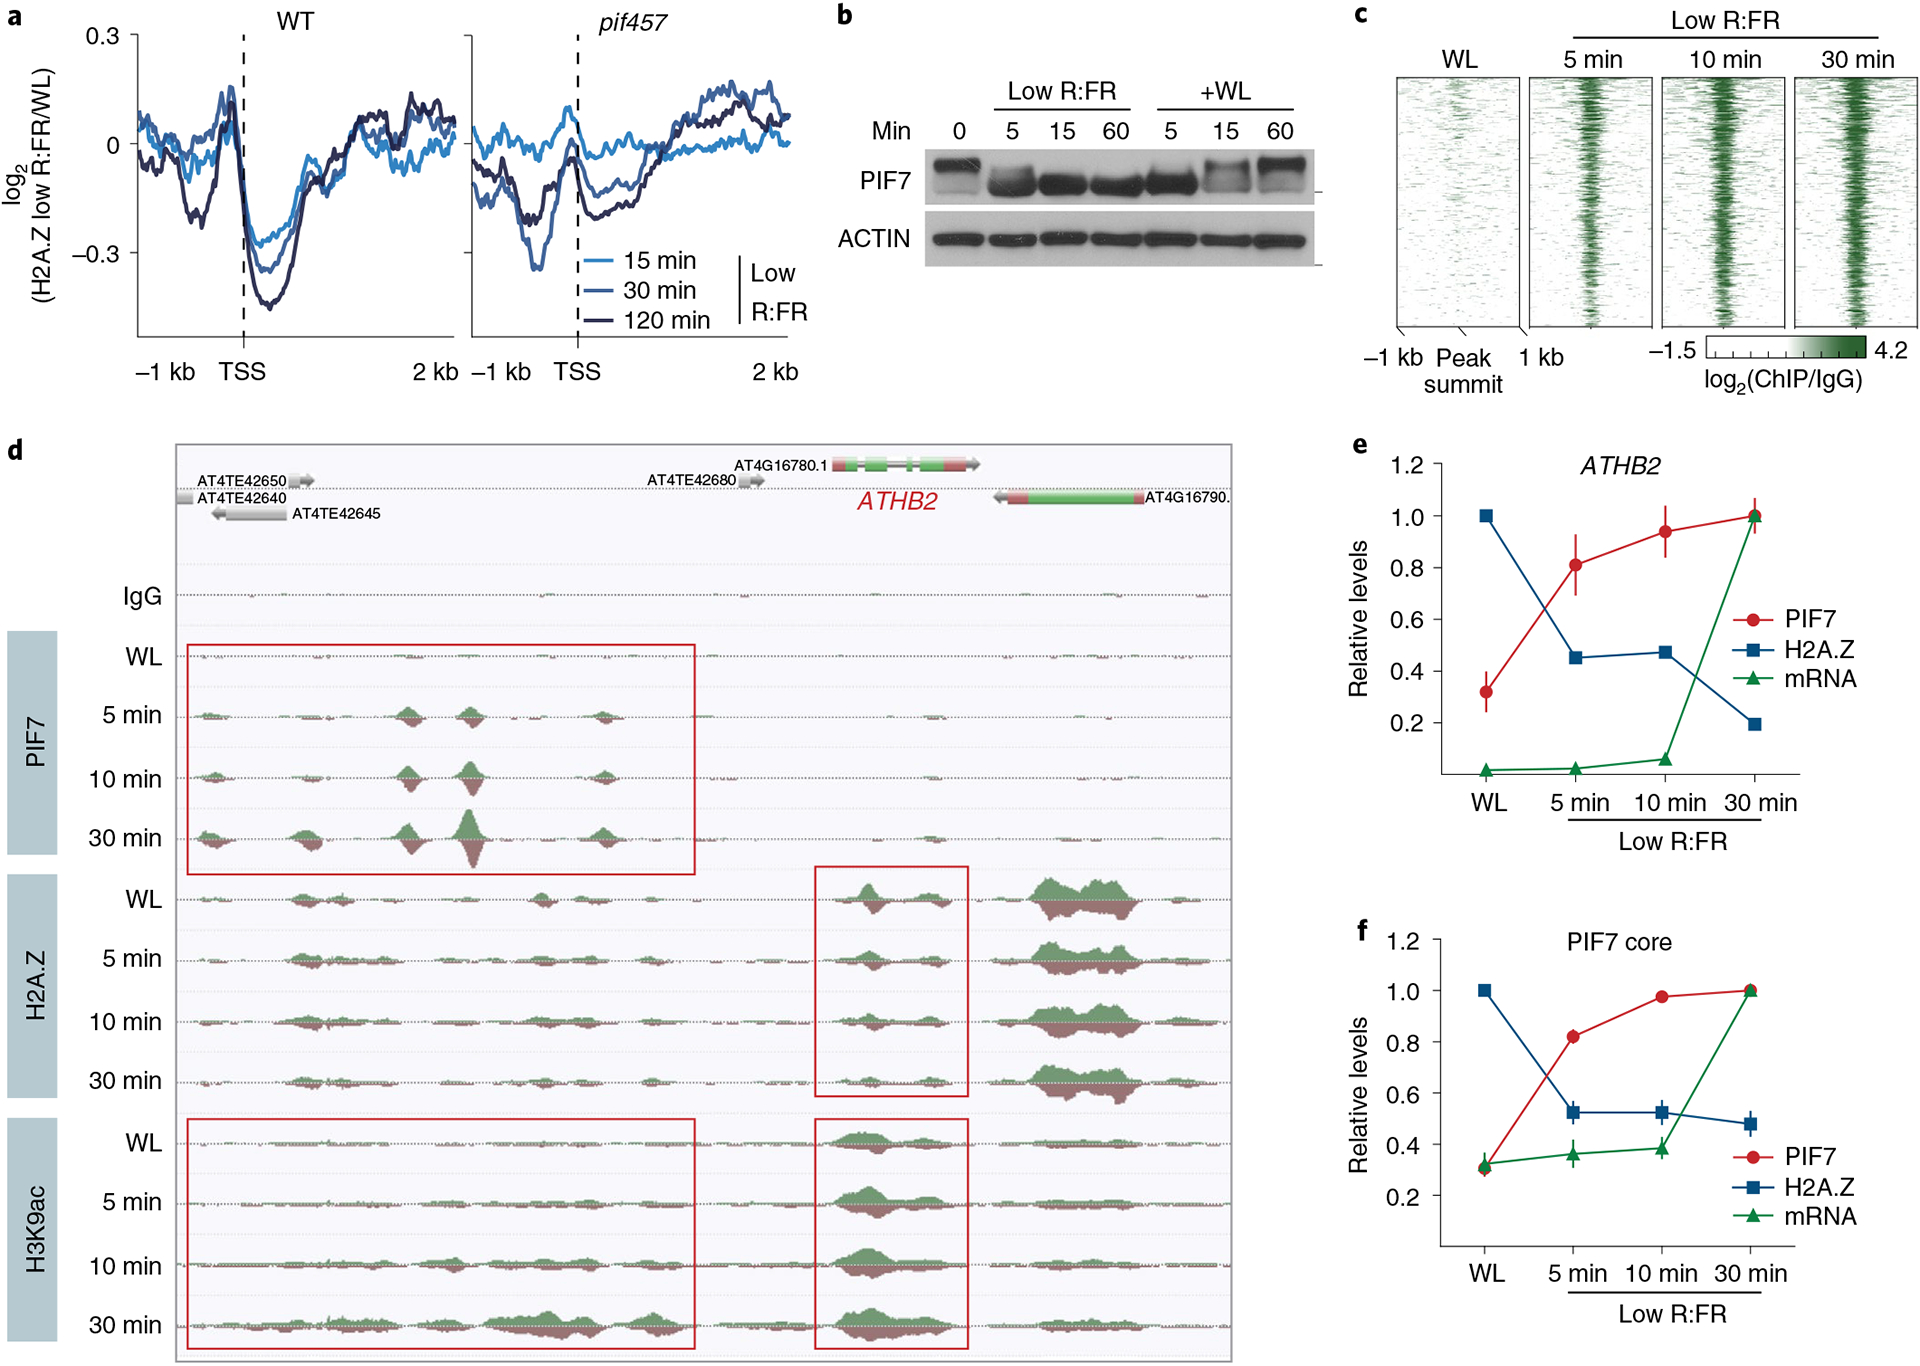
a, Aggregated profiles display low R:FR–induced H2A.Z depletion in WT and pif457 seedlings. Loss of H2A.Z is visualized as the log2 (fold change) between WL and low R:FR–exposed H2A.Z ChIP–seq samples around the TSS of 200 genes that show strong H2A.Z loss in WT after 2 hours of low R:FR light exposure. b, Immunoblot of pif457 PIF7:PIF7:4xMYC grown in constant WL. Six-day-old seedlings were exposed to low R:FR and subsequently moved back to WL for the indicated time points. Marks next to cropped blots represent 50 kDa (PIF7:4xMyC) or 37 kDa (ACTIN), respectively. c, Heat map visualizing the low R:FR–induced DNA binding (log2 (fold change)) of PIF7 at the top 500 binding sites (strongest binding after 30 min of low R:FR exposure) in pif457 PIF7:PIF7:4xMYC seedlings at the indicated time points. d, AnnoJ genome browser screenshot visualizing PIF7 binding, H2A.Z occupancy and H3K9 acetylation at the ATHB2 gene over time, which was determined in the same chromatin (pif457 PIF7:PIF7:4xMYC) by ChIP–seq. The areas marked in red indicate the PIF7-bound regulatory region and gene body region of ATHB2. e,f, Quantification of relative PIF7 binding (red) and H2A.Z levels (blue) at ATHB2 (e) and the PIF7 core gene set (f). PIF7 binding in peak summit regions (ratio between two PIF7 ChIP–seq replicates and control) at 30 min of low R:FR exposure was set to 1 for each target gene. H2A.Z occupancy (ratio between H2A.Z ChIP–seq sample and control) at WL exposure was set to 1. mRNA expression measured in TPM (transcripts per kilobase million) at 30 min of low R:FR exposure was set to 1 for each gene. The mean ± s.e.m. in e represents levels of PIF7 (n = 2), H2A.Z (n = 2) and ATHB2 mRNA (n = 3). The mean ± s.e.m. in f represents levels of PIF7 binding, H2A.Z occupancy and mRNA expression of the PIF7 core genes (n = 20 genes examined over two independent experiments).
Next, we expanded our analyses to the global occupancy of acetylated histone H3 lysine 9 (H3K9ac), a histone modification that is usually associated with gene activation22,23. Our analysis revealed that low R:FR exposure leads to an increase (≥1.2-fold) of gene-body-localized H3K9ac at 1,181 genes (Extended Data Fig. 4a and Supplementary Table 6). We also discovered a previously unknown low R:FR–induced H3K9 hyperacetylation pattern in regulatory regions of PIF7 target genes, specifically at ATHB2. This pattern was conserved at related HD-Zip transcription factors (ATHB4, HAT2, HAT3) (Extended Data Fig. 4b,c), intensified over the length of low R:FR exposure and occurred adjacent to PIF7-binding sites (Extended Data Fig. 4b,c). We also profiled H3K9ac in WL and low R:FR–exposed WT and pif457 seedlings at ZT4. Low R:FR exposure also induced H3K9ac in gene bodies of low R:FR–responsive genes in LD conditions, which was strongly compromised in pif457 triple mutants (Extended Data Fig. 4d and Supplementary Table 6). Moreover, pif457 seedlings showed reduced H3K9 acetylation in regulatory regions of ATHB2, ATHB4, HAT2 and HAT3 (Extended Data Fig. 4b,e), which shows that PIFs are required for full H3K9 acetylation of gene bodies and regulatory regions. Taken together, these results clearly show that DNA-bound PIF transcription factors shape the local chromatin environment in a light-quality-dependent manner.
In humans, yeast and Arabidopsis, H2A.Z removal is facilitated by the SWI/SNF-type ATP-dependent chromatin remodeler INO80 (refs.7,24–27). In addition, the histone chaperone ANP32E was reported to mediate H2A.Z removal in humans28,29. While mutants of the closest sequence homolog of ANP32E displayed no phenotype, ino80 mutants showed a significantly shorter hypocotyl after low R:FR exposure (Fig. 5a). Similar phenotypes were also observed in other INO80 complex subunit mutants, including ARP5 (arp5) and EEN (een), as well as in ino80 een double mutants (Fig. 5a and Extended Data Fig. 5a). We then tested diverse INO80 subunits in pull-downs and discovered EEN as a PIF-interacting protein (Extended Data Fig. 5b), which was confirmed by further in vitro and in vivo studies (Fig. 5b,c). Moreover, the een mutant partially suppressed the PIF-dependent long hypocotyl phenotype of phyB (Fig. 5d), and overexpression of EEN was able to complement the een mutant hypocotyl phenotype (Extended Data Fig. 5c). Although een mutants show no impact on the global H2A.Z landscape7 (Extended Data Fig. 5d,e), they are compromised in the stimulus-induced removal of H2A.Z7. Therefore, we captured H2A.Z dynamics in response to low R:FR light in een and pif457 mutants at ZT4 and found that low R:FR–induced H2A.Z removal was indeed compromised in both mutants (Fig. 5e, Extended Data Fig. 5f and Supplementary Tables 2 and 6). Moreover, expression of the human INO80C complemented the impaired hypocotyl elongation of een mutants in low R:FR (Extended Data Fig. 5g). Additionally, like its Arabidopsis ortholog, INO80C was able to interact with PIFs (Extended Data Fig. 5h). Collectively, our results show that the cooperative activity of PIFs and the INO80 complex directly controls the global H2A.Z landscape in Arabidopsis (Fig. 5f), but also suggests that this transcription factor–INO80 cooperation is conserved in other organisms.
Fig. 5 |. A PIF7–INO80 regulatory module facilitates low R:FR–induced H2A.Z removal.
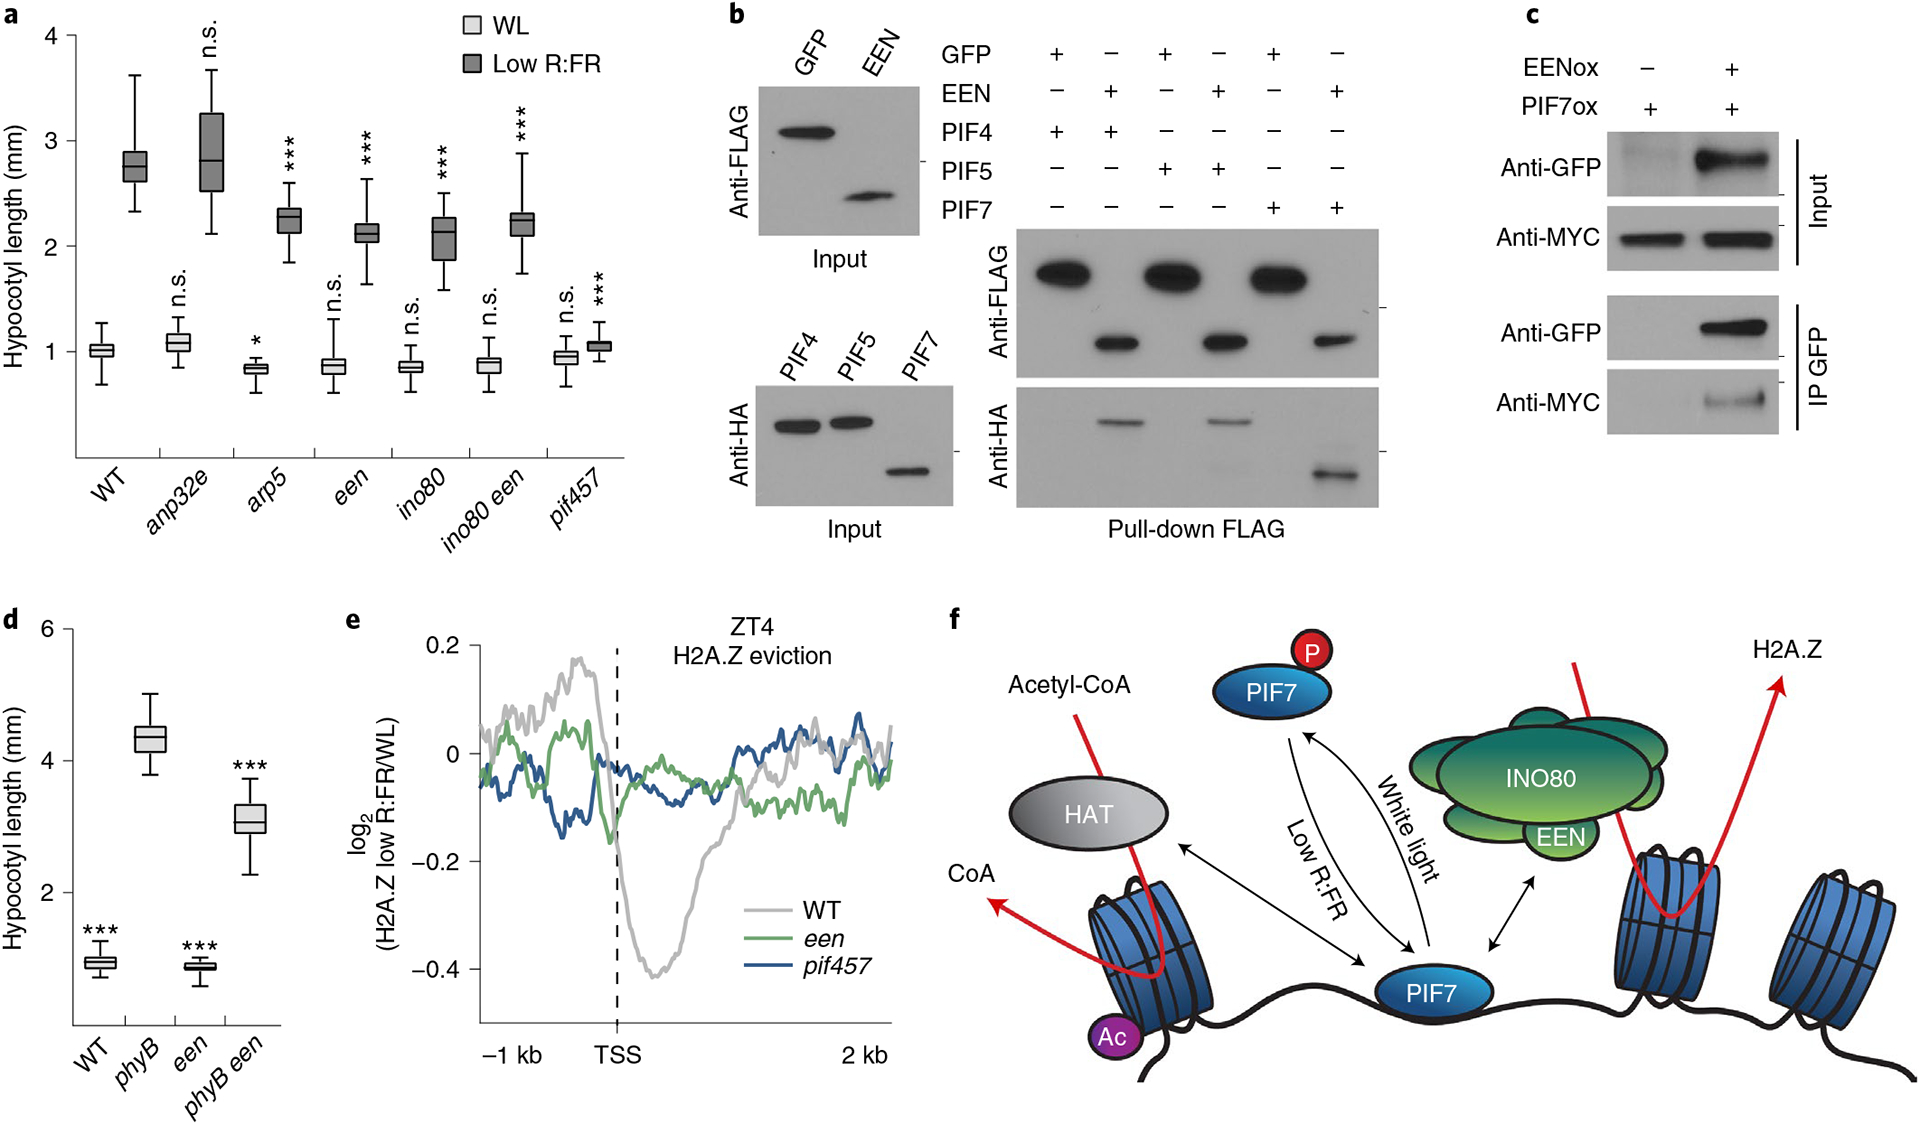
a, Hypocotyl length measurements of WT (n = 24/20), anp32e (n = 31/22, P = 0.991/P > 0.999), arp5 (n = 31/28, P = 0.044/P < 0.001), een (n = 26/26, P = 0.478/P < 0.001), ino80 (n = 27/19, P = 0.251/P < 0.001), ino80 een (n = 27/20, P = 0.495/P < 0.001) and pif457 (n = 22/30, P = 0.996/P < 0.001) seedlings grown in WL or in response to low R:FR. Stars denote statistically significant differences between WT and mutants grown in WL or in low R:FR, respectively (two-way ANOVA, Tukey’s multiple comparisons test, n.s. P > 0.05, *P ≤ 0.05, **P ≤ 0.01, ***P ≤ 0.001. b, Pull-down assay using in vitro-translated FLAG:EEN and HA:PIF proteins. FLAG:GFP served as negative control. Marks next to cropped blots represent 25 kDa (anti-FLAG) or 50 kDa (anti-HA), respectively. c, Co-immunoprecipitation (IP) using 6-day-old seedlings overexpressing MyC-tagged PIF7 alone or in combination with GFP-tagged EEN. Marks next to cropped blots represent 37 kDa (anti-GFP) or 75 kDa (anti-MyC), respectively. d, Hypocotyl length measurements of WT (n = 22, P < 0.001), phyB (n = 16), een (n = 24, P < 0.001) and phyB een (n = 24, P < 0.001) grown in WL. Stars denote statistically significant differences between phyB and the other genotypes (one-way ANOVA, Tukey’s multiple comparisons test, n.s. P > 0.05, *P ≤ 0.05, **P ≤ 0.01, ***P ≤ 0.001). e, Aggregated profiles display low R:FR–induced H2A.Z loss in WT, een and pif457 seedlings at ZT4. Loss of H2A.Z (log2 (fold change) between WL and low R:FR–exposed H2A.Z ChIP–seq samples) is visualized around the TSS of 464 genes that show H2A.Z depletion (≥1.25-fold) after low R:FR exposure in WT seedlings. f, Model for the control of low R:FR–induced H2A.Z removal through the PIF7–INO80 regulatory module. Upon exposure to low R:FR light, PIF7 is dephosphorylated and subsequently binds to its target sites where it potentially interacts with the EEN subunit of the INO80 complex and an unknown histone acetyltransferase (HAT). Consequently, gene-body-localized H2A.Z is removed, H3K9 in regulatory regions is acetylated (Ac) and gene expression of PIF7 target genes will be initiated. In a and d, boxes extend from the 25th to 75th percentiles. Middle lines represent medians. Whiskers extend to the smallest and largest values, respectively.
We provide strong evidence that H2A.Z removal requires PIF DNA binding, since H2A.Z depletion is strongly compromised in pif457 triple mutants. This is in contrast to the reported function of H2A.Z loss at the FT locus in high ambient temperatures, where it mediates PIF4 DNA binding directly3. Our result of a PIF4–EEN interaction suggests that PIF4 can also remove H2A.Z through the INO80 complex, which indicates that the interplay between PIF4 and H2A.Z at FT might be more complex than previously postulated, especially since the majority of H2A.Z is localized in gene bodies5–7,30 and not at upstream regulatory elements where transcription factors usually bind. Our findings suggest that the PIF-mediated H2A.Z removal through association with the INO80 complex represents a more common mode by which gene-body-localized H2A.Z is reduced. Moreover, our data also suggest that EEN-independent mechanisms for H2A.Z removal in low R:FR light might exist, since een mutants display a weaker molecular phenotype than pif457 triple mutants (Extended Data Fig. 5f).
Considering the functional diversity of PIFs in development, growth and immunity2 our findings are potentially translatable to other agronomically important responses. Given that phyB and PIF7 mediate shade avoidance responses and thermomorphogenesis14,31–33, the identification of the PIF–INO80 module might pave the way for future investigations of plant–environment interactions, which are critically needed in times of climate change.
Methods
Genetic material and plasmid cloning.
All genetic material used in this study is in the Arabidopsis Columbia-0 (Col-0) background (WT). pif4-101 (ref.34), pif5-2 (ref.35), pif5-3 (ref.35), pif7-1 (ref.36), pif4-101 pif5-3 (ref.34), pif4-2 pif7-1 (ref.36), pif1-1 pif3-3 pif4-2 pif5-3 (ref.37), phyB-9 (ref.38), phyB-9 pif4-101 (ref.34), phyB-9 pif7-1 (ref.36), arp5-1 (ref.39), een-2 (ref.7) and ino80-8 (ref.7) were described previously. By crossing these lines the following mutant combinations were generated for this study: pif5-3 pif7-1, pif4-2 pif5-3 pif7-1, pif1-1 pif3-3 pif4-2 pif5-3 pif7-1, phyB-9 pif5-2, phyB-9 pif4-101 pif5-2, phyB-9 pif4-101 pif7-1, phyB-9 pif5-2 pif7-1, phyB-9 pif4-101 pif5-2 pif7-1, ino80-8 een-2 and pif4-2 pif5-3 pif7-1 een-2. The T-DNA insertion in AT3G50690 (encodes the closest sequence homolog of human ANP32E) is located in the first exon (SALK_033316).
For PIF7:PIF7:4xMYC (Extended Data Fig. 6a), a 4,064-bp genomic PIF7 fragment was amplified by PCR that encompassed the PIF7 promoter region (2,500 bp upstream of the PIF7 start codon) and the entire exon–intron sequence of PIF7. This fragment was integrated via Gateway cloning, first into pDONR221 (ThermoFisher Scientific) and afterward into pGWB16 (ref.40). For UBQ10:GFP:EEN and UBQ10:GFP:INO80C, the coding sequences from EEN and INO80C in pDONR221 were integrated into pGWB6 (ref.40) and GFP:EEN as well as GFP:INO80C were amplified by PCR. Additionally, the UBQ10 promoter and RCBS terminator were amplified from UBQ10pro in pDONR-P4P1R (ref.41) or pMX202 (ref.42), respectively. The promoter, coding sequences and terminator were cloned into the SmaI site of pJHA212G43 via Gibson Assembly cloning (NEB). Human INO80 complex subunit C isoform 3 (CCDS77177.1) was used for cloning UBQ10:GFP:INO80C. Floral dip was performed for all Arabidopsis transformations44. PIF7:PIF7:4xMYC was transformed into pif4-101 pif5-3 pif7-1 and homozygous T3 lines were crossed with phyB-9 pif4-101 pif5-2 pif7-1. UBQ10:GFP:EEN and UBQ10:GFP:INO80C were transformed into een-2. Additionally, UBQ10:GFP:EEN was transformed into pif7-2 35S:PIF7:9xMyc:6xHis :3xFlag13. For in vitro transcription and translation, coding sequences were derived from Arabidopsis complementary DNA or the AtORFeome2.0 clone collection and were Gateway cloned into pTnT FLAG:GW or pTnT HA:GW45. Primer sequences can be found in Supplementary Table 7.
Growth conditions.
Seedlings were grown on half-strength Linsmaier and Skoog media in LED chambers (Percival Scientific) at 21 °C in long day conditions (16 h day/8 h night) or constant light. Light conditions are described in Extended Data Fig. 6b,c and wavelength intervals were described previously46.
Hypocotyl measurement.
Seeds of experiments using arp5-1, een-2 and ino80-8 seeds were stratified for at least 5 days, otherwise, seeds were stratified for a minimum of 3 days. Afterward, plates were exposed for 5 hours to 30 μmol m−2 s−1 red light, transferred to darkness for 19 hours to synchronize germination and kept in LD. Nine days after stratification, agar plates were scanned and hypocotyls were measured using NIH ImageJ software. For low R:FR treatment, seedlings were moved from white light to low R:FR light conditions 5 days after stratification.
Western blotting.
Frozen 6-day-old seedlings were disrupted in a ball mill using metal beads. Ground tissue was boiled in 2× NuPAGE LDS Sample Buffer (including 1.8% β-mercaptoethanol) for 5 min and separated in NuPAGE 4–12% Bis–Tris Protein Gels (ThermoFisher Scientific). The following antibodies were used for immunoblotting: Myc-Tag, 9B11 (1:2,000, catalog no. 2276, Cell Signaling Technology), anti-HA-peroxidase, high-affinity clone 3F10 (1:2,000, catalog no. 11867423001, Roche), anti-FLAG M2-peroxidase (HRP) Clone M2 (1:5,000, catalog no. A8592, MilliporeSigma), anti-GFP clones 7.1 and 13.1 (1:5,000, catalog no. 11814460001, Roche), anti-Actin (1:5,000, catalog no. A0480, MilliporeSigma) and goat anti-mouse IgG (H + L)-HRP conjugate (1:5,000, catalog no. 1706516, Bio-Rad).
Protein dephosphorylation.
At ZT4, 6-day-old seedlings grown in LD in WL conditions were frozen and the material was disrupted in a ball mill using metal beads. Plant material was resuspended (50 mM Tris–HCl, 150 NaCl, 0.5% Triton X-100, 1× cOmplete Protease Inhibitor Cocktail, 1× PhosSTOP phosphatase inhibitor cocktail, Roche) and the supernatant was cleared by centrifugation and incubated for 30 min with ChromoTek GFP-Trap. Beads were washed nine times (50 mM Tris–HCl, 150 NaCl, 0.5% Triton X-100, 1× cOmplete Protease Inhibitor Cocktail, 1× PhosSTOP phosphatase inhibitor cocktail, Roche) and supernatant completely removed. Beads were washed once with 1× NEBuffer for PMP and resuspended in the same buffer. λ-Phosphatase was added and beads were incubated for 20 min at 30 °C. The reactions were stopped by removal of supernatants and addition of 2× NuPAGE LDS Sample Buffer (including 1.8% β-mercaptoethanol). For the respective negative controls, λ-phosphatase was heat inactivated by boiling the enzyme for 10 min.
Protein pull-down assay.
According to the manufacturer’s (Promega) instructions, TNT SP6 Coupled Wheat Germ Extract System was used to express HA fusions, while TNT SP6 Coupled Reticulocyte Lysate System served to express FLAG fusions. All further steps were performed at 4 °C. Reaction mixes were diluted with Paca buffer I (50 mM Tris pH 7.5, 100 mM NaCl, 1 mM EDTA, 1 mM TCEP pH 7.5, 1% (v/v) DMSO, 0.1% (v/v) IGEPAL CA-630, 0.04% (v/v) Tween-20) and FLAG-tagged protein were incubated for 1 h with anti-FLAG M2 Affinity Gel (Sigma-Aldrich) while rotating. Beads were washed three times with Paca buffer I and HA-tagged proteins were added. After rotating for 30 min, beads were washed four times with Paca buffer I, boiled in 2× NuPAGE LDS Sample Buffer (including 1.8% β-mercaptoethanol) for 5 min and separated in NuPAGE 4–12% Bis–Tris Protein Gels (ThermoFisher Scientific).
Protein coimmunoprecipitation.
At ZT0, 6-day-old seedlings were exposed to low R:FR for 8 hours. Frozen material was disrupted in a ball mill using metal beads. Plant material was resuspended in Paca buffer II + (50 mM Tris pH 7.5, 100 mM NaCl, 1 mM EDTA, 1 mM TCEP pH 7.5, 1% (v/v) DMSO, 0.4% (v/v) IGEPAL CA-630, 1× cOmplete Protease Inhibitor Cocktail, Roche, 125 U ml−1 benzonase, MilliporeSigma) and rotated for 30 min at 4 °C. The supernatant was cleared by centrifugation and incubated for 1 h with ChromoTek GFP-Trap. Beads were washed six times with Paca buffer II– (excluding benzonase), boiled in 2× NuPAGE LDS Sample Buffer (including 1.8% β-mercaptoethanol) for 5 min and separated in NuPAGE 4–12% Bis–Tris Protein Gels (ThermoFisher Scientific).
Immunolocalization and confocal imaging analysis.
Whole-mount immunolocalization was performed as described previously47,48 with the following modifications. Six-day-old pif457 PIF7:PIF7:4xMYC and phyB pif457 PIF7:PIF7:4xMYC seedlings grown in WL were fixed in 4% paraformaldehyde at ZT4, or after a subsequent 30 min low R:FR treatment, and mounted on slides. All subsequent steps were performed in a 55-μl SecureSeal chamber (Grace Bio-Labs). PIF7:4xMYC was detected via rabbit polyclonal MYC antibody (catalog no. 2272S, Cell Signaling Technology, 1:100 dilution) as a primary antibody and donkey-anti-rabbit-AlexaFluor 555 antibodies (catalog no. A31572, ThermoFisher Scientific, 1:1,000 dilution) as a secondary antibody. phyB was detected via mouse monoclonal antibody (a gift from A. Nagatani, 1:100 dilution) as a primary antibody and donkey-anti-mouse-AlexaFluor 488 antibodies (catalog no. A21202, ThermoFisher Scientific, 1:1,000 dilution) as a secondary antibody. The nuclei were counterstained with 3.6 μM DAPI. Samples were mounted using ProLong Diamond Antifade Mountant (ThermoFisher Scientific) and left to cure overnight in the dark and stored at 4 °C before confocal analysis.
Three-dimensional image stacks of individual nuclei from cotyledons were imaged using a Zeiss LSM-800 confocal microscope with a ×100/1.4 Plan-Apochromat oil-immersion objective (Carl Zeiss). Alexa 488 fluorophore was monitored using 488-nm excitation and 490–561-nm bandpass detector settings. DAPI was monitored with 353-nm excitation and 410–470-nm bandpass detector. The maximum projection of image stacks was generated by Zeiss imaging software ZEN v.2.3 and processed by Adobe Photoshop CC (Adobe). To quantify the colocalized PHYB and PIF7 nuclear bodies, the number of PHYB nuclear bodies, PIF7 nuclear bodies and colocalized PHYB/PIF7 nuclear bodies was manually scored and used to calculate the percentage of colocalization of PHYB and PIF7.
ChIP-sequencing.
Except for the experiment depicted in Fig. 3a,b and Extended Data Fig. 2a, seedlings were cross-linked 6 days after stratification. For the experiment shown in Fig. 3a,b and Extended Data Fig. 2a, 5 days after stratification, seedlings continued to grow in WL or were moved to low R:FR conditions. Samples were cross-linked 8 days after stratification. ChIP–seq experiments were performed as previously described49 with minor modifications. ChIP–seq assays were conducted with antibodies against H2A.Z (catalog no. 39647, Active Motif), H3K9ac (catalog no. 39137, Active Motif) and Myc-tag Mouse (catalog no. 2276, Cell Signaling Technology). IgG (catalog no. 015-000-003, Jackson ImmunoResearch) served as the negative control. Dynabeads Protein G (ThermoFisher Scientific) were coupled for 4–6 hours with respective antibodies and incubated overnight with equal amounts of sonicated chromatin. Beads were consecutively washed with low salt buffer (50 mM Tris–HCl pH 7.4, 500 mM NaCl, 2 mM EDTA, 0.5% Triton X-100), high salt buffer (50 mM Tris–HCl pH 7.4, 150 mM NaCl, 2 mM EDTA, 0.5% Triton X-100) and wash buffer (50 mM Tris–HCl pH 7.4, 50 mM NaCl, 2 mM EDTA) before carrying out de-cross-linking at 65 °C, proteinase K treatment and DNA precipitation. Libraries were sequenced on Illumina HiSeq 2500 and HiSeq 4000 sequencing systems. Sequencing reads were aligned to TAIR10 genome assembly using Bowtie2 (ref.50).
RNA-sequencing.
Total RNA was extracted using RNeasy Plant Mini Kit (Qiagen). cDNA library preparation and single read sequencing were performed as described previously51. Sequencing reads were aligned to TAIR10 genome assembly using STAR software (STAR v.2.6.0 c)52.
Sequencing data analysis.
H2A.Z occupancy was determined from ChIP–seq experiments with the SICER software53 using the TAIR10 genome assembly and WT IgG samples as a control. Genes that were most proximal to H2A.Z-enriched domains were identified with the Intersect tool from BEDtools54. For the identification of PIF7 peak summit regions, we used the genome-wide event finding and motif discovery (GEM) tool (v.2.5)55. WT chromatin treated with an anti-MYC antibody served as a control for the total number of PIF7 ChIP–seq peaks. For the low R:FR–specific identification of PIF7 peaks, we used chromatin from WL-exposed pif457 PIF7:PIF7:4xMYC seedlings as control. We used the MEME-ChIP analysis tool56 to identify preferred binding motifs within the top 500 summit regions of two merged PIF7 ChIP–seq experiments at ZT4 with low R:FR exposure. Biological ChIP–seq replicates were merged with SAMtools57. DAVID was used to identify gene ontology enrichment in the PIF7 ChIP–seq data58. For the analysis of genomic distributions within PIF7 ChIP–seq data the cis-regulatory element annotation system (CEAS) tool was used59. Heat maps, aggregated profiles and correlation analyses of ChIP–seq data were carried out with deepTools60. To quantify occupancy of H2A.Z and PIF7 at ATHB2 and the PIF7 core gene set, we employed the bigWigAverageOverBed tool executable from the UCSC genome browser61. For the identification of genes with a low R:FR–induced H2A.Z removal, we employed SICER. Transcripts in the RNA-seq data were quantified with the RSEM software package (v.1.3.0) and differentially induced genes were identified with the Cufflinks package62. The AnnoJ genome browser was used to visualize all sequencing data63.
Statistics and reproducibility.
All western blots, pull-down assays and coimmunoprecipitations were independently repeated at least three times, with similar results.
Reporting Summary.
Further information on research design is available in the Nature Research Reporting Summary linked to this article.
Extended Data
Extended Data Fig. 1 |. PIF7 activity is regulated by low R:FR light exposure.
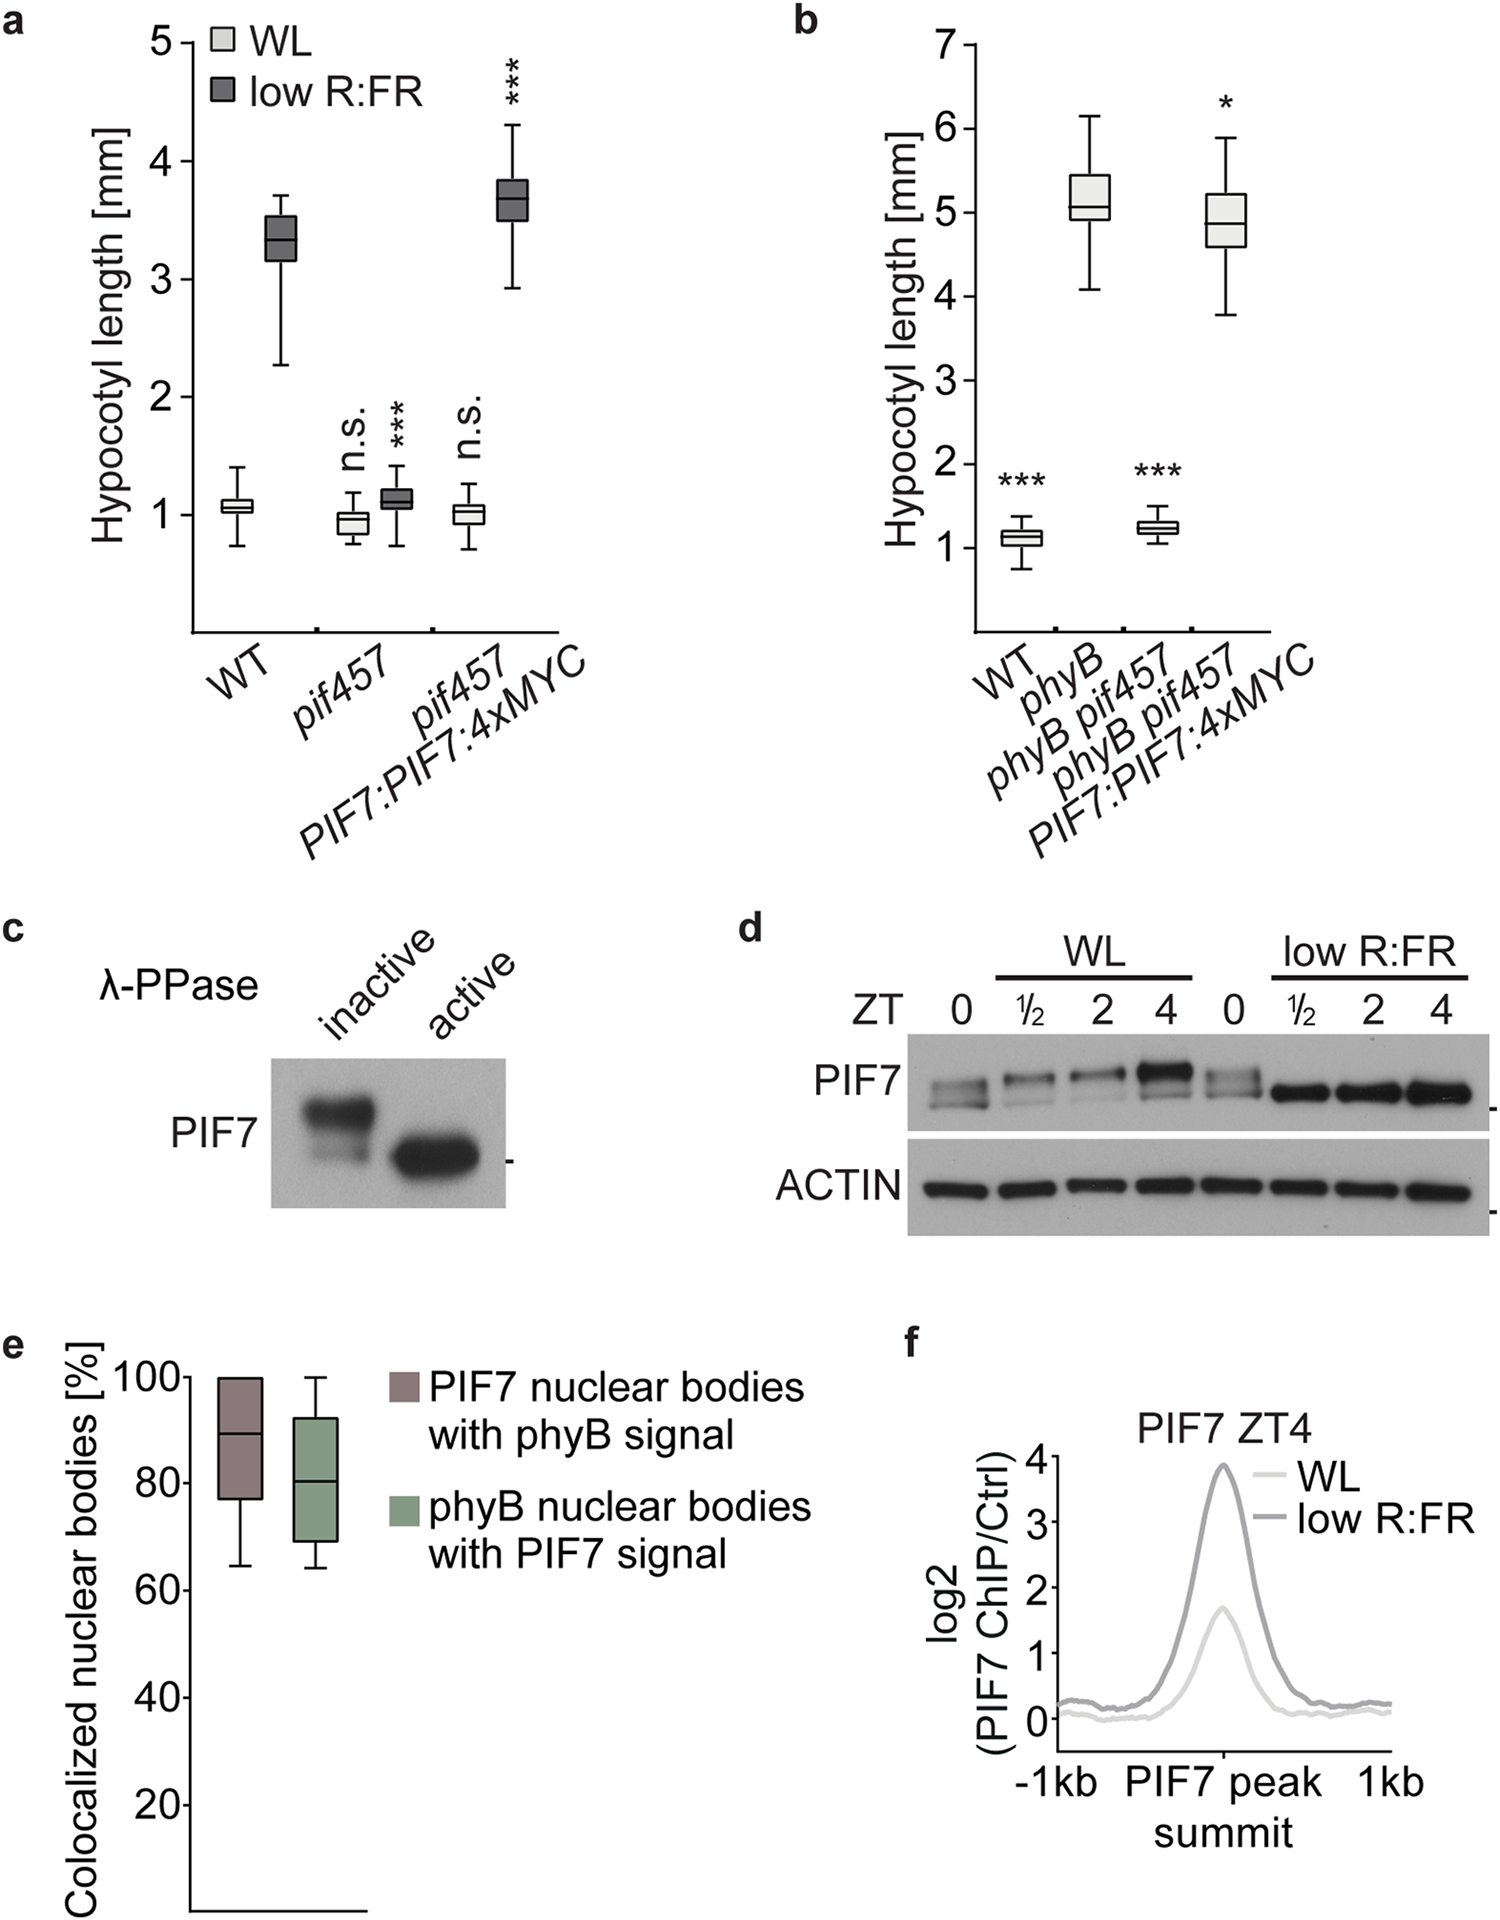
a, Hypocotyl length measurements of WT (n = 30/30), pif457 (n = 30/32, P = 0.271/P < 0.001) and pif457 expressing PIF7:PIF7:4xMYC (n = 36/36, P = 0.823/P < 0.001) in white light or in responses to low R:FR. Stars denote statistically significant differences between WT and the other genotypes for the respective light condition (two-way ANOVA, Tukey’s multiple comparisons test, n.s. P > 0.05, * P ≤ 0.05, ** P ≤ 0.01, *** P ≤ 0.001). b, Hypocotyl length measurements of WT (n = 26, P < 0.001), phyB (n = 33), phyB pif457 (n = 23, P < 0.001) and phyB pif457 expressing PIF7:PIF7:4xMYC (n = 34, P = 0,027) grown in WL. Stars denote statistically significant differences between phyB and the other genotypes (one-way ANOVA, Tukey’s multiple comparisons test, n.s. P > 0.05, * P ≤ 0.05, ** P ≤ 0.01, *** P ≤ 0.001). c, Immunoblot with anti-MyC of immunoprecipitated PIF7:4xMyC that had been treated with boiled (inactive) or native (active) λ-phosphatase (λ-PPase). PIF7:4xMyC was immunoprecipitated from 6 days old seedlings, grown in WL and harvested at ZT4. Mark next to cropped blot represent 50 kDa. d, Immunoblot analysis of pif457 PIF7:PIF7:4xMYC in LD. 6-day-old seedlings continued to grow in WL or where exposed to low R:FR at ZT0. Marks next to cropped blots represent 50 kDa (PIF7:4xMyC) or 37 kDa (ACTIN), respectively. e, Colocalization of PIF7:4xMyC and phyB containing nuclear speckles per nucleus. The number of phyB nuclear bodies (n = 105), PIF7 nuclear bodies (n = 98), and co-localized PHyB/PIF7 nuclear bodies were scored and used to calculate the percentage of co-localization of PHyB and PIF7. f, Aggregated profile shows the low R:FR dependent difference between PIF7 binding at ZT4. PIF7 binding was determined in WL and low R:FR-exposed pif457 PIF7:PIF7:4xMYC seedlings by ChIP-seq. PIF7 occupancy is shown from 1 kb upstream to 1 kb downstream of the 500 strongest PIF7 binding events. In a, b and e, boxes extend from the 25th to 75th percentiles. Middle lines represent medians. Whiskers extend to the smallest and largest values, respectively.
Extended Data Fig. 2 |. Low R:FR light manipulates H2A.Z dynamics.
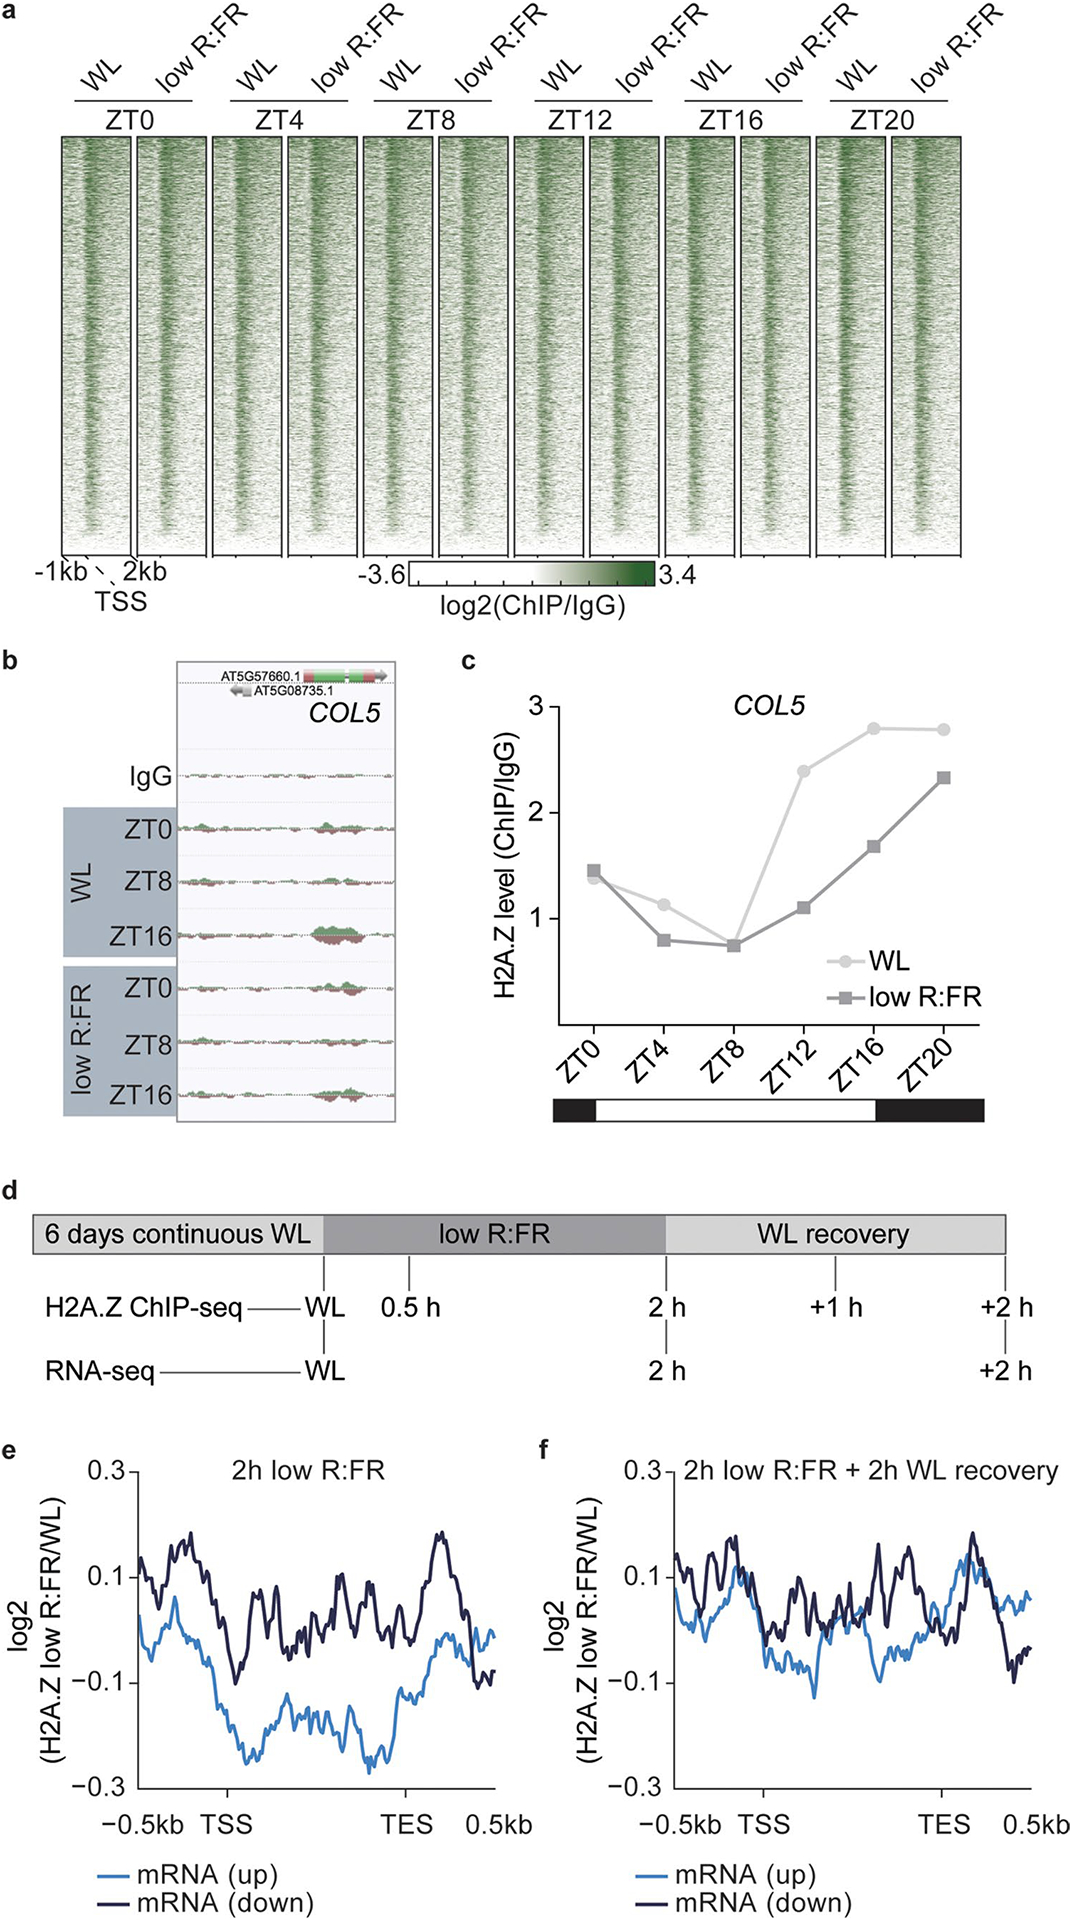
a, Heatmap visualizes absolute H2A.Z of all Arabidopsis thaliana protein-coding genes (TAIR10) at the indicated time points and light treatments. H2A.Z occupancy was determined by ChIP-seq in WT seedlings and calculated as the log2 fold change between H2A.Z ChIP and IgG control sample. b, AnnoJ genome browser screenshot visualizes the light quality-dependent H2A.Z occupancy at the COL5 gene at ZT0, ZT8 and ZT16. The WT IgG track serves as a control and all tracks were normalized to their sequencing depth. c, Quantification of H2A.Z levels at the gene body of COL5 is shown. Occupancy of H2A.Z was determined by ChIP-seq in one experiment and calculated as the ratio between H2A.Z and IgG control. d, Schematic overview illustrates the experimental setup that was used to investigate chromatin dynamics in low R:FR light responses for experiments shown in Figure 3c to e. e,f, Alternative presentation of results shown in Figure 3c and 3d. Aggregated profiles visualize low R:FR-induced H2A.Z loss and incorporation after two hours of low R:FR exposure (e), and after an additional two-hour-long WL recovery phase (f). Profiles are shown for genes that are differentially expressed after two hours of low R:FR exposure.
Extended Data Fig. 3 |. Low R:FR light exposure induces global PIF7 DNA binding.
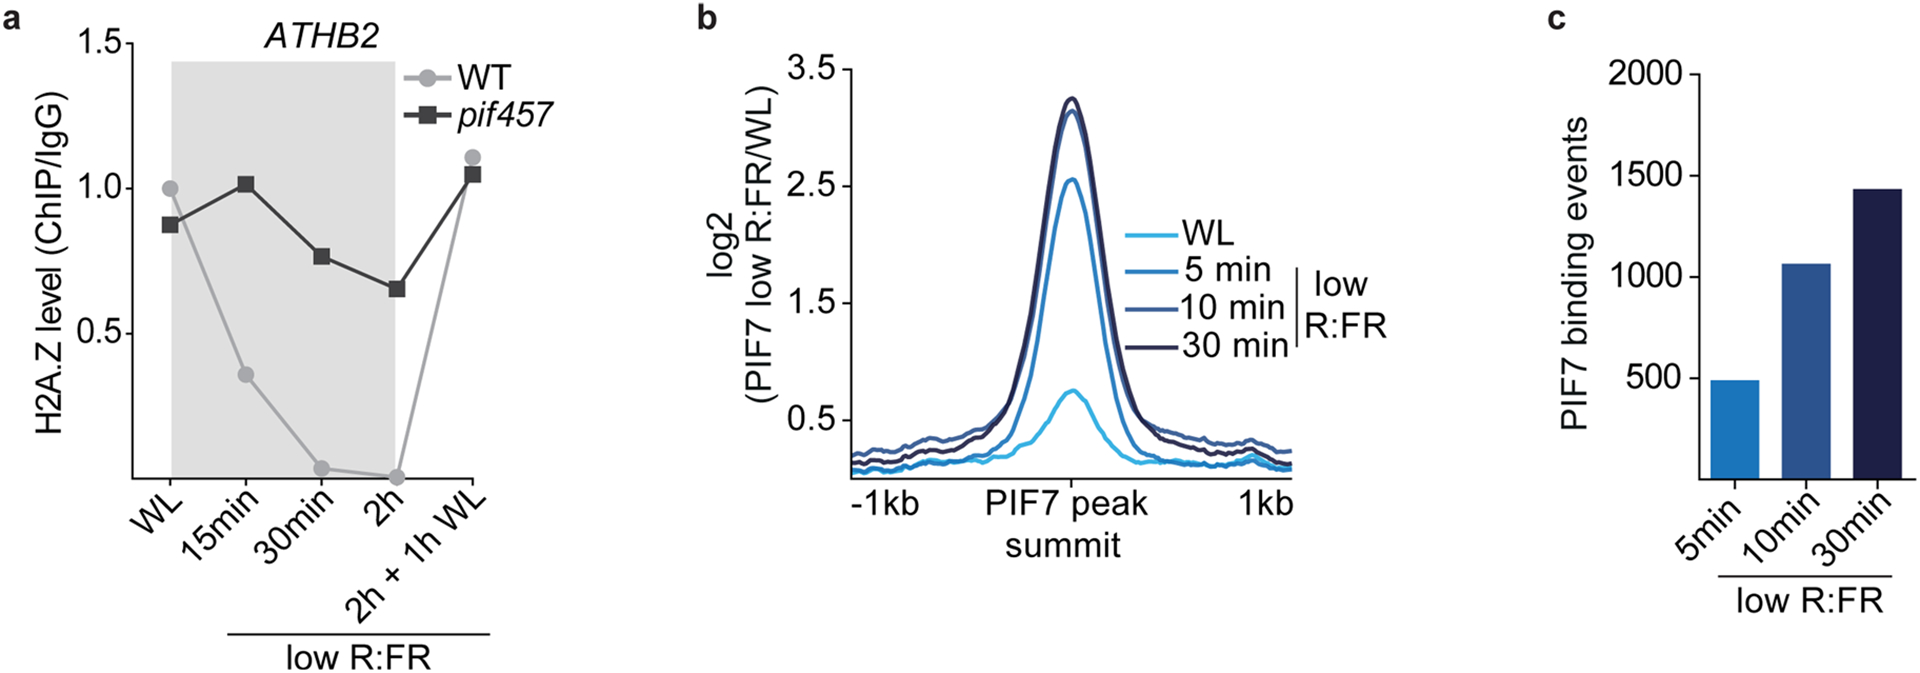
a, Levels of H2A.Z at ATHB2 in WT and pif457 seedlings at the indicated time points are shown. Occupancy of H2A.Z was determined by ChIP-seq (n = 1) and calculated as the ratio between H2A.Z and IgG. b, Aggregated profiles visualize the low R:FR-mediated activation of PIF7 after short low R:FR exposures (5, 10 and 30 min). PIF7 binding was determined in WL and low R:FR-exposed pif457 PIF7:PIF7:4xMYC seedlings by ChIP-seq and was calculated as the ratio between H2A.Z ChIP-seq samples and IgG control sample. PIF7 occupancy is shown from 1 kb upstream to 1 kb downstream of the 500 strongest PIF7 binding events. c, Bar plot illustrates increase of low R:FR-induced PIF7 DNA binding events. PIF7 binding events were determined by GEM through the direct comparison of the respective low R:FR-exposed and WL-exposed PIF7 ChIP-seq replicates (n = 3).
Extended Data Fig. 4 |. Low R:FR induced H3K9 hyperacetylation depends on PIFs.
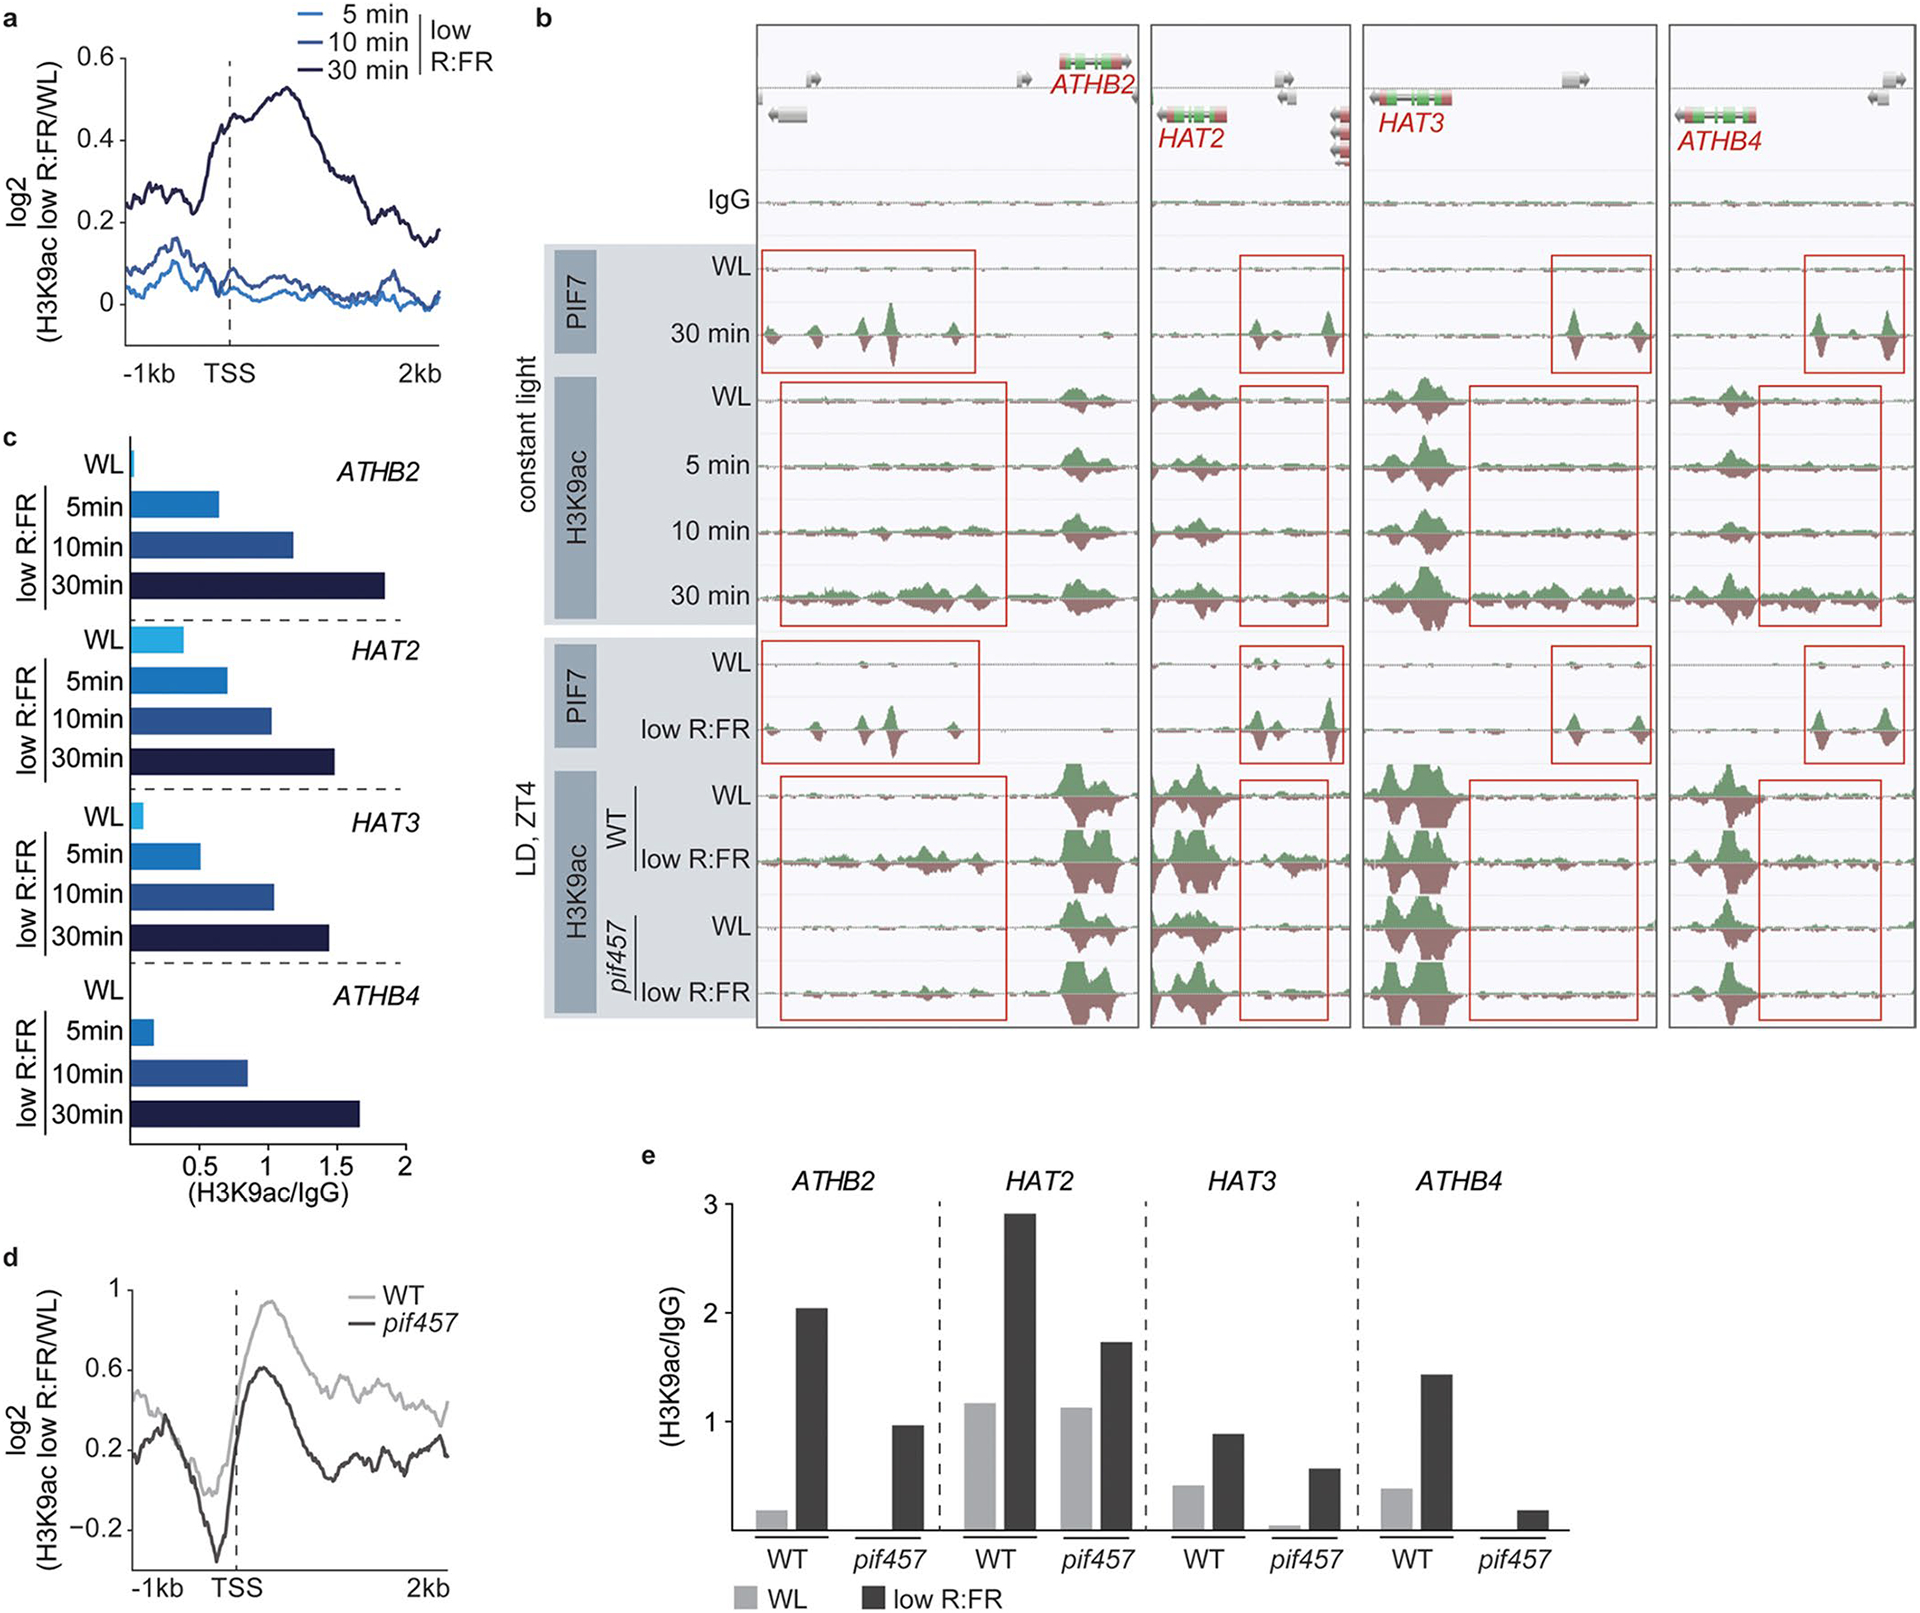
a, Aggregated profiles visualize the increase of H3K9ac at the most dynamic 200 genes after short low R:FR exposures (5, 10 and 30 min). H3K9ac occupancy was determined in WL and low R:FR-exposed pif457 PIF7:PIF7:4xMYC seedlings by ChIP-seq and was calculated as the ratio between WL and low R:FR-treated H3K9ac ChIP-seq samples. b, AnnoJ genome browser screenshot visualizes PIF7 binding and H3K9 acetylation at the ATHB2 gene and its closest relatives (ATHB4, HAT2, HAT3). Genome-wide occupancy of PIF7 and H3K9ac under constant light conditions was determined in the same pif457 PIF7:PIF7:4xMYC chromatin by ChIP-seq whereas under LD conditions at ZT4, WT (H3K9ac), pif457 (H3K9ac) and pif457 PIF7:PIF7:4xMYC (PIF7) chromatin was used. All tracks were normalized to the respective sequencing depth. The areas marked in red indicate PIF7 binding and H3K9 hyperacetylation. c, Quantification of relative H3K9ac levels at the promoters of ATHB2, ATHB4, HAT2 and HAT3 in low R:FR-exposed pif457 PIF7:PIF7:4xMYC seedlings. H3K9ac occupancy was calculated as the ratio between the respective ChIP-seq sample from one experiment and the WT IgG control. d, Aggregated profiles visualize the increase of H3K9ac at the most dynamic 200 genes after 4 hours of low R:FR exposure at ZT4. H3K9ac occupancy was determined in WL and low R:FR-exposed WT and pif457 seedlings by ChIP-seq and was calculated as the ratio between WL and low R:FR-treated H3K9ac ChIP-seq samples. e, Quantification of relative H3K9ac levels at the promoters of ATHB2, ATHB4, HAT2 and HAT3 in WL and low R:FR-exposed WT and pif457 seedlings. H3K9ac occupancy was calculated from one experiment as the ratio between the H2A.Z ChIP-seq sample and the WT IgG control.
Extended Data Fig. 5 |. PIF-EEN/INO80C interaction and een mutant complementation.
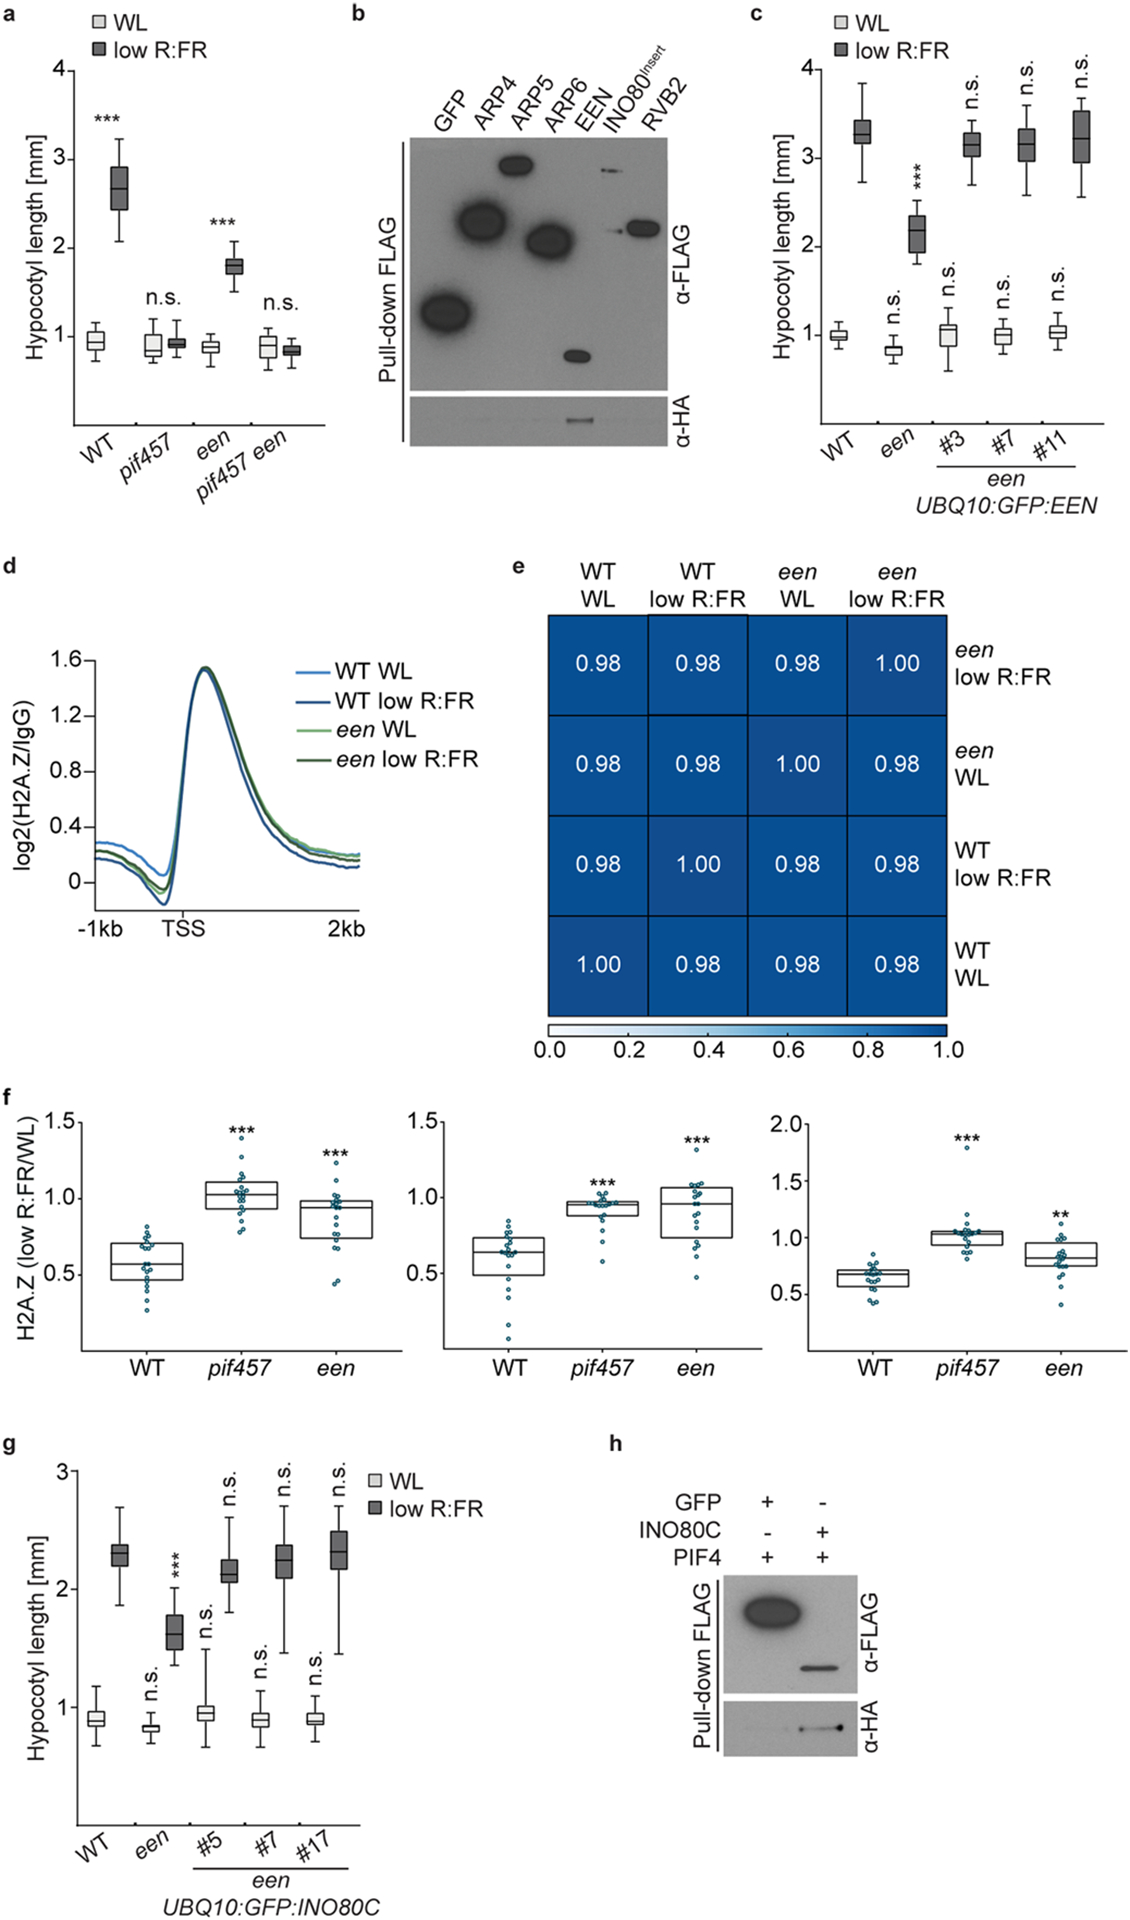
a, Hypocotyl length of WT (n = 15/17, P < 0.001), pif457 (n = 17/13, P = 0.996), een (n=14/14, P < 0.001) and pif457 een (n = 12/15, P = 0.994) seedlings grown in WL or in response to low R:FR. b, Pull-down assay with in vitro translated proteins. ARP4, ARP5, ARP6, EEN, INO80 insertion domain (INO80Insert)64, and RVB2 were tagged with FLAG and PIF4 with HA. FLAG:GFP served as negative control. c, Hypocotyl length of WT (n = 16/18), een (n = 19/18, P = 0.406/P < 0.001) and een UBQ10:GFP:EEN line #3 (n = 15/17, P > 0.999/P = 0.49), #7 (n = 15/17, P > 0.999/P = 0.319) and #11 (n = 16/17, P > 0.999/P = 0.977). d, Aggregated H2A.Z profiles of all Arabidopsis genes (TAIR10) in WL and low R:FR-treated WT and een seedlings show H2A.Z occupancy around the TSS. e, Spearman’s correlation plot shows the correlation of read coverages between WL and low R:FR-treated WT and een H2A.Z ChIP-seq samples. Clustering was determined by the degree of correlation. f, Box plots show level of H2A.Z loss at the 20 most dynamic genes in WT, pif457 and een seedlings at ZT4 for three independent experiments. Boxes extend from the 25th to 75th percentiles. Middle lines represent the median. Stars denote statistically significant differences in comparison to WT (one-way ANOVA, Tukey’s multiple comparisons test, n.s. P > 0.05, * P ≤ 0.05, ** P ≤ 0.01, *** P ≤ 0.001). g, Hypocotyl length measurements of WT (n = 37/35), een (n = 30/31, P = 0.806/P < 0.001) and een UBQ10:GFP:INO80C line #5 (n = 40/38, P = 0.877/P = 0.145), #7 (n = 37/37, P > 0.999/ P > 0.999) and #17 (n = 38/37, P > 0.999/ P > 0.999). h, Pull-down assay with in vitro translated proteins. INO80C was tagged with FLAG and PIF4 with HA. FLAG:GFP served as a negative control. In a, c and g, boxes extend from the 25th to 75th percentiles. Middle lines represent medians. Whiskers extend to the smallest and largest values, respectively. Stars denote statistically significant differences between light conditions (a) or versus WT for the respective light condition (c and g) (two-way ANOVA, Tukey’s multiple comparisons test, n.s. P > 0.05, * P ≤ 0.05, ** P ≤ 0.01, *** P ≤ 0.001).
Extended Data Fig. 6 |. PIF7 construct and light conditions.
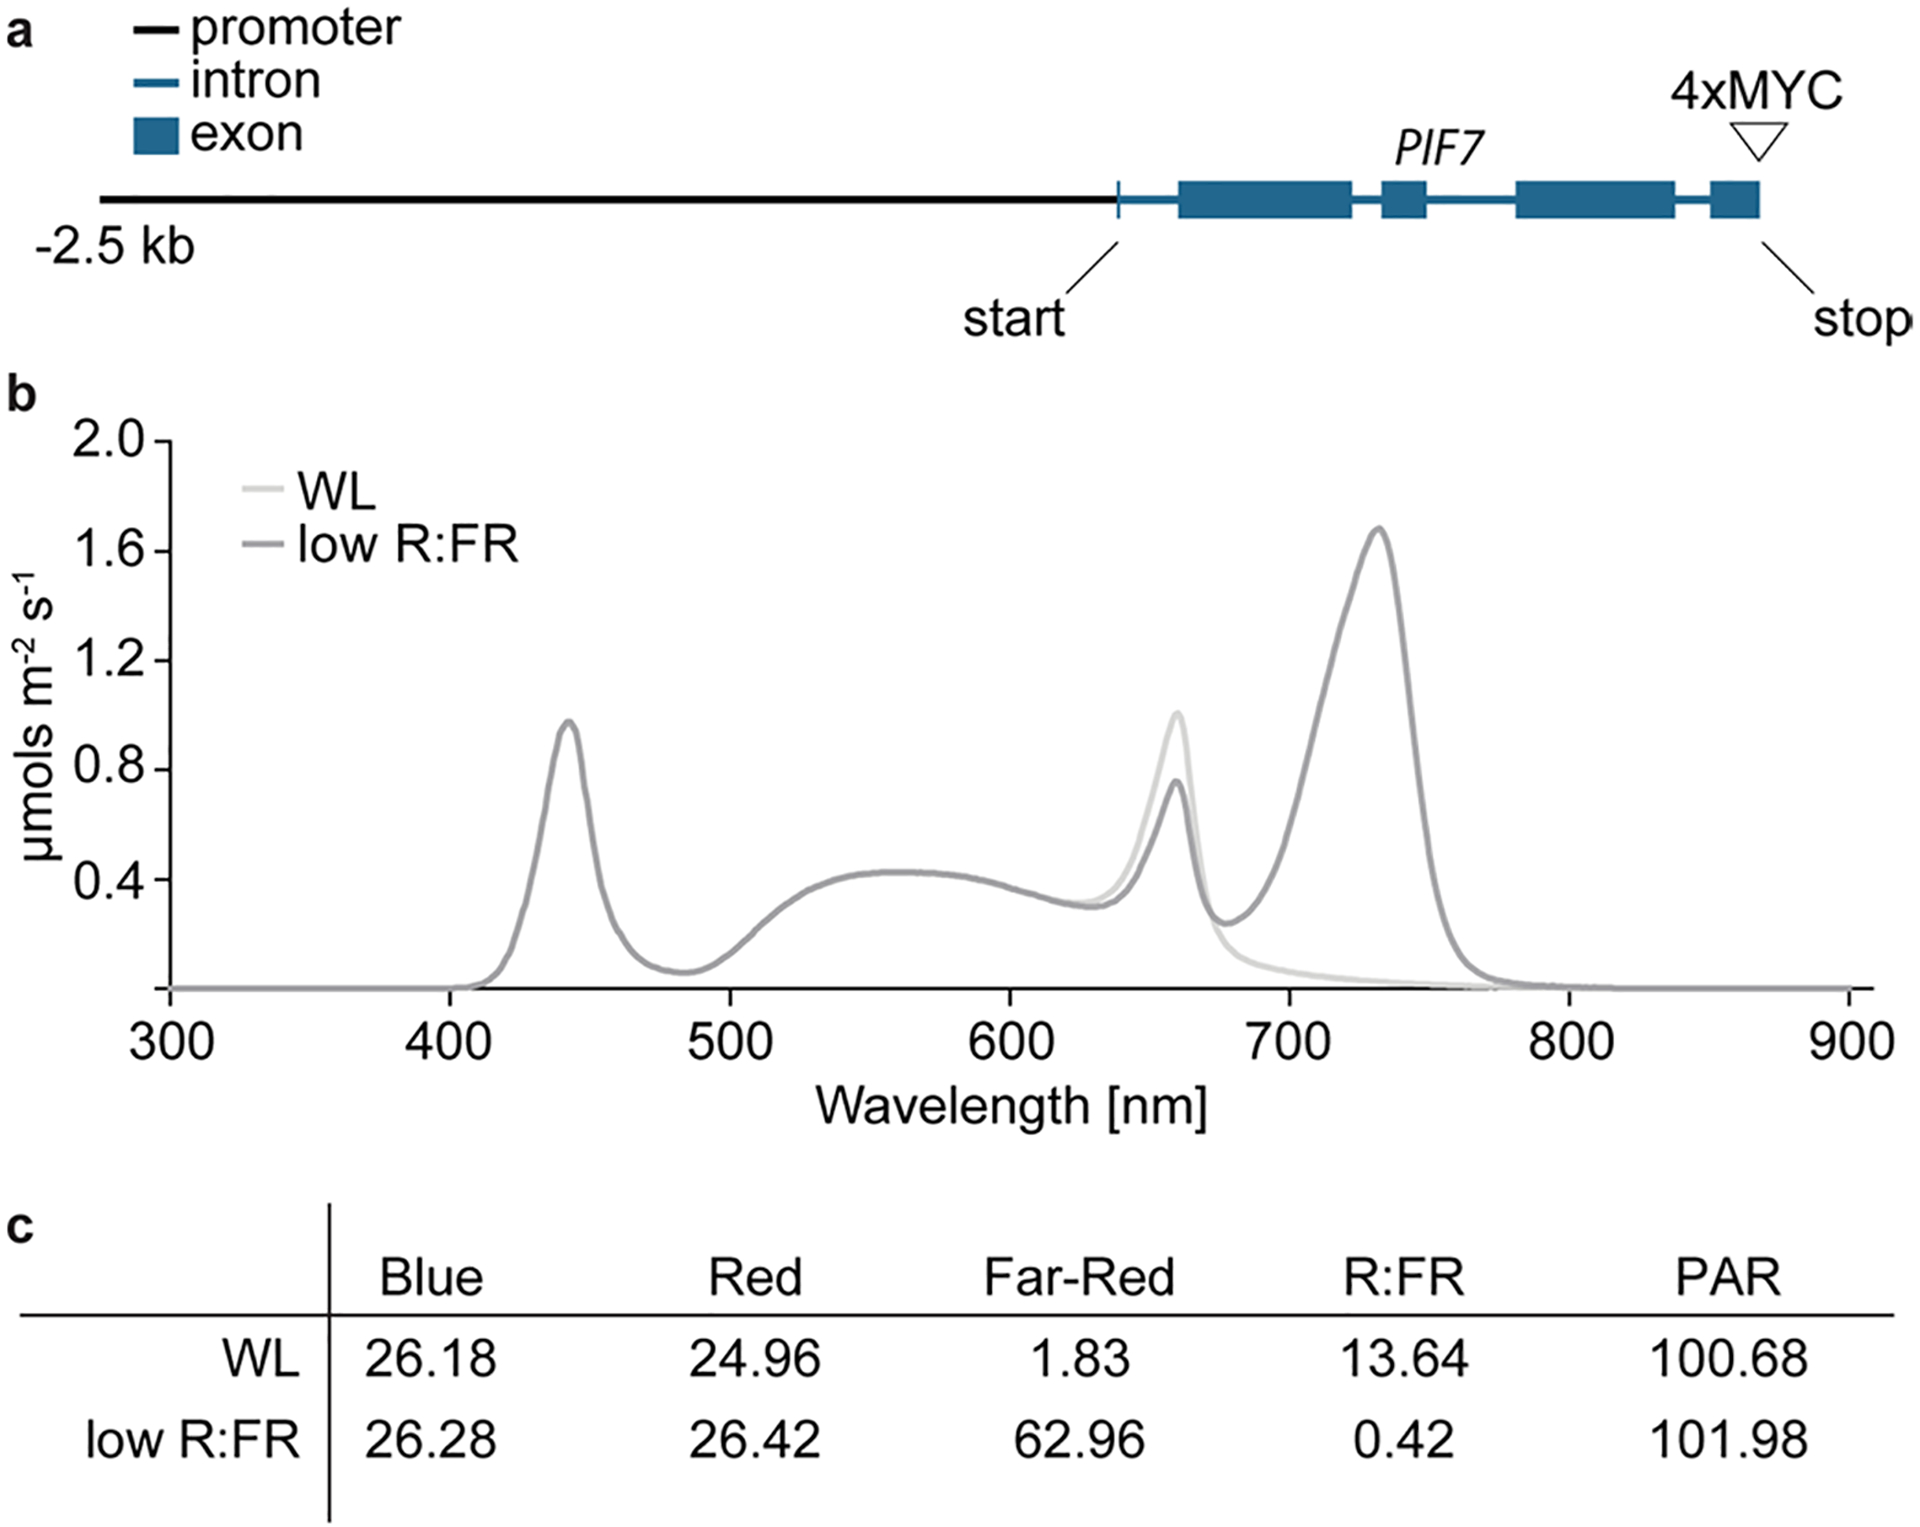
a, The PIF7:PIF7:4xMYC construct consists of a 4064 bp genomic PIF7 fragment starting at 2500 bp upstream of the PIF7 start codon and is fused to a 4xMyC tag. b, Light spectra and fluence rate for white light and low R:FR conditions. c, Light intensities in μmols m−2 s−1 and the ratio between red and far-red light for the two light conditions used in this study.
Supplementary Material
Acknowledgements
We thank A. Nagatani for kindly providing the anti-phyB antibody, X. Wu for materials and advice regarding Gibson cloning, J. Swift and H. Liu for critical comments on our manuscript and T. Haque for help with genotyping. B.C.W. was supported by an EMBO Long-Term Fellowship (ALTF 1514-2012), the Human Frontier Science Program (LT000222/2013-L) and the Salk Pioneer Postdoctoral Endowment Fund. M.Z. was supported by the Salk Pioneer Postdoctoral Endowment Fund as well as by a Deutsche Forschungsgemeinschaft (DFG) research fellowship (Za-730/1-1). This work was supported by grants from the National Science Foundation (NSF) (MCB-1024999, to J.R.E.), the Division of Chemical Sciences, Geosciences, and Biosciences, Office of Basic Energy Sciences of the US Department of Energy (DE-FG02-04ER15517, to J.R.E.), the Gordon and Betty Moore Foundation (GBMF3034, to J.R.E.) and the National Institutes of Health (NIH) (2R01GM087388, to M.C., and 5R35GM122604, to J.C.). J.C. and J.R.E. are investigators of the Howard Hughes Medical Institute.
Footnotes
Competing interests
The authors declare no competing interests.
Extended data is available for this paper at https://doi.org/10.1038/s41588-021-00882-3.
Supplementary information The online version contains supplementary material available at https://doi.org/10.1038/s41588-021-00882-3.
Online content
Any methods, additional references, Nature Research reporting summaries, source data, extended data, supplementary information, acknowledgements, peer review information; details of author contributions and competing interests; and statements of data and code availability are available at https://doi.org/10.1038/s41588-021-00882-3.
Data availability
All mutants and transgenic lines can be requested from the corresponding authors. All sequence data can be accessed at GEO (accession GSE139296). ChIP–seq and RNA-seq data can be browsed at http://neomorph.salk.edu/aj2/pages/hchen/PIF7-INO80-H2AZ.php. Source data are provided with this paper.
References
- 1.Leivar P & Monte E PIFs: systems integrators in plant development. Plant Cell 26, 56–78 (2014). [DOI] [PMC free article] [PubMed] [Google Scholar]
- 2.Paik I, Kathare PK, Kim JI & Huq E Expanding roles of PIFs in signal integration from multiple processes. Mol. Plant 10, 1035–1046 (2017). [DOI] [PMC free article] [PubMed] [Google Scholar]
- 3.Kumar SV et al. Transcription factor PIF4 controls the thermosensory activation of flowering. Nature 484, 242–245 (2012). [DOI] [PMC free article] [PubMed] [Google Scholar]
- 4.van der Woude LC et al. HISTONE DEACETYLASE 9 stimulates auxin-dependent thermomorphogenesis in Arabidopsis thaliana by mediating H2A.Z depletion. Proc. Natl Acad. Sci. USA 116, 25343–25354 (2019). [DOI] [PMC free article] [PubMed] [Google Scholar]
- 5.Coleman-Derr D & Zilberman D Deposition of histone variant H2A.Z within gene bodies regulates responsive genes. PLoS Genet. 8, e1002988 (2012). [DOI] [PMC free article] [PubMed] [Google Scholar]
- 6.Sura W et al. Dual role of the histone variant H2A.Z in transcriptional regulation of stress-response genes. Plant Cell 29, 791–807 (2017). [DOI] [PMC free article] [PubMed] [Google Scholar]
- 7.Zander M et al. Epigenetic silencing of a multifunctional plant stress regulator. eLife 8, e47835 (2019). [DOI] [PMC free article] [PubMed] [Google Scholar]
- 8.Burgie ES & Vierstra RD Phytochromes: an atomic perspective on photoactivation and signaling. Plant Cell 26, 4568–4583 (2014). [DOI] [PMC free article] [PubMed] [Google Scholar]
- 9.Rockwell NC & Lagarias JC Phytochrome evolution in 3D: deletion, duplication, and diversification. New Phytol. 225, 2283–2300 (2020). [DOI] [PMC free article] [PubMed] [Google Scholar]
- 10.Franklin KA Shade avoidance. New Phytol. 179, 930–944 (2008). [DOI] [PubMed] [Google Scholar]
- 11.Casal JJ Shade avoidance. Arabidopsis Book 10, e0157 (2012). [DOI] [PMC free article] [PubMed] [Google Scholar]
- 12.Morgan DC & Smith H Linear relationship between phytochrome photoequilibrium and growth in plants under natural radiation. Nature 262, 210–212 (1976). [Google Scholar]
- 13.Li L et al. Linking photoreceptor excitation to changes in plant architecture. Genes Dev. 26, 785–790 (2012). [DOI] [PMC free article] [PubMed] [Google Scholar]
- 14.Chung BYW et al. An RNA thermoswitch regulates daytime growth in Arabidopsis. Nat. Plants 6, 522–532 (2020). [DOI] [PMC free article] [PubMed] [Google Scholar]
- 15.Hornitschek P et al. Phytochrome interacting factors 4 and 5 control seedling growth in changing light conditions by directly controlling auxin signaling. Plant J. 71, 699–711 (2012). [DOI] [PubMed] [Google Scholar]
- 16.Oh E et al. Genome-wide analysis of genes targeted by PHYTOCHROME INTERACTING FACTOR 3-LIKE5 during seed germination in Arabidopsis. Plant Cell 21, 403–419 (2009). [DOI] [PMC free article] [PubMed] [Google Scholar]
- 17.Oh E, Zhu JY & Wang ZY Interaction between BZR1 and PIF4 integrates brassinosteroid and environmental responses. Nat. Cell Biol 14, 802–809 (2012). [DOI] [PMC free article] [PubMed] [Google Scholar]
- 18.Zhang Y et al. A quartet of PIF bHLH factors provides a transcriptionally centered signaling hub that regulates seedling morphogenesis through differential expression-patterning of shared target genes in Arabidopsis. PLoS Genet. 9, e1003244 (2013). [DOI] [PMC free article] [PubMed] [Google Scholar]
- 19.Steindler C et al. Shade avoidance responses are mediated by the ATHB-2 HD-zip protein, a negative regulator of gene expression. Development 126, 4235–4245 (1999). [DOI] [PubMed] [Google Scholar]
- 20.Sessa G et al. A dynamic balance between gene activation and repression regulates the shade avoidance response in Arabidopsis. Genes Dev. 19, 2811–2815 (2005). [DOI] [PMC free article] [PubMed] [Google Scholar]
- 21.Hassidim M, Harir Y, Yakir E, Kron I & Green RM Over-expression of CONSTANS-LIKE 5 can induce flowering in short-day grown Arabidopsis. Planta 230, 481–491 (2009). [DOI] [PubMed] [Google Scholar]
- 22.Barnes CE, English DM & Cowley SM Acetylation & Co: an expanding repertoire of histone acylations regulates chromatin and transcription. Essays Biochem. 63, 97–107 (2019). [DOI] [PMC free article] [PubMed] [Google Scholar]
- 23.Boycheva I, Vassileva V & Iantcheva A Histone acetyltransferases in plant development and plasticity. Curr. Genomics 15, 28–37 (2014). [DOI] [PMC free article] [PubMed] [Google Scholar]
- 24.Alatwi HE & Downs JA Removal of H2A.Z by INO80 promotes homologous recombination. EMBO Rep. 16, 986–994 (2015). [DOI] [PMC free article] [PubMed] [Google Scholar]
- 25.Brahma S et al. INO80 exchanges H2A.Z for H2A by translocating on DNA proximal to histone dimers. Nat. Commun 8, 15616 (2017). [DOI] [PMC free article] [PubMed] [Google Scholar]
- 26.Papamichos-Chronakis M, Watanabe S, Rando OJ & Peterson CL Global regulation of H2A.Z localization by the INO80 chromatin-remodeling enzyme is essential for genome integrity. Cell 144, 200–213 (2011). [DOI] [PMC free article] [PubMed] [Google Scholar]
- 27.Watanabe S et al. Structural analyses of the chromatin remodelling enzymes INO80-C and SWR-C. Nat. Commun 6, 7108 (2015). [DOI] [PMC free article] [PubMed] [Google Scholar]
- 28.Mao Z et al. Anp32e, a higher eukaryotic histone chaperone directs preferential recognition for H2A.Z. Cell Res. 24, 389–399 (2014). [DOI] [PMC free article] [PubMed] [Google Scholar]
- 29.Obri A et al. ANP32E is a histone chaperone that removes H2A.Z from chromatin. Nature 505, 648–653 (2014). [DOI] [PubMed] [Google Scholar]
- 30.Zilberman D, Coleman-Derr D, Ballinger T & Henikoff S Histone H2A.Z and DNA methylation are mutually antagonistic chromatin marks. Nature 456, 125–129 (2008). [DOI] [PMC free article] [PubMed] [Google Scholar]
- 31.Fiorucci AS et al. PHYTOCHROME INTERACTING FACTOR 7 is important for early responses to elevated temperature in Arabidopsis seedlings. New Phytol. 226, 50–58 (2019). [DOI] [PMC free article] [PubMed] [Google Scholar]
- 32.Jung JH et al. Phytochromes function as thermosensors in Arabidopsis. Science 354, 886–889 (2016). [DOI] [PubMed] [Google Scholar]
- 33.Legris M et al. Phytochrome B integrates light and temperature signals in Arabidopsis. Science 354, 897–900 (2016). [DOI] [PubMed] [Google Scholar]
- 34.Lorrain S, Allen T, Duek PD, Whitelam GC & Fankhauser C Phytochrome-mediated inhibition of shade avoidance involves degradation of growth-promoting bHLH transcription factors. Plant J. 53, 312–323 (2008). [DOI] [PubMed] [Google Scholar]
- 35.Khanna R et al. The basic helix-loop-helix transcription factor PIF5 acts on ethylene biosynthesis and phytochrome signaling by distinct mechanisms. Plant Cell 19, 3915–3929 (2007). [DOI] [PMC free article] [PubMed] [Google Scholar]
- 36.Leivar P et al. The Arabidopsis phytochrome-interacting factor PIF7, together with PIF3 and PIF4, regulates responses to prolonged red light by modulating phyB levels. Plant Cell 20, 337–352 (2008). [DOI] [PMC free article] [PubMed] [Google Scholar]
- 37.Leivar P et al. Multiple phytochrome-interacting bHLH transcription factors repress premature seedling photomorphogenesis in darkness. Curr. Biol 18, 1815–1823 (2008). [DOI] [PMC free article] [PubMed] [Google Scholar]
- 38.Reed JW, Nagpal P, Poole DS, Furuya M & Chory J Mutations in the gene for the red/far-red light receptor phytochrome B alter cell elongation and physiological responses throughout Arabidopsis development. Plant Cell 5, 147–157 (1993). [DOI] [PMC free article] [PubMed] [Google Scholar]
- 39.Kandasamy MK, McKinney EC, Deal RB, Smith AP & Meagher RB Arabidopsis actin-related protein ARP5 in multicellular development and DNA repair. Dev. Biol 335, 22–32 (2009). [DOI] [PMC free article] [PubMed] [Google Scholar]
- 40.Nakagawa T et al. Development of series of gateway binary vectors, pGWBs, for realizing efficient construction of fusion genes for plant transformation. J. Biosci. Bioeng 104, 34–41 (2007). [DOI] [PubMed] [Google Scholar]
- 41.Jaillais Y et al. Tyrosine phosphorylation controls brassinosteroid receptor activation by triggering membrane release of its kinase inhibitor. Genes Dev. 25, 232–237 (2011). [DOI] [PMC free article] [PubMed] [Google Scholar]
- 42.Wu X et al. Modes of intercellular transcription factor movement in the Arabidopsis apex. Development 130, 3735–3745 (2003). [DOI] [PubMed] [Google Scholar]
- 43.Yoo SY et al. The 35S promoter used in a selectable marker gene of a plant transformation vector affects the expression of the transgene. Planta 221, 523–530 (2005). [DOI] [PubMed] [Google Scholar]
- 44.Clough SJ & Bent AF Floral dip: a simplified method for Agrobacterium-mediated transformation of Arabidopsis thaliana. Plant J. 16, 735–743 (1998). [DOI] [PubMed] [Google Scholar]
- 45.Nito K, Wong CC, Yates JR 3rd & Chory J Tyrosine phosphorylation regulates the activity of phytochrome photoreceptors. Cell Rep. 3, 1970–1979 (2013). [DOI] [PMC free article] [PubMed] [Google Scholar]
- 46.Galvão VC et al. PIF transcription factors link a neighbor threat cue to accelerated reproduction in Arabidopsis. Nat. Commun 10, 4005 (2019). [DOI] [PMC free article] [PubMed] [Google Scholar]
- 47.Feng CM, Qiu Y, Van Buskirk EK, Yang EJ & Chen M Light-regulated gene repositioning in Arabidopsis. Nat. Commun 5, 3027 (2014). [DOI] [PMC free article] [PubMed] [Google Scholar]
- 48.Sauer M, Paciorek T, Benková E & Friml J Immunocytochemical techniques for whole-mount in situ protein localization in plants. Nat. Protoc 1, 98–103 (2006). [DOI] [PubMed] [Google Scholar]
- 49.Kaufmann K et al. Chromatin immunoprecipitation (ChIP) of plant transcription factors followed by sequencing (ChIP-SEQ) or hybridization to whole genome arrays (ChIP-CHIP). Nat. Protoc 5, 457–472 (2010). [DOI] [PubMed] [Google Scholar]
- 50.Langmead B Aligning short sequencing reads with Bowtie. Curr. Protoc. Bioinform 32, 11.7.1–11.7.14 (2010). [DOI] [PMC free article] [PubMed] [Google Scholar]
- 51.Song L et al. A transcription factor hierarchy defines an environmental stress response network. Science 354, aag1550 (2016). [DOI] [PMC free article] [PubMed] [Google Scholar]
- 52.Dobin A et al. STAR: ultrafast universal RNA-seq aligner. Bioinformatics 29, 15–21 (2013). [DOI] [PMC free article] [PubMed] [Google Scholar]
- 53.Zang C et al. A clustering approach for identification of enriched domains from histone modification ChIP-Seq data. Bioinformatics 25, 1952–1958 (2009). [DOI] [PMC free article] [PubMed] [Google Scholar]
- 54.Quinlan AR & Hall IM BEDTools: a flexible suite of utilities for comparing genomic features. Bioinformatics 26, 841–842 (2010). [DOI] [PMC free article] [PubMed] [Google Scholar]
- 55.Guo Y, Mahony S & Gifford DK High resolution genome wide binding event finding and motif discovery reveals transcription factor spatial binding constraints. PLoS Comput. Biol 8, e1002638 (2012). [DOI] [PMC free article] [PubMed] [Google Scholar]
- 56.Machanick P & Bailey TL MEME-ChIP: motif analysis of large DNA datasets. Bioinformatics 27, 1696–1697 (2011). [DOI] [PMC free article] [PubMed] [Google Scholar]
- 57.Li H et al. The Sequence Alignment/Map format and SAMtools. Bioinformatics 25, 2078–2079 (2009). [DOI] [PMC free article] [PubMed] [Google Scholar]
- 58.Dennis G Jr. et al. DAVID: database for annotation, visualization, and integrated discovery. Genome Biol. 4, R60 (2003). [PubMed] [Google Scholar]
- 59.Shin H, Liu T, Manrai AK & Liu XS CEAS: cis-regulatory element annotation system. Bioinformatics 25, 2605–2606 (2009). [DOI] [PubMed] [Google Scholar]
- 60.Ramírez F, Dündar F, Diehl S, Grüning BA & Manke T deepTools: a flexible platform for exploring deep-sequencing data. Nucleic Acids Res. 42, W187–W191 (2014). [DOI] [PMC free article] [PubMed] [Google Scholar]
- 61.Kent WJ et al. The human genome browser at UCSC. Genome Res 12, 996–1006 (2002). [DOI] [PMC free article] [PubMed] [Google Scholar]
- 62.Trapnell C et al. Transcript assembly and quantification by RNA-Seq reveals unannotated transcripts and isoform switching during cell differentiation. Nat. Biotechnol 28, 511–515 (2010). [DOI] [PMC free article] [PubMed] [Google Scholar]
- 63.Lister R et al. Highly integrated single-base resolution maps of the epigenome in Arabidopsis. Cell 133, 523–536 (2008). [DOI] [PMC free article] [PubMed] [Google Scholar]
- 64.Eustermann S et al. Structural basis for ATP-dependent chromatin remodelling by the INO80 complex. Nature 556, 386–390 (2018). [DOI] [PMC free article] [PubMed] [Google Scholar]
Associated Data
This section collects any data citations, data availability statements, or supplementary materials included in this article.
Supplementary Materials
Data Availability Statement
All mutants and transgenic lines can be requested from the corresponding authors. All sequence data can be accessed at GEO (accession GSE139296). ChIP–seq and RNA-seq data can be browsed at http://neomorph.salk.edu/aj2/pages/hchen/PIF7-INO80-H2AZ.php. Source data are provided with this paper.


