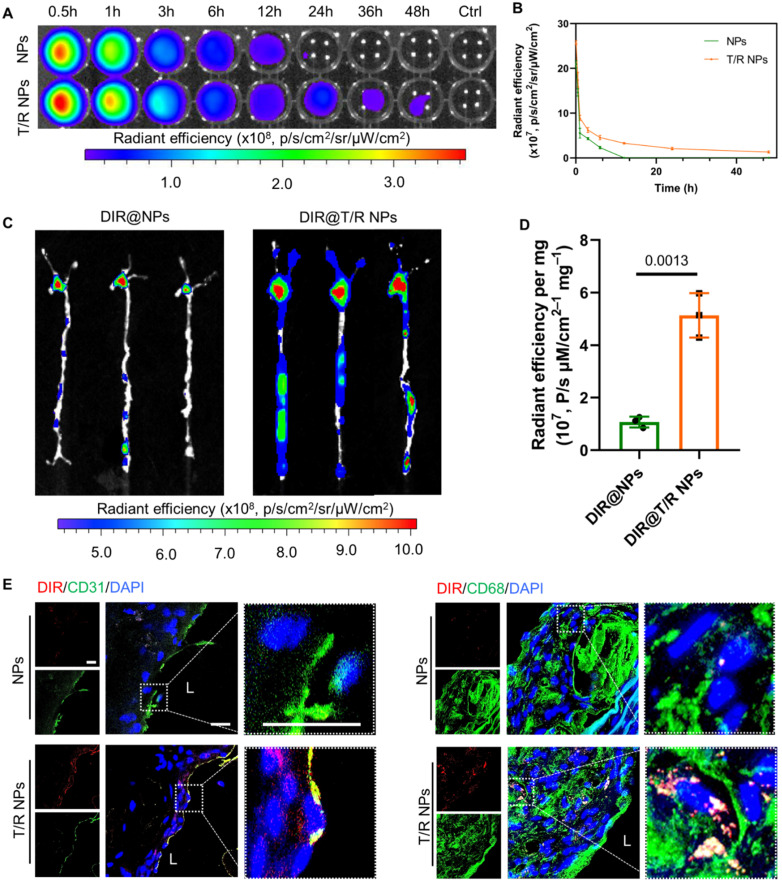
Figure 5.
In vivo circulation and targeting capability of T/R NPs in mice after i.v. administration. (A) Ex vivo image of whole blood collected at various time points after i.v. DIR@NPs and DIR@T/R NPs into C57BL/6 mice, and the fluorescence intensities quantification (B). (C) Ex vivo fluorescence images and (D) quantitative analysis of DIR fluorescence in aorta 6 hours after DIR@NPs and DIR@T/R NPs injection into established atherosclerotic mice. (E) CLSM analysis of the co-location of DIR@T/R NPs (red) and endothelial cells (green), or DIR@T/R NPs (red) and macrophages (green) in atherosclerotic plaques. Data in (B and D) are mean ± SD (n = 3).

