

Abstract
Unlike several other tumor types, prostate cancer (PCa) rarely responds to immune checkpoint blockade (ICB). To define tumor-cell intrinsic factors that contribute to PCa progression and resistance to ICB, we analyzed PCa epithelial cells from castration-sensitive and castration-resistant samples using implanted tumors, cell lines, transgenic models, and human tissue. We found that castration resulted in increased expression of Interleukin-8 (IL-8) and its likely murine homolog Cxcl15 in prostate epithelial cells. We showed that these chemokines drove subsequent intra-tumoral infiltration of tumor-promoting polymorphonuclear myeloid-derived suppressor cells (PMN-MDSCs), which was largely abrogated when IL-8 signaling was blocked genetically or pharmacologically. Targeting IL-8 signaling in combination with ICB delayed the onset of castration-resistance and increased the density of polyfunctional CD8 T cells in tumors. Our findings establish a novel mechanism by which castration mediates IL-8 secretion and subsequent PMN-MDSC infiltration and highlight blockade of the IL8/CXCR2 axis as a potential therapeutic intervention.
Keywords: androgen receptor, IL-8, CXCL8, CXCR2, immunotherapy, PMN-MDSCs, myeloid-derived suppressor cells
After primary therapy with surgery or radiation, approximately 40% of PCa patients develop progressive disease. The standard treatment for recurrent PCa is androgen-deprivation therapy (ADT), but the majority of these patients eventually develop castration-resistance (CR). Although some patients with metastatic castration-resistant PCa benefit from the cancer vaccine sipuleucel-T1; immune checkpoint blockade (ICB) with either anti-CTLA-42,3 or anti-PD-14,5 has failed to reliably induce clinically meaningful responses. Potential reasons for this include a low tumor mutation burden (TMB), poor infiltration by CD8 T cells6, and ADT-mediated infiltration by regulatory T cells (Tregs), which has been documented in both animal models7 and patients8.
Additional emerging data further suggest that immune-resistance in PCa is mediated in part by infiltrating dysfunctional neutrophils, known as PMN-MDSCs (Polymorphonuclear-Myeloid Derived Suppressor Cells)9–11. PMN-MDSCs decrease T-cell nutrient availability and produce reactive nitrogen species that attenuate antigen recognition - leading to decreased CD8 T cell proliferation and function10. More recently, PMN-MDSC were shown to directly promote castration resistance through the secretion of IL-2312. Critically, the mechanism(s) regulating the recruitment of PMN-MDSCs to the prostate TME are thus far poorly understood.
Results
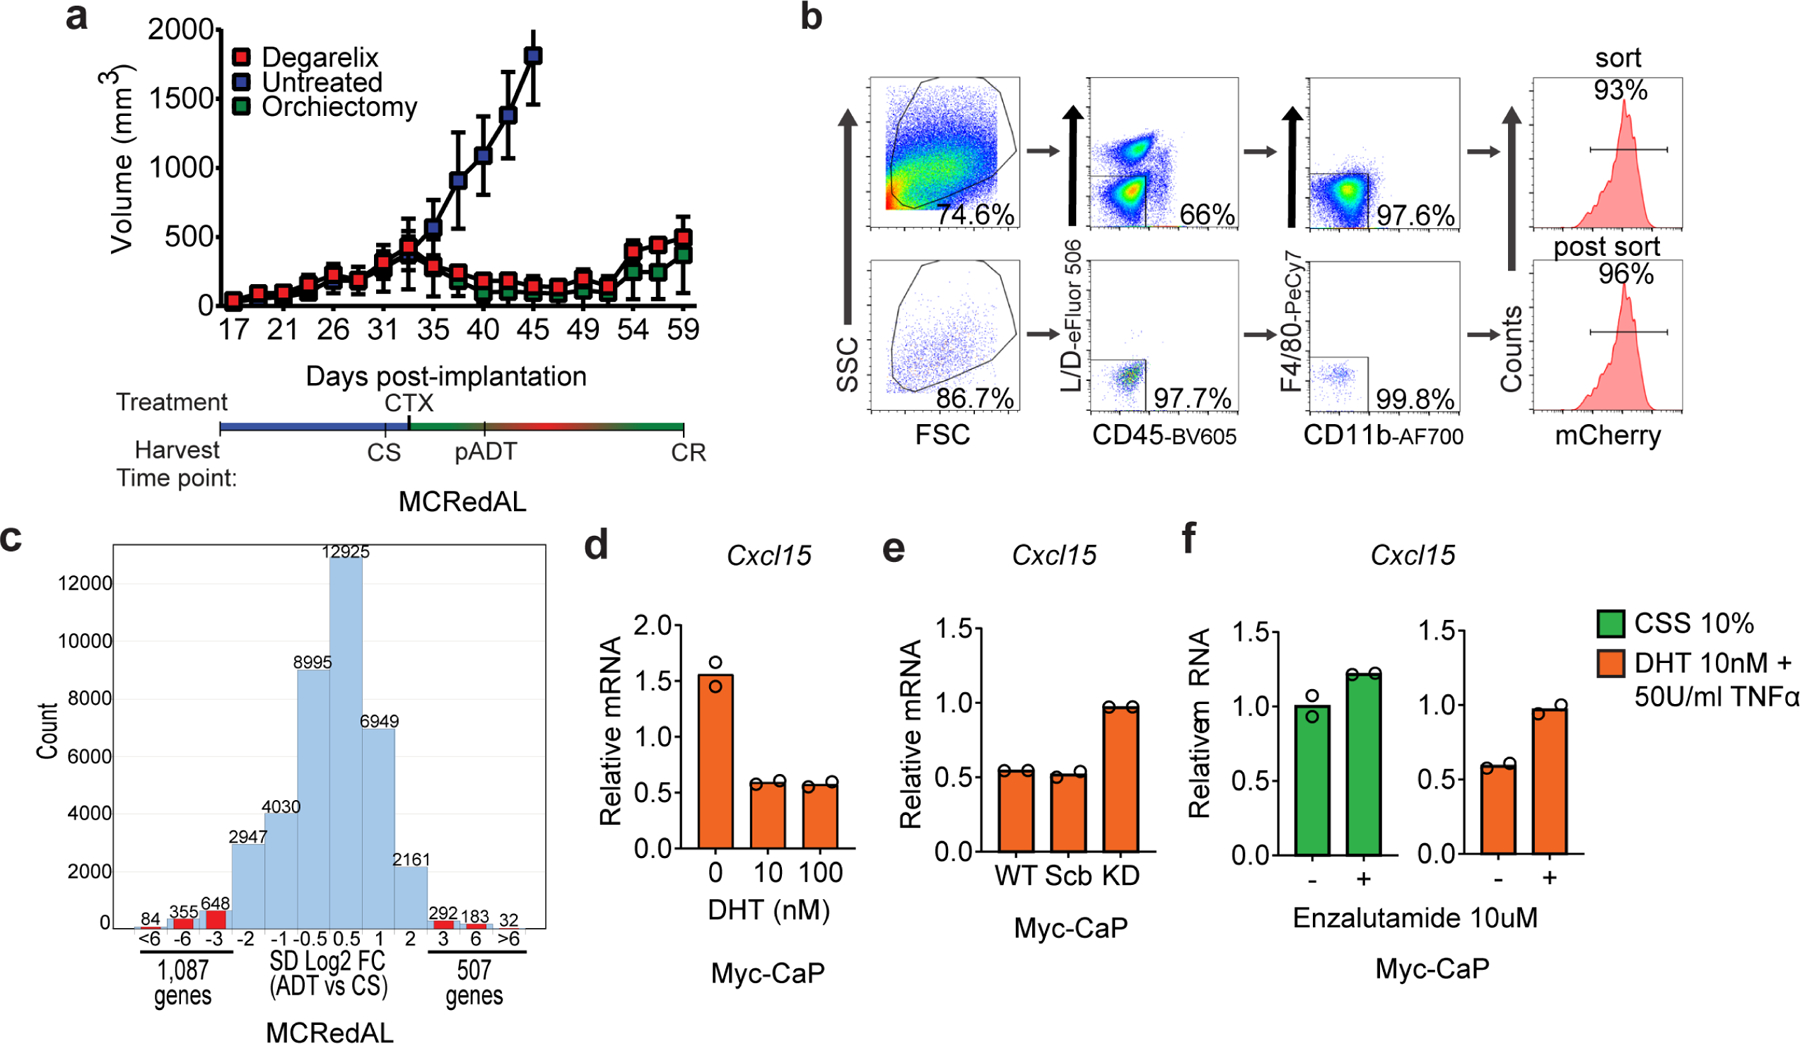
To better understand tumor-cell intrinsic factors involved in immunotherapy resistance in post-castration PCa, including those with a potential role in PMN-MDSC recruitment, we used the MCRedAL murine PCa cell line, an RFP expressing version of the Myc-CaP cell line driven by MYC overexpression13,14. Like human prostate cancer, MCRedAL tumors are initially castration-sensitive (CS), but castration-resistance (CR) develops approximately 30 days after castration (Extended Data Fig. 1a). Pre- and post-ADT tumor cells were sorted to ≈ 96% purity (Extended Data Fig. 1b) and analyzed (Figs. 1a-c and Extended Data Fig. 1c). We found a number of cytokine and chemokine transcripts significantly up-regulated post-ADT, including Csf1, Cxcl2, Cxcl5, Cxcl12, and Cxcl15 (Fig. 1b right); notably each of these has a conserved N-terminal tripeptide glutamate-leucine-arginine (ELR) motif adjacent to its CXC motif (Supplementary Table 1), a common feature of chemokines with the ability to recruit neutrophils15. Of these, Cxcl15, one of several murine homologs of human CXCL8 (IL-8), was of particular interest as it was most significantly overexpressed and has been reported to be expressed by a number of epithelial tissue types15–17. Gene set enrichment analysis (GSEA) additionally showed up-regulation of several pro-inflammatory pathways, including TNFα signaling via NF-κB (Fig. 1c).
Figure 1 |. Androgen-Deprivation Therapy (ADT) Regulates Cxcl15 Expression in Murine Prostate Cancer Cells.
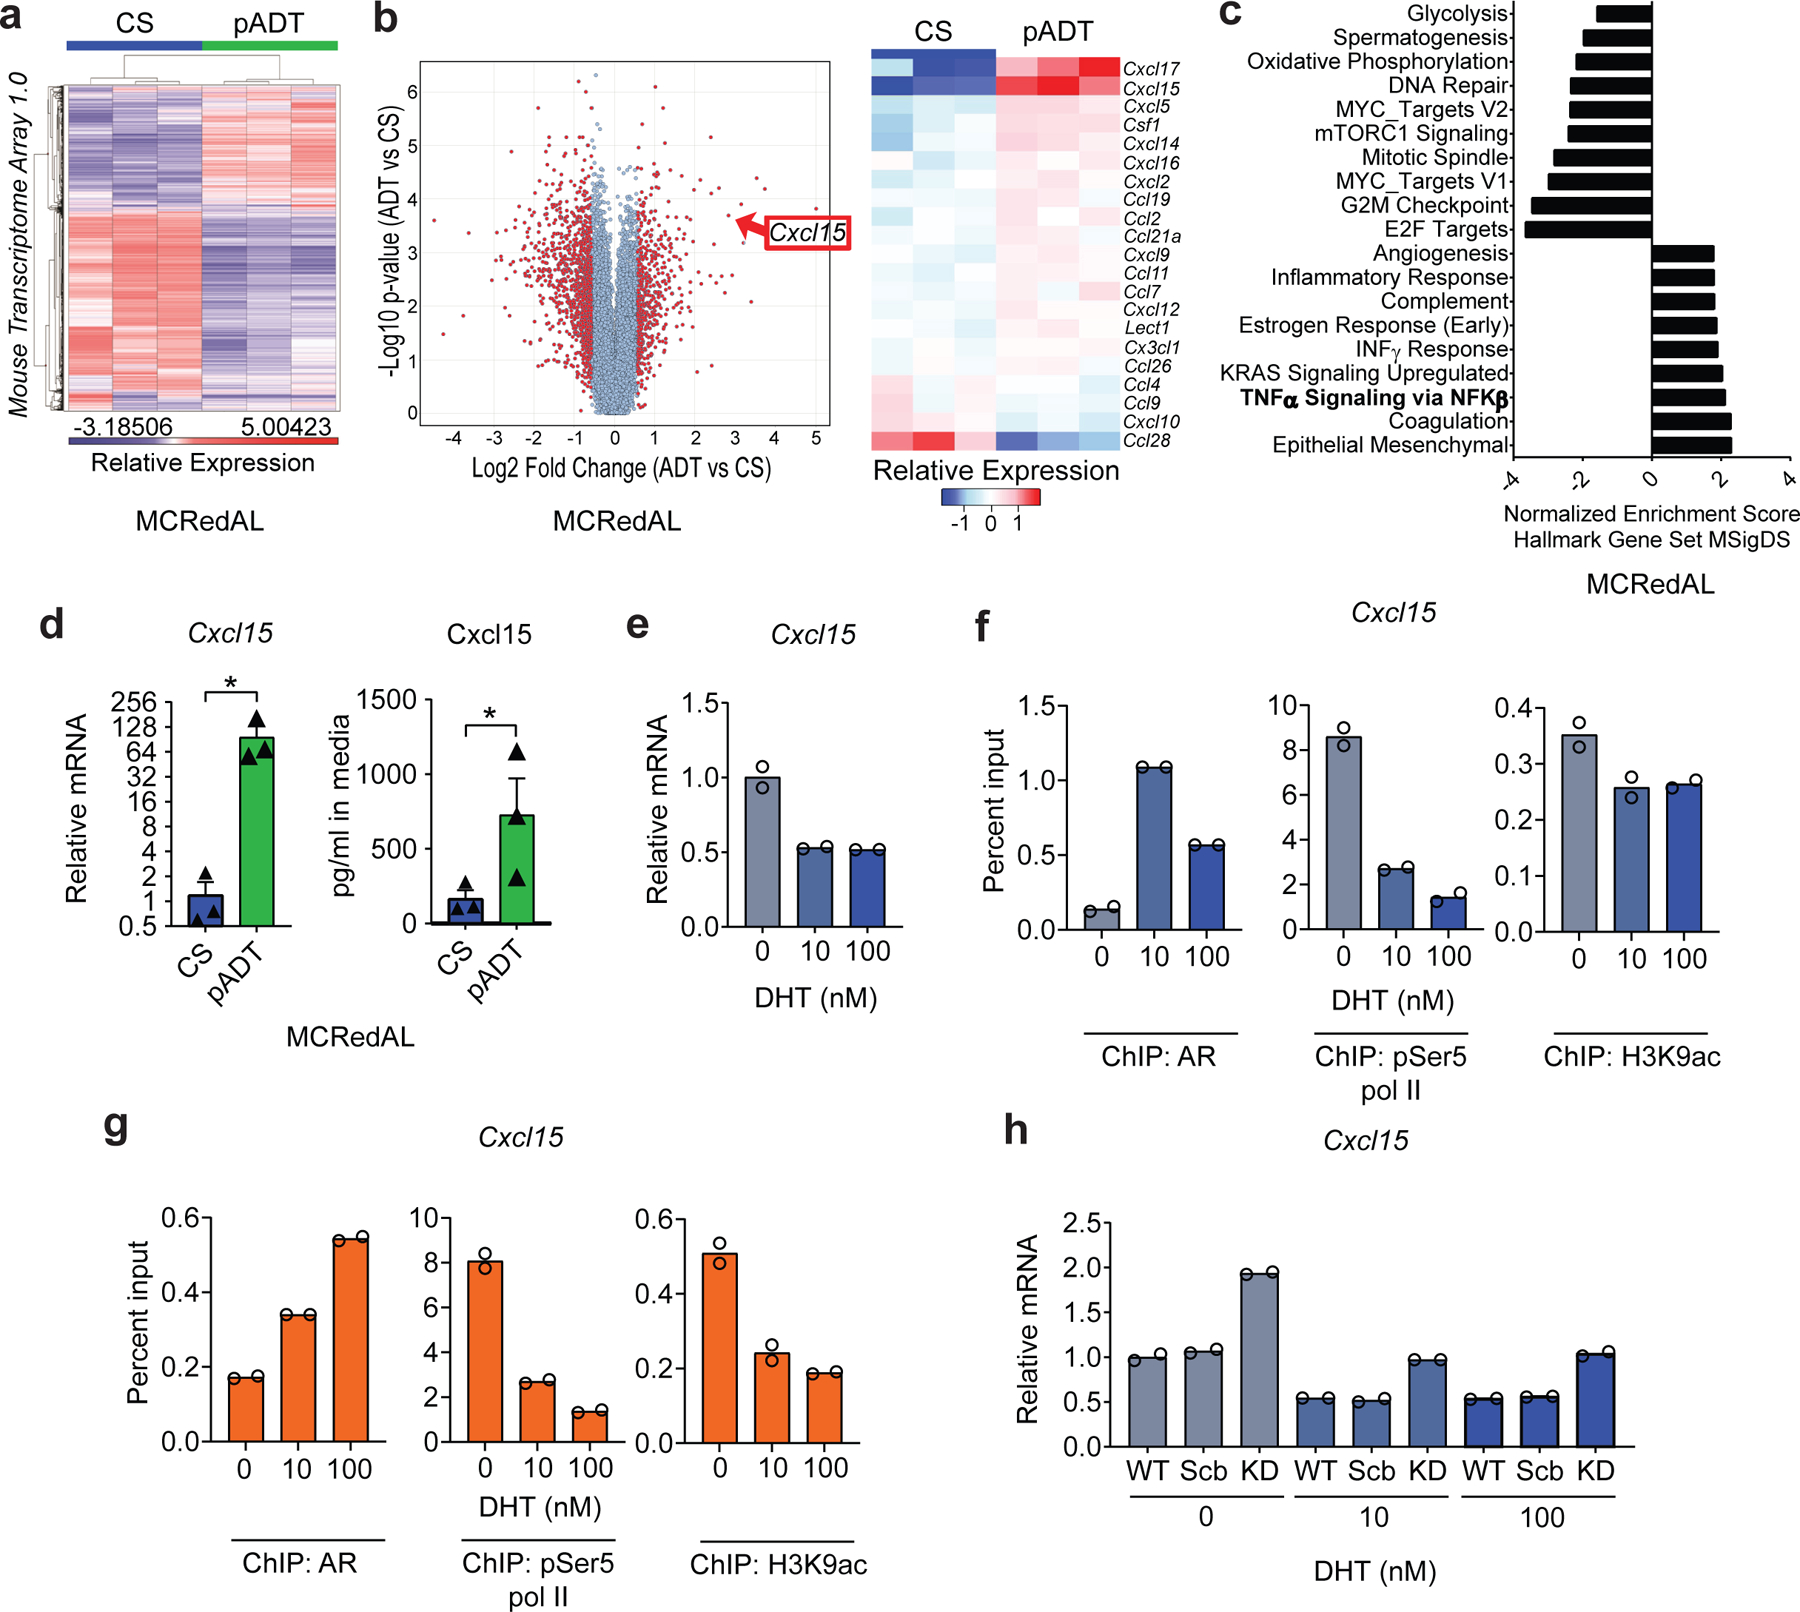
a, Differential expression profile of tumor epithelial cells isolated from castration-sensitive (CS) and ADT-treated MCRedAL tumor bearing mice. Heatmap showing transcripts 3 standard deviations away from the mean (n=3 biologically-independent samples per group). b, Differential chemokine expression of tumor epithelial cells isolated from CS and pADT tumor bearing mice, replicates as in a. Left, volcano plot showing differential gene expression among all MTA 1.0 microarray transcripts. Right, heatmap of normalized chemokine transcripts. c, Hallmarks gene sets pathway analysis post-ADT shows NF-κB up-regulation by castration. d, Gene and protein expression of Cxcl15 in indicated sorted MCRedAL tumor cells in vitro by qRT-PCR (p=0.0237) and ELISA (p=0.0436), respectively, replicates as in a. e, qRT-PCR quantification of Cxcl15 in Myc-CaP cells cultured at indicated concentrations of DHT for 8hrs, cells cultured in androgen-free media for 48hrs before DHT stimulation (n=2 independently cultured replicates per condition, repeated x2). Expression levels normalized to mean ∆CT level in samples cultured in androgen free media without DHT. f, Percentage input bound in ChIP-qPCR assays assessing binding of AR, pSer5 Pol II, and H3K9ac at the Cxcl15 promoter in Myc-CaP cells cultured at indicated concentrations of DHT for 8hrs, cells cultured in androgen-free media for 48hrs before DHT stimulation (n=2 technical replicates per group, repeated x1). g, Percentage input bound in ChIP-qPCR assays assessing binding of AR, pSer5 Pol II, and H3K9ac at the Cxcl15 promoter in Myc-CaP cells cultured at indicated concentrations of DHT for 8hrs and TNFα (50Units/ml) for 6hrs, cells cultured in androgen-free media for 48hrs before DHT stimulation (replicates as in f). h, qRT-PCR quantification of Cxcl15 in Myc-CaP WT cells expressing either nothing, scramble (Scr) shRNA, or an anti-AR shRNA (KD: knockdown) cultured at indicated concentrations of DHT for 8hrs, cells cultured in androgen-free media for 24hrs before DHT stimulation (n=2 independently cultured replicates per condition, repeated x2). Expression levels normalized to mean ∆CT level in WT samples cultured in androgen free media without DHT. Bar plots represent means with SEM. Unpaired one-tailed t-tests were performed.
Using Myc-CaP cells, we confirmed upregulation of tumor-cell intrinsic Cxcl15 post-ADT at both the message and protein levels (Fig. 1d). Having shown that blocking androgen signaling increases Cxcl15, we hypothesized that activating androgen signaling would decrease Cxcl15 levels. To test this, we cultured Myc-CaP cells with increasing concentrations of dihydrotestosterone (DHT). Consistent with our hypothesis, we found decreased Cxcl15 message with increasing DHT concentrations (Fig. 1e). Because baseline NF-κB signaling may be required for full IL-8 expression18–20, we repeated these studies in the presence of TNFα, with consistent results (Extended Data Fig. 1d).
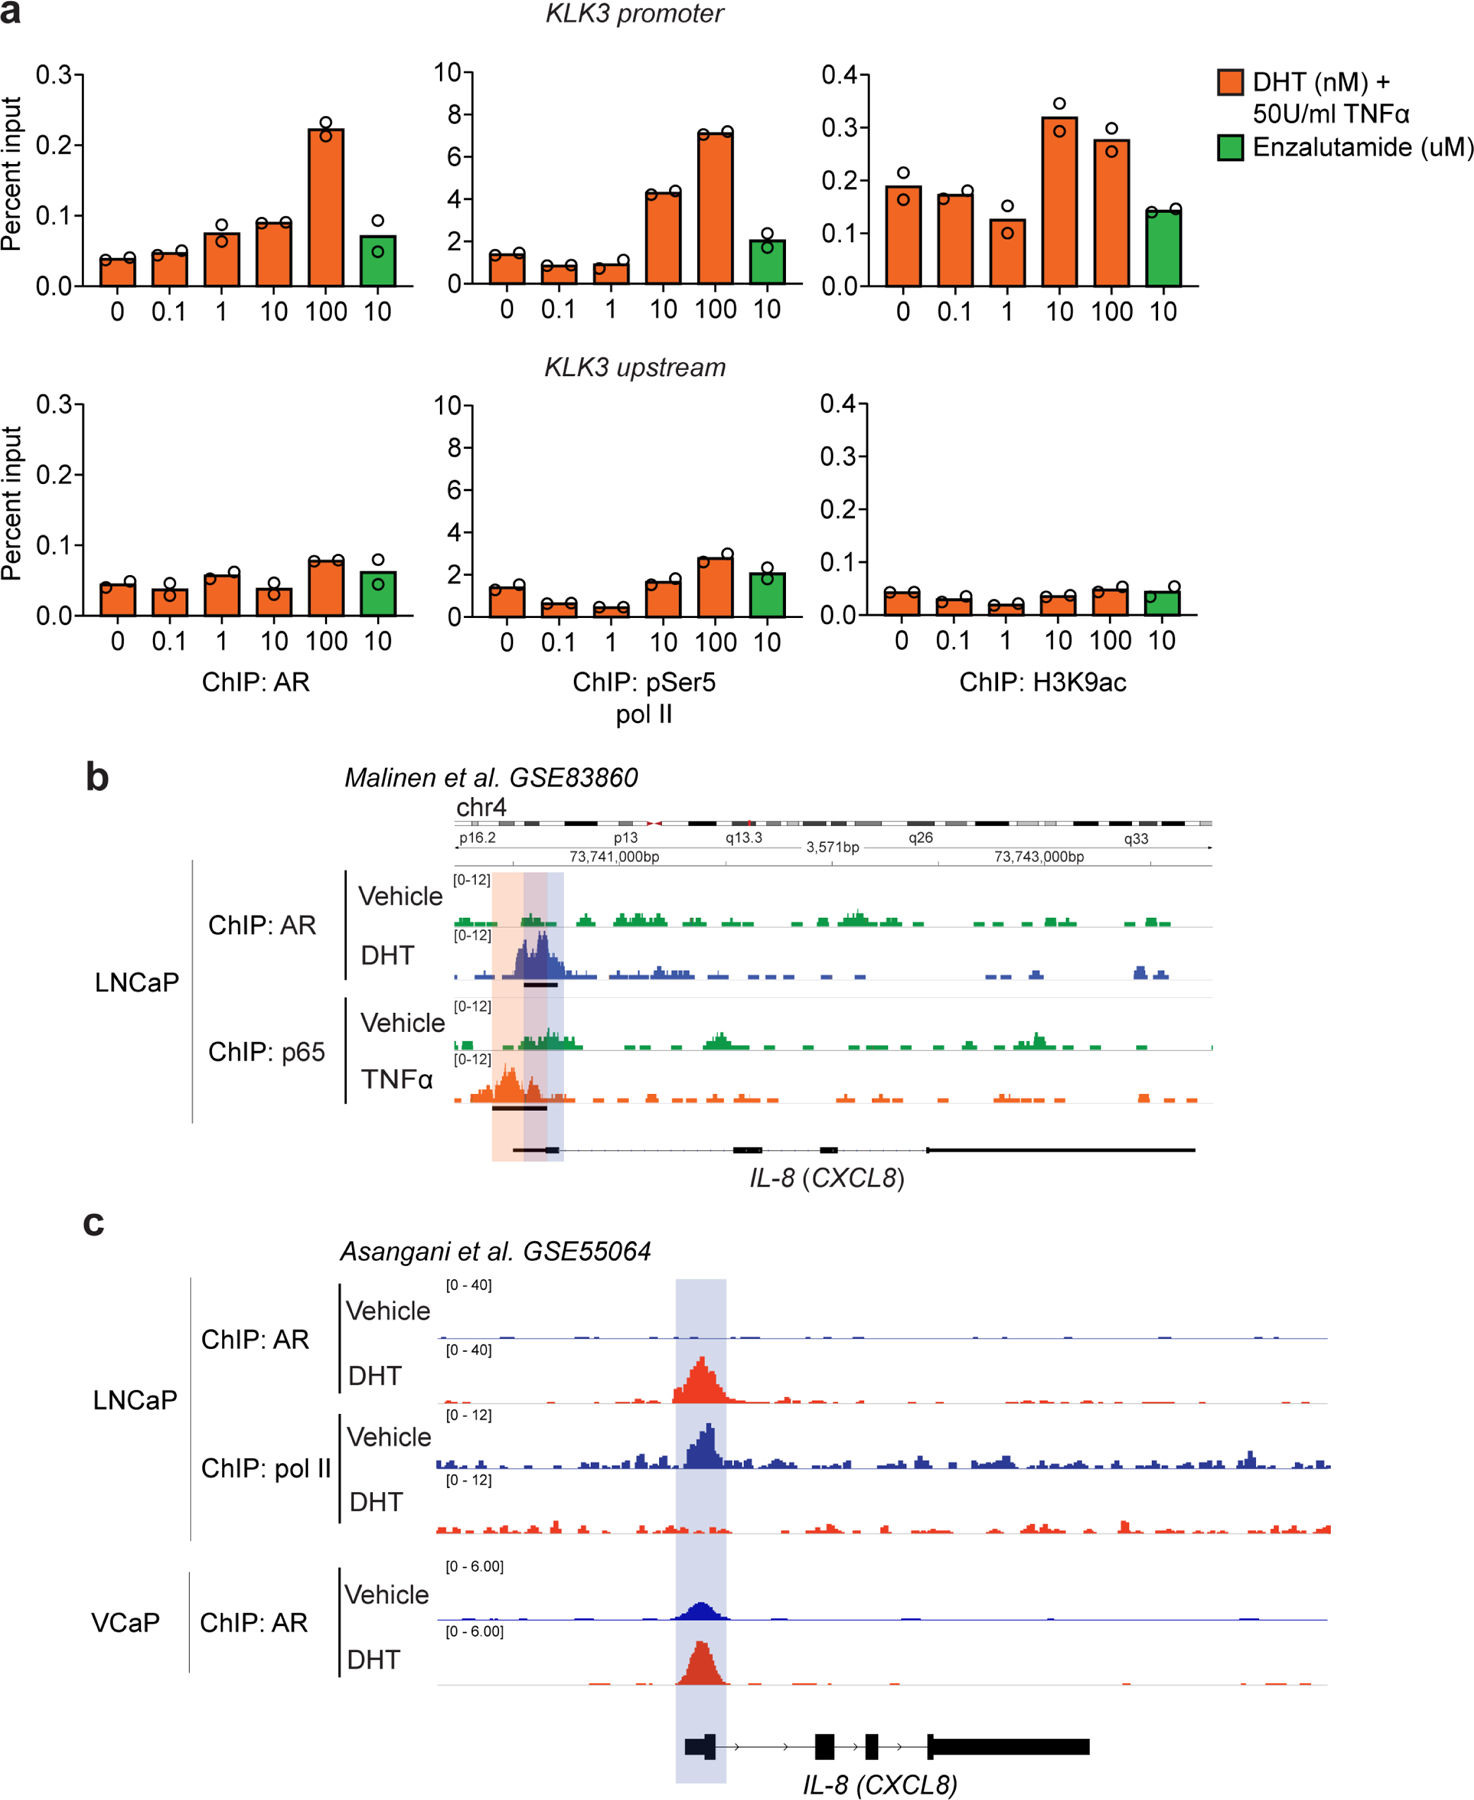
To test for androgen receptor (AR)-mediated transcriptional regulation of this murine IL-8 homolog, we quantified AR binding and recruitment of the active transcription marks phosphorylated RNA polymerase II (pSer5 pol II) and histone H3 lysine 9 acetylation (H3K9ac) at the Cxcl15 locus using ChIP-qPCR. AR binding was associated with decreased recruitment of both of these active gene transcription marks to the Cxcl15 locus in either the presence or absence of exogenously added TNFα (Fig. 1f-g). To confirm specificity, we used shRNA to knock-down murine AR in Myc-CaP cells, which subsequently increased Cxcl15 mRNA expression as predicted (Fig. 1h and Extended Data Fig. 1e). AR blockade with enzalutamide showed similar effects (Extended Data Fig. 1f), although those results were more apparent in the presence of exogenous TNFα Consistent with a requirement for NF-κB activation for full IL-8 expression18–20, castration sensitive (CS) LNCaP cells expressed nearly undetectable IL-8 message in the absence of exogenous TNFα (Fig. 2a, left), while IL-8 message decreased with increased androgen receptor signaling (Fig. 2a, right) in a manner similar to murine PCa cells. To test for AR-mediated transcriptional regulation of IL-8, we performed additional ChIP-qPCR studies in human cells (LNCaP); here we found that AR binding was associated with decreased recruitment of pSer5 pol II to the human IL-8 (CXCL8) locus (Fig. 2b), while recruitment of active gene transcription marks to the promoter of a well-established AR-regulated gene, KLK3 (PSA), was increased with DHT (Extended Data Fig. 2a, top). Further, AR blockade with enzalutamide in human LNCaP cells increased IL-8 message levels (Fig. 2c).
Figure 2 |. Androgen Receptor Signaling Modulates IL-8 Expression in Human Prostate Cancer Cells.
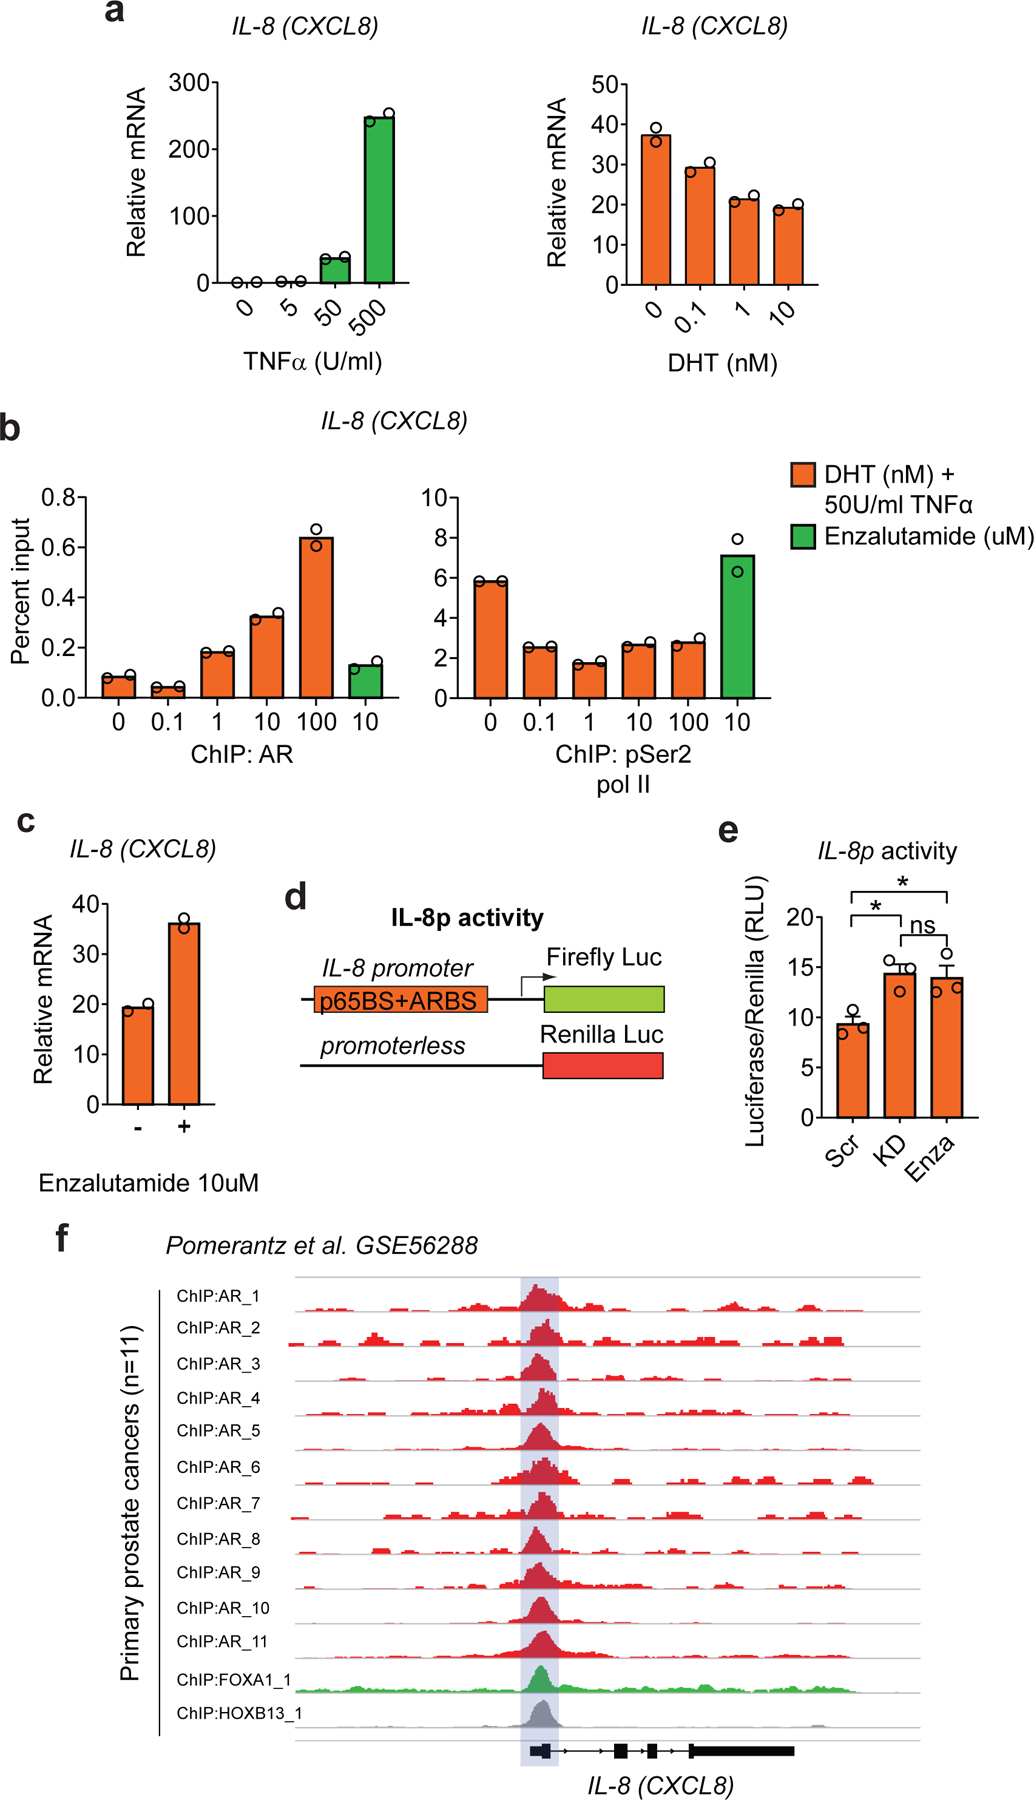
a, qRT-PCR quantification of IL-8 in LNCaP cells cultured at indicated concentrations of TNFα (Units/ml) for 6hrs (left) or of DHT for 8hrs and TNFα (50Units/ml) for 6hrs (right), cells cultured in androgen-free media for 72hrs before TNFα or DHT stimulation (n=2 independently cultured replicates per condition, repeated x2). Expression levels normalized to mean ∆CT level in samples cultured in androgen free media without TNFα or DHT. b, Percentage input bound in ChIP-qPCR assays assessing binding of AR and pSer5 Pol II at the IL-8 (CXCL8) promoter in LNCaP cells cultured at indicated concentrations of DHT for 8hrs and TNFα (50Units/ml) for 6hrs, cells cultured in androgen-free media for 72hrs before DHT stimulation (n=2 technical replicates per group, repeated x1). An Enzalutamide (10µM) treated group was included as a control. c, qRT-PCR quantification of IL-8 in LNCaP cells cultured in the presence of DHT (10nM) for 8hrs and TNFα (50Units/ml) for 6hrs in the presence and absence of the AR blocker Enzalutamide (10µM), cells cultured in androgen-free media for 72hrs before stimulation (n=2 independently cultured replicates per condition, repeated x2). d, Schematic representation of the constructs involved in the dual luciferase assay; top: firefly luciferase construct driven by the IL-8 promoter containing AR binding sequence and NF-κB p65 subunit binding sequence (p65BS+ARBS) shown in Extended Data Figure 2a, and bottom: the promoterless renilla luciferase construct. e, Fold change in IL-8 promoter activity in co-transfected Myc-CaP cells cultured in the presence of DHT (10nM) for 8hrs and TNFα (50Units/ml) for 6hrs (p=0.0132 Scr vs. KD and p=0.0313 Scr vs. Enza; n=3 independently transfected replicates per condition, repeated x 2). f, ChIP-Seq enrichment of AR at the IL-8 (CXCL8) promoter in primary human prostate cancers (n=11 patients; GSE56288). Bar plots represent means with SEM. Unpaired two-tailed t-tests were performed, p-values ≥ 0.05 (ns).
To further explore a promoter dependent mechanism though which AR signaling could mediate IL-8 repression, we generated a luciferase reporter construct based on the IL-8 promoter sequence containing the partial AR binding site upstream of IL-8 as well as the NF-κB p65 binding site (Fig. 2d and Extended Data Fig. 2b). Using this construct, we transfected Myc-CaP cells previously transduced with either AR knock-down (KD) or scramble shRNA. IL-8 promoter activity was increased in AR KD cells or in cells treated with enzalutamide, further supporting a promoter-dependent mechanism by which AR signaling down-regulates IL-8 expression (Fig. 2e). These data are consistent with results showing decreased pol II binding at the IL-8 promoter in the presence of DHT in human cell lines (Extended Data Fig. 2c), as well as with data showing consistent AR binding to the IL-8 promoter in primary human PCa samples (Fig. 2f). Of note, no significant AR binding was detected at the promoters of other chemokines with the ability to recruit neutrophils (i.e., CXCL1, CXCL2, CXCL5, and CXCL12; Extended Data Fig. 3). Together, these data support that AR binding to the IL-8 promoter leads to downregulation of IL-8 expression.
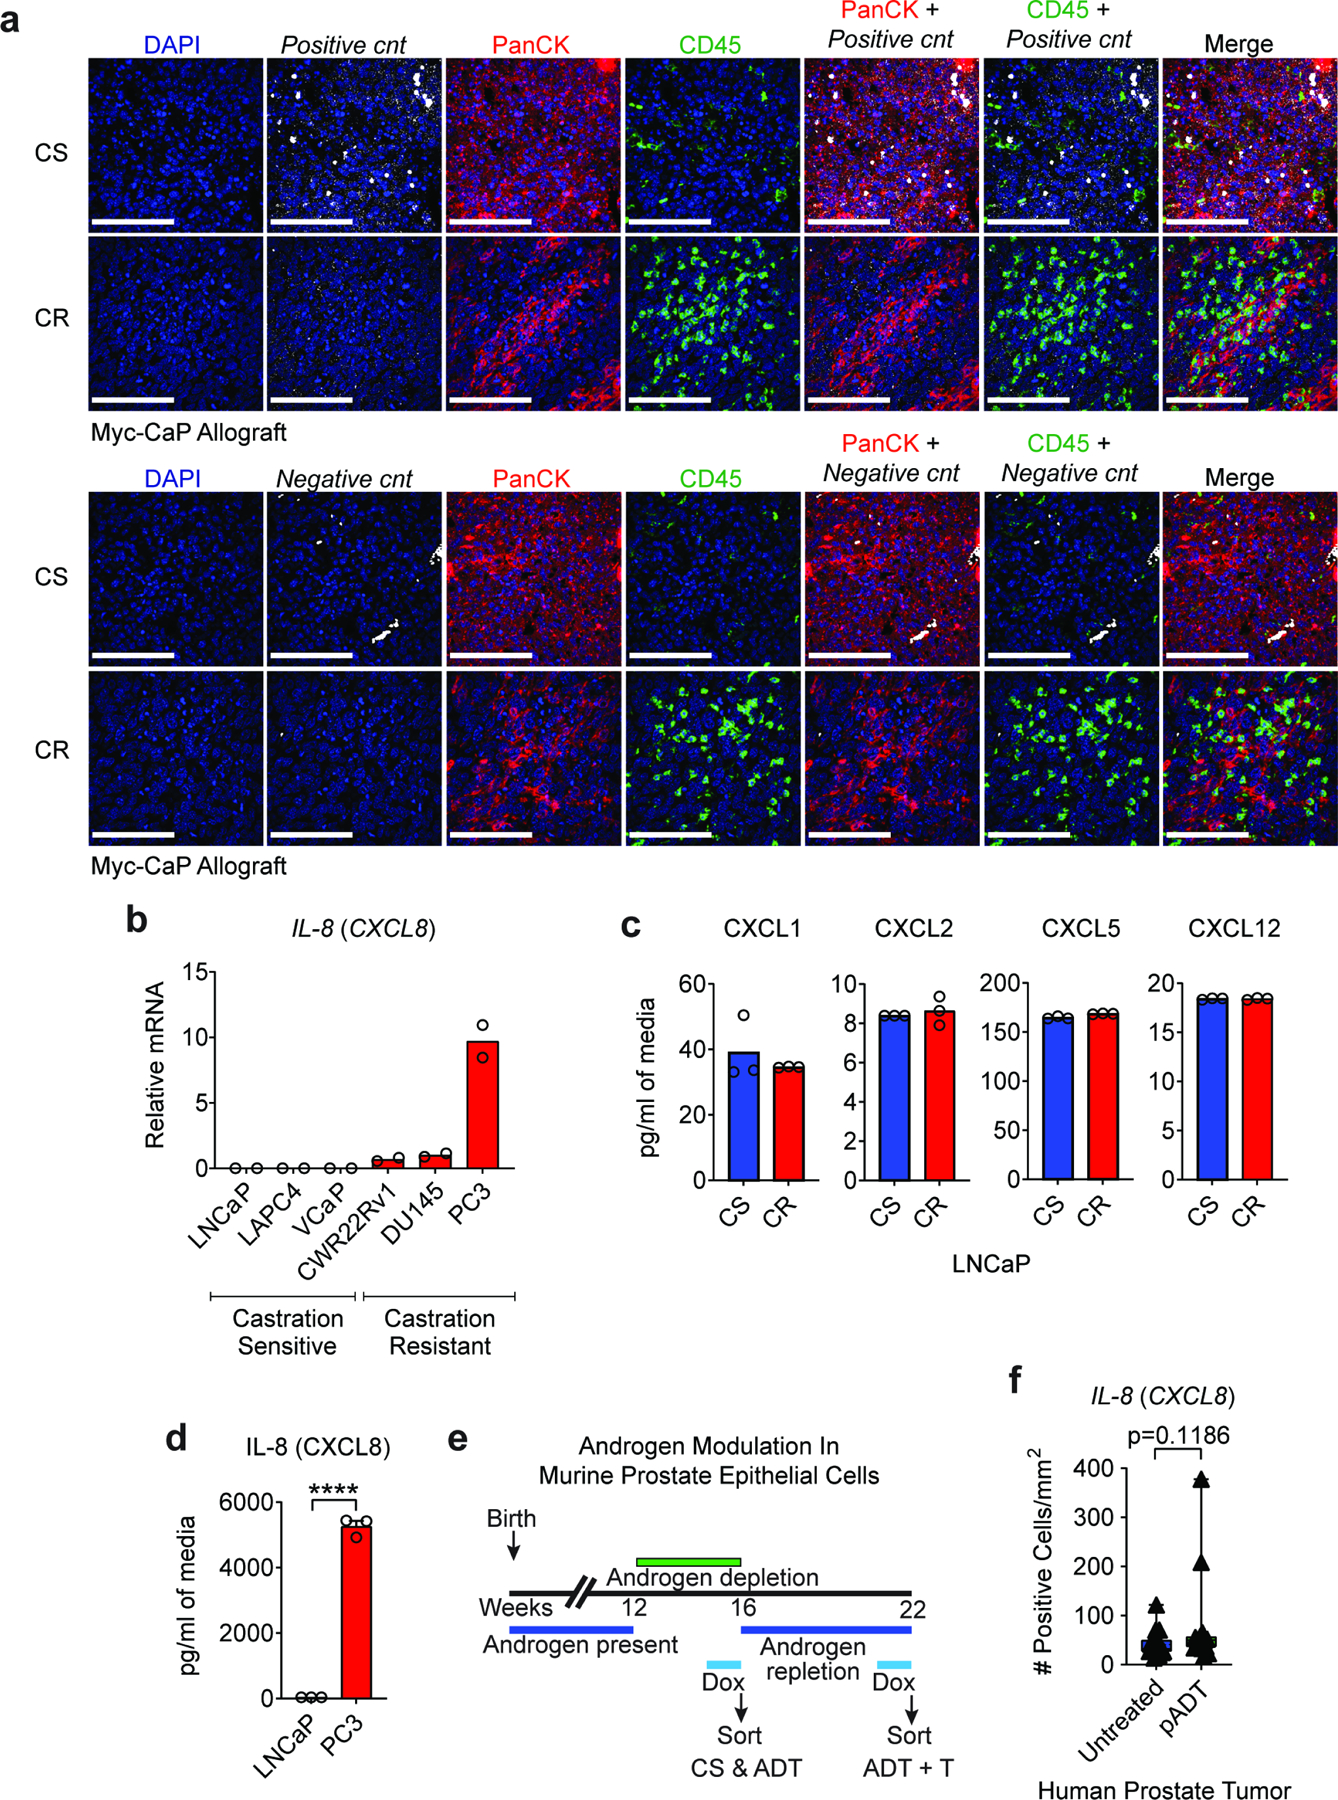
Next, we investigated the effects of ADT on the expression of Cxcl15 in vivo, using RNA in situ hybridization (RISH) to study Myc-CaP tumors implanted in immunocompetent, syngeneic hosts. Along with the expected expression of Cxcl15 in immune cells, we found that Cxcl15 expression was increased in epithelial (PanCK+) tumor cells in CR tumors as compared to CS tumors (Fig. 3a and Extended Data Fig. 4a). These findings were confirmed in vitro and in vivo, both at the mRNA and protein level (Fig. 3b). To investigate these findings in the context of human prostate cancer, we used three paired cell lines in which isogenic CR lines were derived from CS progenitors. For each pair, the CR line expressed significantly increased IL-8 as compared to the CS counterpart, both at the mRNA and protein level (Fig. 3c-d). Supporting specificity, we did not observe differential expression of other chemokines with the ability to recruit neutrophils in CS vs CR cell lines (Extended data Fig. 4c). Increased levels of IL-8 expression in CR disease were further validated across a panel of androgen-independent human PCa cell lines (Extended Data Fig. 4b and 4d).
Figure 3 |. Cxcl15 and IL-8 are Up-Regulated in Post-Castration and Castration-Resistant Prostate Cancer.
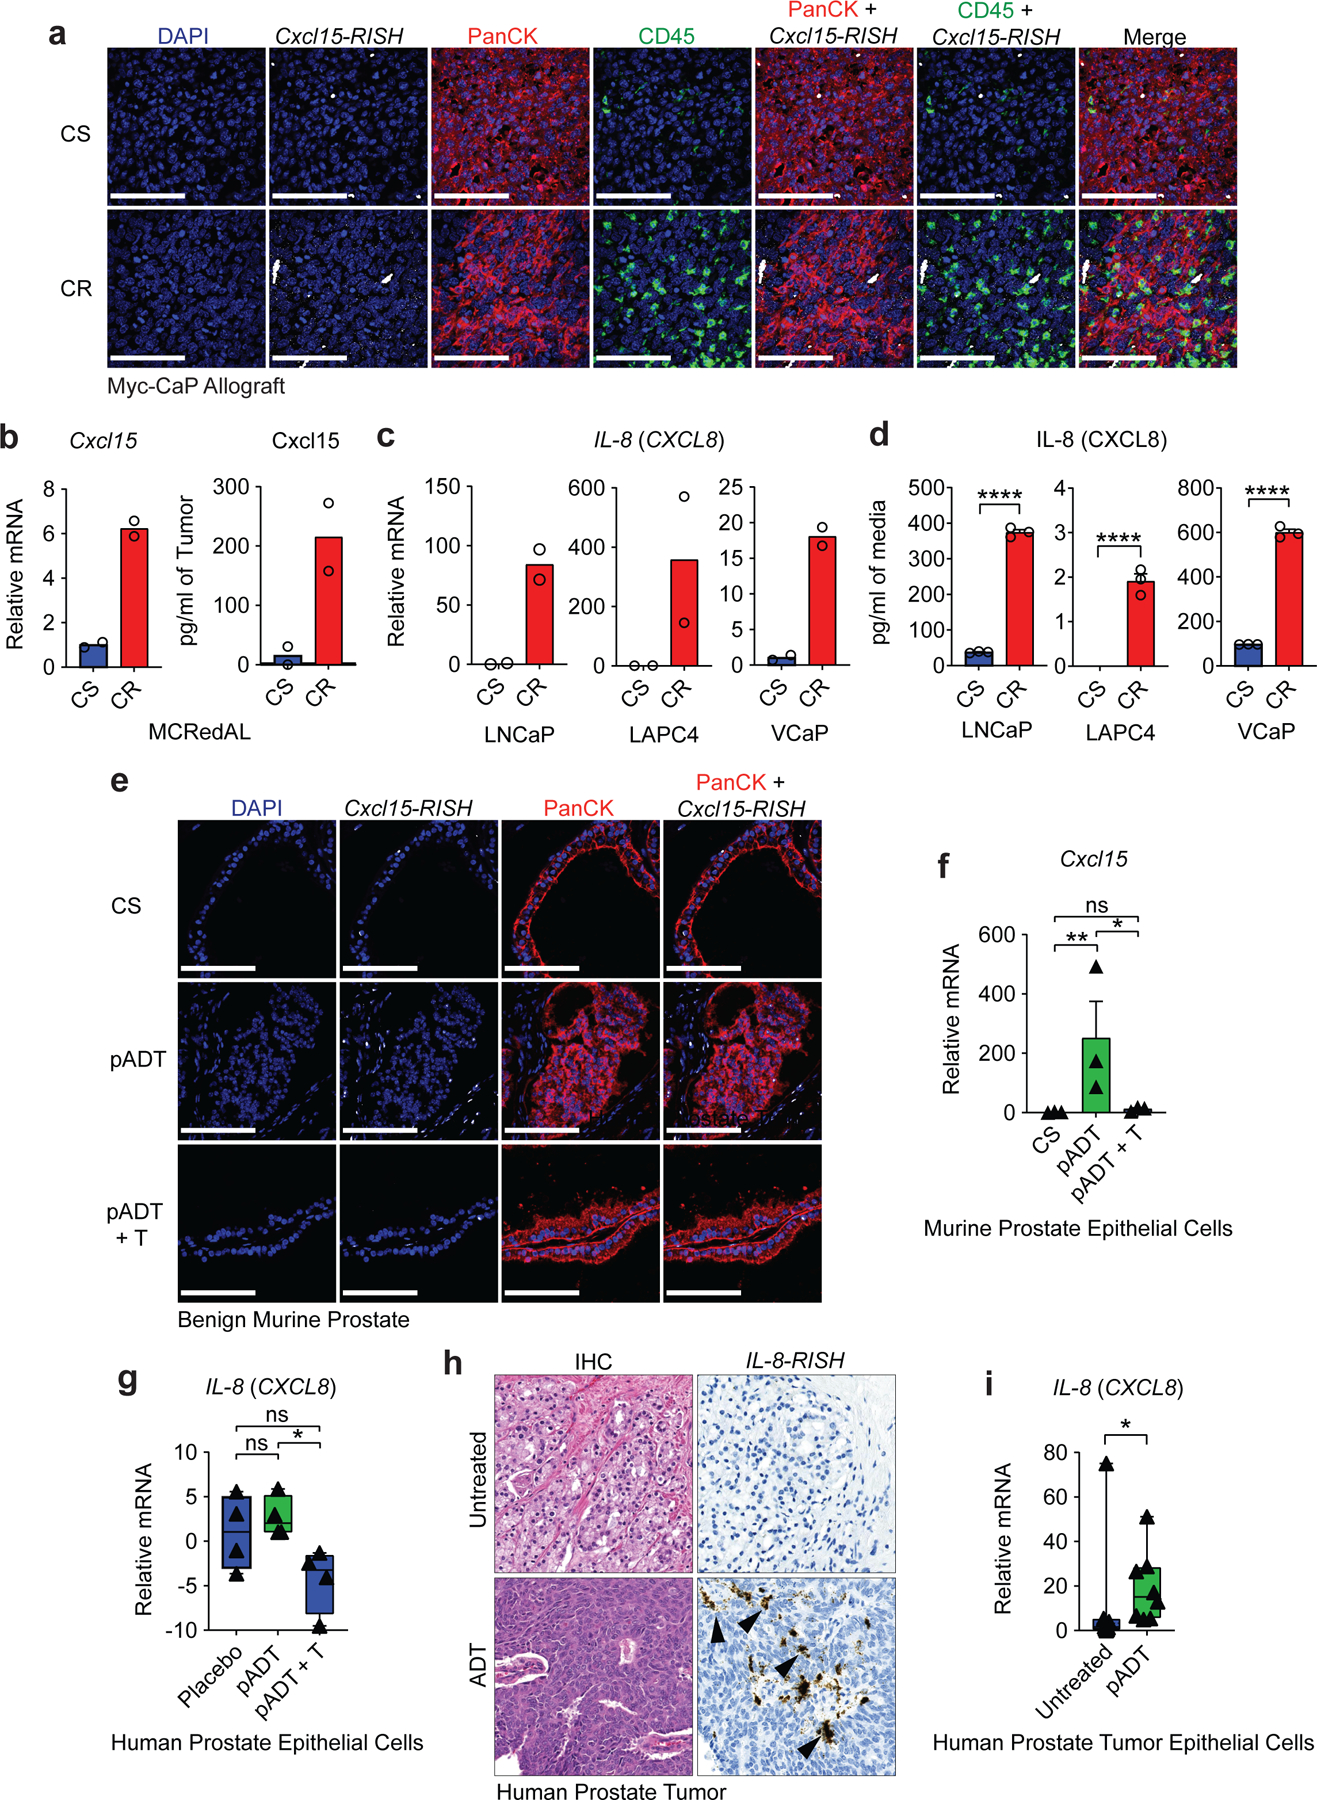
a, Representative images of Cxcl15 in Myc-CaP tumors. Tumors were harvested at ~500mm3 (CS group) or at the time of castration-resistance (CR), and hybridized with probe sets (white) to Cxcl15, anti-PanCK antibody (red), and anti-CD45 antibody (green). Nuclei were counterstained with DAPI (blue). b, Gene expression of Cxcl15 in sorted MCRedAL cells and protein expression in tumor lysates of indicated tumor samples by qRT-PCR (left) and ELISA (right), respectively (n=2 biologically-independent samples per group, repeated x2). c, qRT-PCR quantification of IL-8 in human AR positive castration-sensitive cells (CS: LNCaP, LAPC4, and VCaP) and their castration-resistant counterparts (CR: LNCaP-abl, LAPC4-CR, and VCaP-CR; n=2 technical replicates, repeated x2). d, IL-8 protein expression in isogenic cell pairs from c quantified by MSD (n=3 independently cultured replicates per condition, repeated x2). e, Representative images of Cxcl15 fluorescent detection in benign murine prostate tissue samples from castration-sensitive (CS), androgen-deprivation treated (pADT), and ADT-treated mice that received testosterone repletion (pADT + T). Tissue sections hybridized with probe sets (white) to Cxcl15, and anti-PanCK antibody (red). Nuclei were counterstained with DAPI (blue). f, qRT-PCR analysis of Cxcl15 expression in prostate luminal epithelial cells (PLECs) from indicated treatment groups (p=0.0074 CS vs pADT and p=0.0131 pADT vs pADT+T; n=3 biologically-independent samples per group). PLECs were isolated based on their GFP+CD49fintCD24+CD45−F4/80−CD11b−expression by flow sorting. g, Expression of IL-8 in human prostate epithelial cells micro-dissected from patients (NCT00161486) receiving placebo, androgen-deprivation treatment (pADT), or ADT plus testosterone repletion (pADT + T). Z-score values of microarray transcripts from benign prostate biopsies were normalized to placebo (p=0.0143 pADT vs pADT+T; n=4 biologically-independent samples per group; GSE8466). h, Representative images of IL-8 colorimetric detection in human prostate tumor specimens from untreated or ADT-treated (NCT01696877). i, Expression of IL-8 in human prostate cancer epithelial cells micro-dissected from untreated or ADT-treated (p=0.0148 Untreated vs pADT; n=8 biologically-independent samples per group) patients as determined by qRT-PCR. Images representative of 3 independent experiments. RISH images are at 60X magnification; scale bar=100 μm. Gene expression levels were normalized to CS, untreated or placebo samples. Bar plots represent means with SEM. Unpaired two-tailed (d-f) t-tests were performed, p-values ≤ 0.0001 (****); p-values ≥ 0.05 (ns). For c & f, Log2 transformed values were used. For g & i, a Mann-Whitney U test was used due to the non-normal data distribution observed. The box plot includes 25th to 75th of all IL-8 expression values with horizontal line indicating the median values. The whiskers represent the highest values, including outliers and extremes.
To test whether AR modulates Cxcl15 expression in benign murine prostate epithelium, we used RISH to study mice treated with ADT, either alone or followed by subsequent testosterone (T) repletion as shown in Extended Data Figure 4e. These data (Fig. 3e-f) showed increased epithelial Cxcl15 expression in post-ADT samples, with expression significantly decreased by testosterone repletion (Fig. 3f). This observation was corroborated in human samples using an independent gene expression dataset (GSE8466) in which prostate epithelial cells were isolated using laser-capture microdissection (LCM) from healthy men undergoing ADT and ADT with testosterone supplementation21. Here, testosterone repletion significantly reduced IL-8 mRNA expression (Fig. 3g), supporting the hypothesis that AR signaling down-regulates IL-8 expression. In agreement with our data from benign human prostate epithelial cells, RISH staining of prostate tumor specimens from high-risk PCa patients treated with ADT on a neo-adjuvant trial (NCT01696877)8,22 showed IL-8 expression in post-ADT prostate tumor epithelial cells (Fig. 3h, Extended Data Fig. 4f). Immune cells, but not fibroblasts, also expressed detectable IL-8 in the TME23. LCM-enriched prostate tumor epithelium from these patients also showed significantly increased IL-8 expression as compared to tumors from untreated age and stage-matched controls (Fig. 3i). Taken together, these analyses strongly support the notion that castration increases IL-8 expression in murine and human prostate epithelial cells.
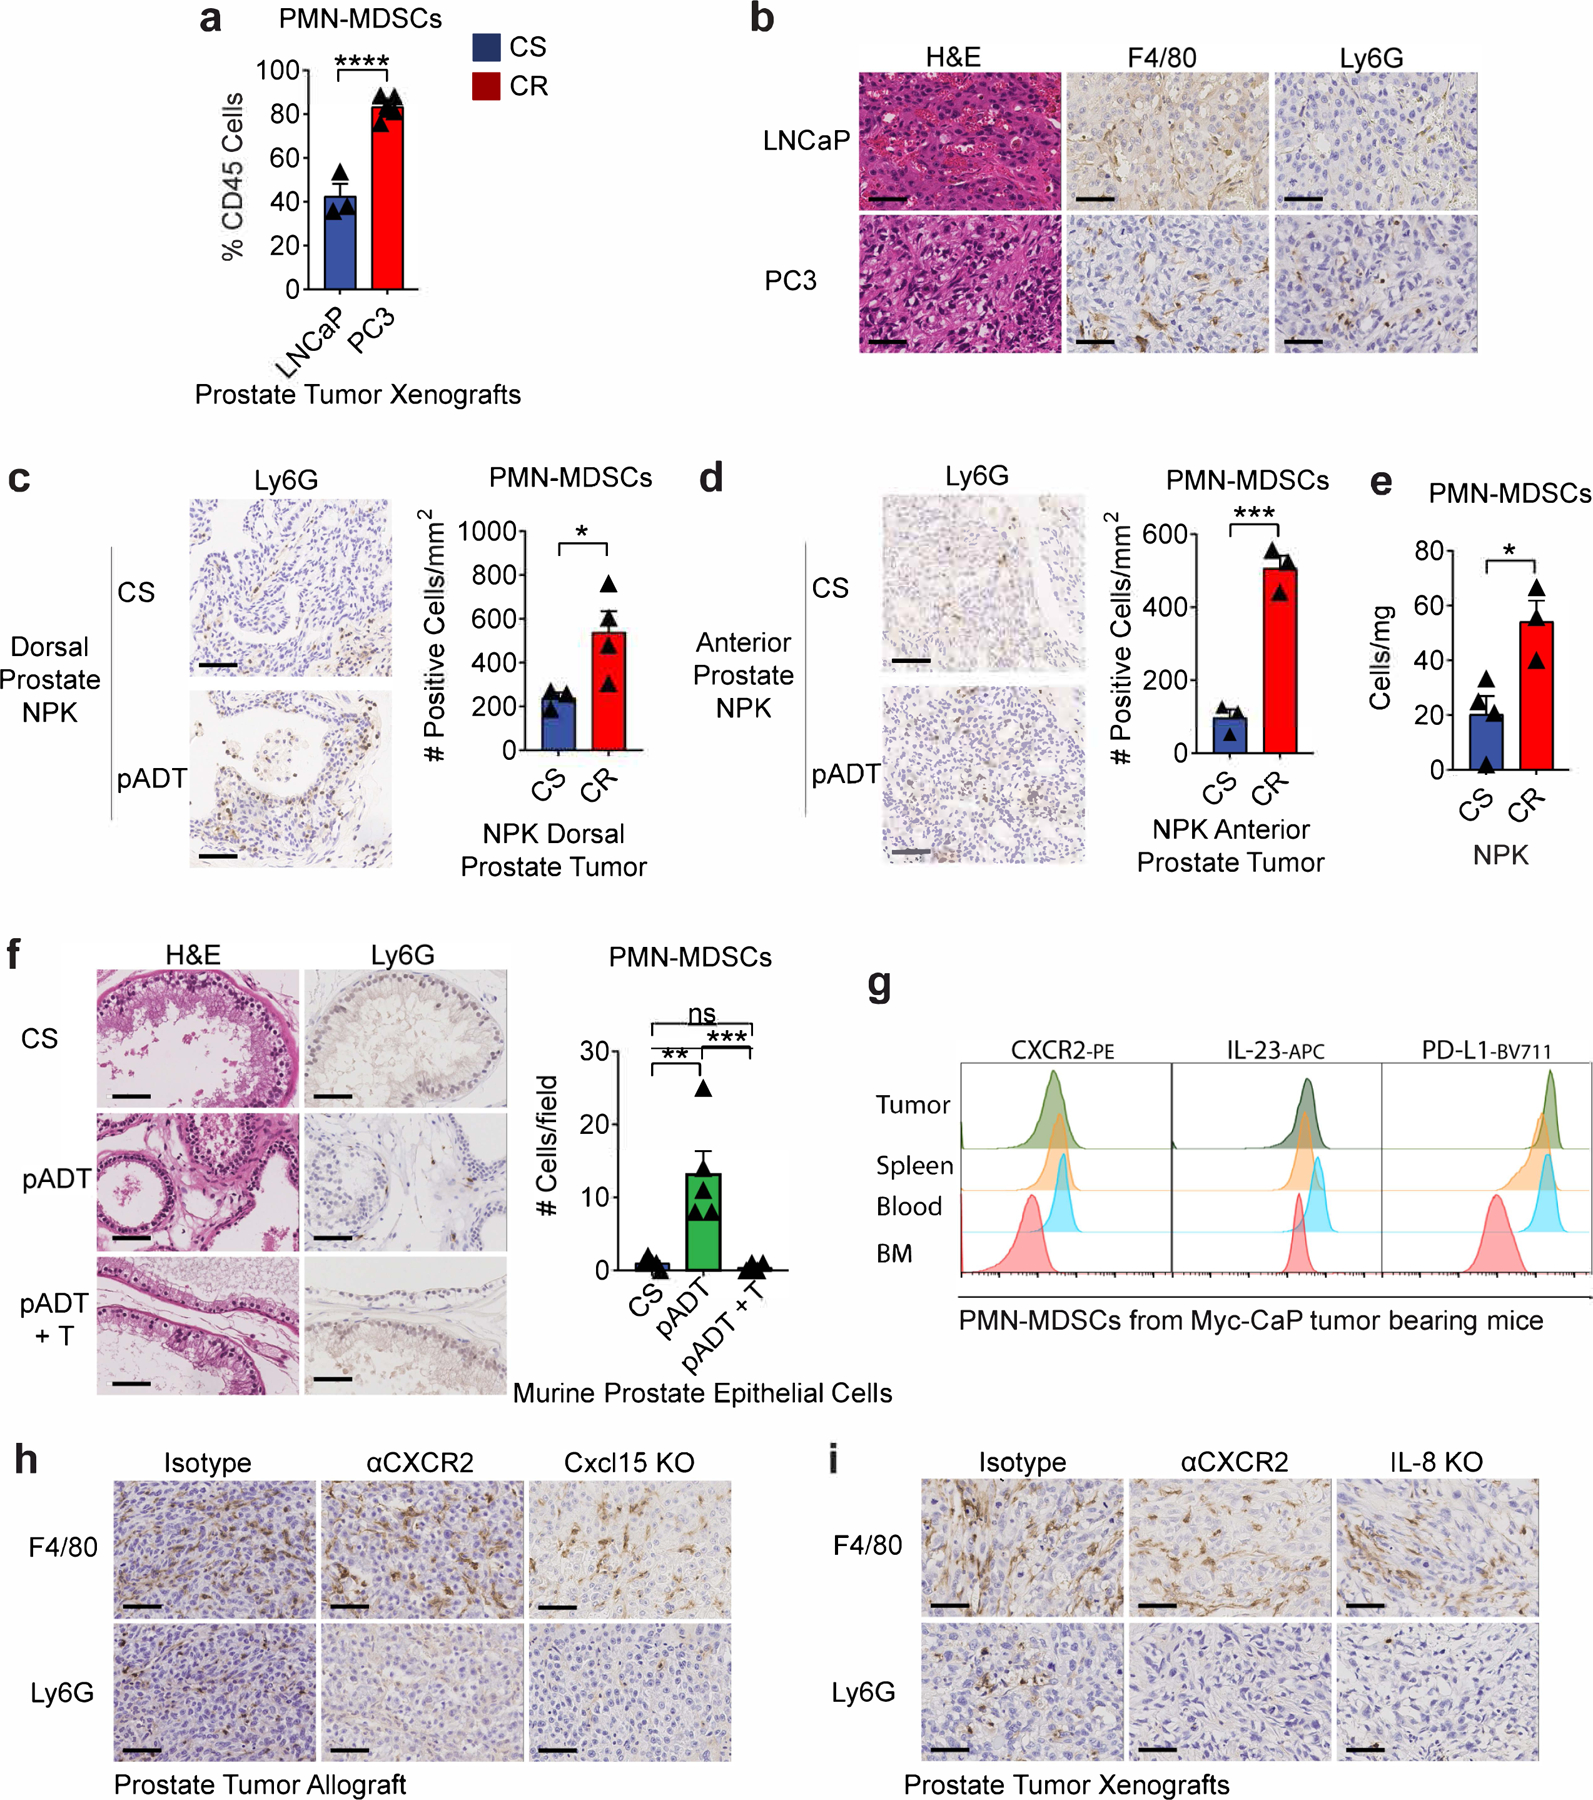
We next quantified castration-mediated immune infiltration in Myc-CaP allografts (Fig. 4a). Consistent with prior data7,11, ADT promoted a transient T cell influx, without significant changes in any tumor associated macrophage (TAM) population (Fig. 4b). By contrast, PMN-MDSC infiltration was significantly increased in CR tumors (Fig. 4b, lower right), as verified by IHC (Fig. 4c). We found similar results in human prostate cancer xenografts (Extended Data Fig. 5a-b), as well as in a relevant transgenic mouse model of PCa driven by mutated Kras and Pten loss24,25 (Extended Data Fig. 5c-e). PMN-MDSC infiltration was also increased in benign prostate from ADT-treated transgenic mice, but not in ADT-treated mice that received testosterone repletion (Extended Data Fig. 5f), supporting a causal relationship between ADT and PMN-MDSC infiltration. Molecular profiling of sorted infiltrating myeloid cells revealed a signature consistent with functional PMN-MDSCs, including up-regulation of IL-23a and IL-1b12,26 (Fig. 4d; Supplementary Table 2). In particular, increased PMN-MDSC expression of Cxcr2 and IL-23a was verified by qRT-PCR (Fig. 4e) and flow cytometry (Extended Data Fig. 5g). To test whether blocking the IL-8 / CXCR2 axis was sufficient to attenuate post-ADT PMN-MDSC infiltration, we treated prostate-tumor bearing mice with anti-CXCR2 and found that blocking CXCR2 nearly completely abrogated tumor infiltration with PMN-MDSCs, in both human (PC3) and mouse (Myc-CaP) models (Fig. 4f and Extended Data Fig. 5h-i). To confirm this observation at a genetic level, we used CRISPR/Cas9 to generate human (PC3) and murine (Myc-CaP) lines that were knocked-out for human IL-8 or the murine IL-8 homolog Cxcl15, respectively. We observed a marked decrease in PMN-MDSC infiltration in both settings (Fig. 4g and Extended Data Fig. 5h-i). Of note, CXCR2 blockade appeared to decrease PMN-MDSCs to a greater extent than genetic ablation of either Cxcl15 or IL-8, suggesting that other CXCR2 ligands may play a role in modulating PMN-MDSC infiltration into the TME of prostate tumors. We further evaluated whether Cxcl15 was sufficient to induce PMN-MDSC migration in vivo by administrating recombinant Cxcl15 into the peritoneal cavity of mice treated with either isotype or anti-CXCR2. Indeed, we found increased migration of PMN-MDSCs only in the isotype control group, but not in mice that received CXCR2 blockade (Fig. 5a-c), suggesting that Cxcl15-mediated PMN-MDSC recruitment requires CXCR2 signaling.
Figure 4 |. Castration-mediated IL-8 Up-Regulation Promotes PMN-MDSC Infiltration.
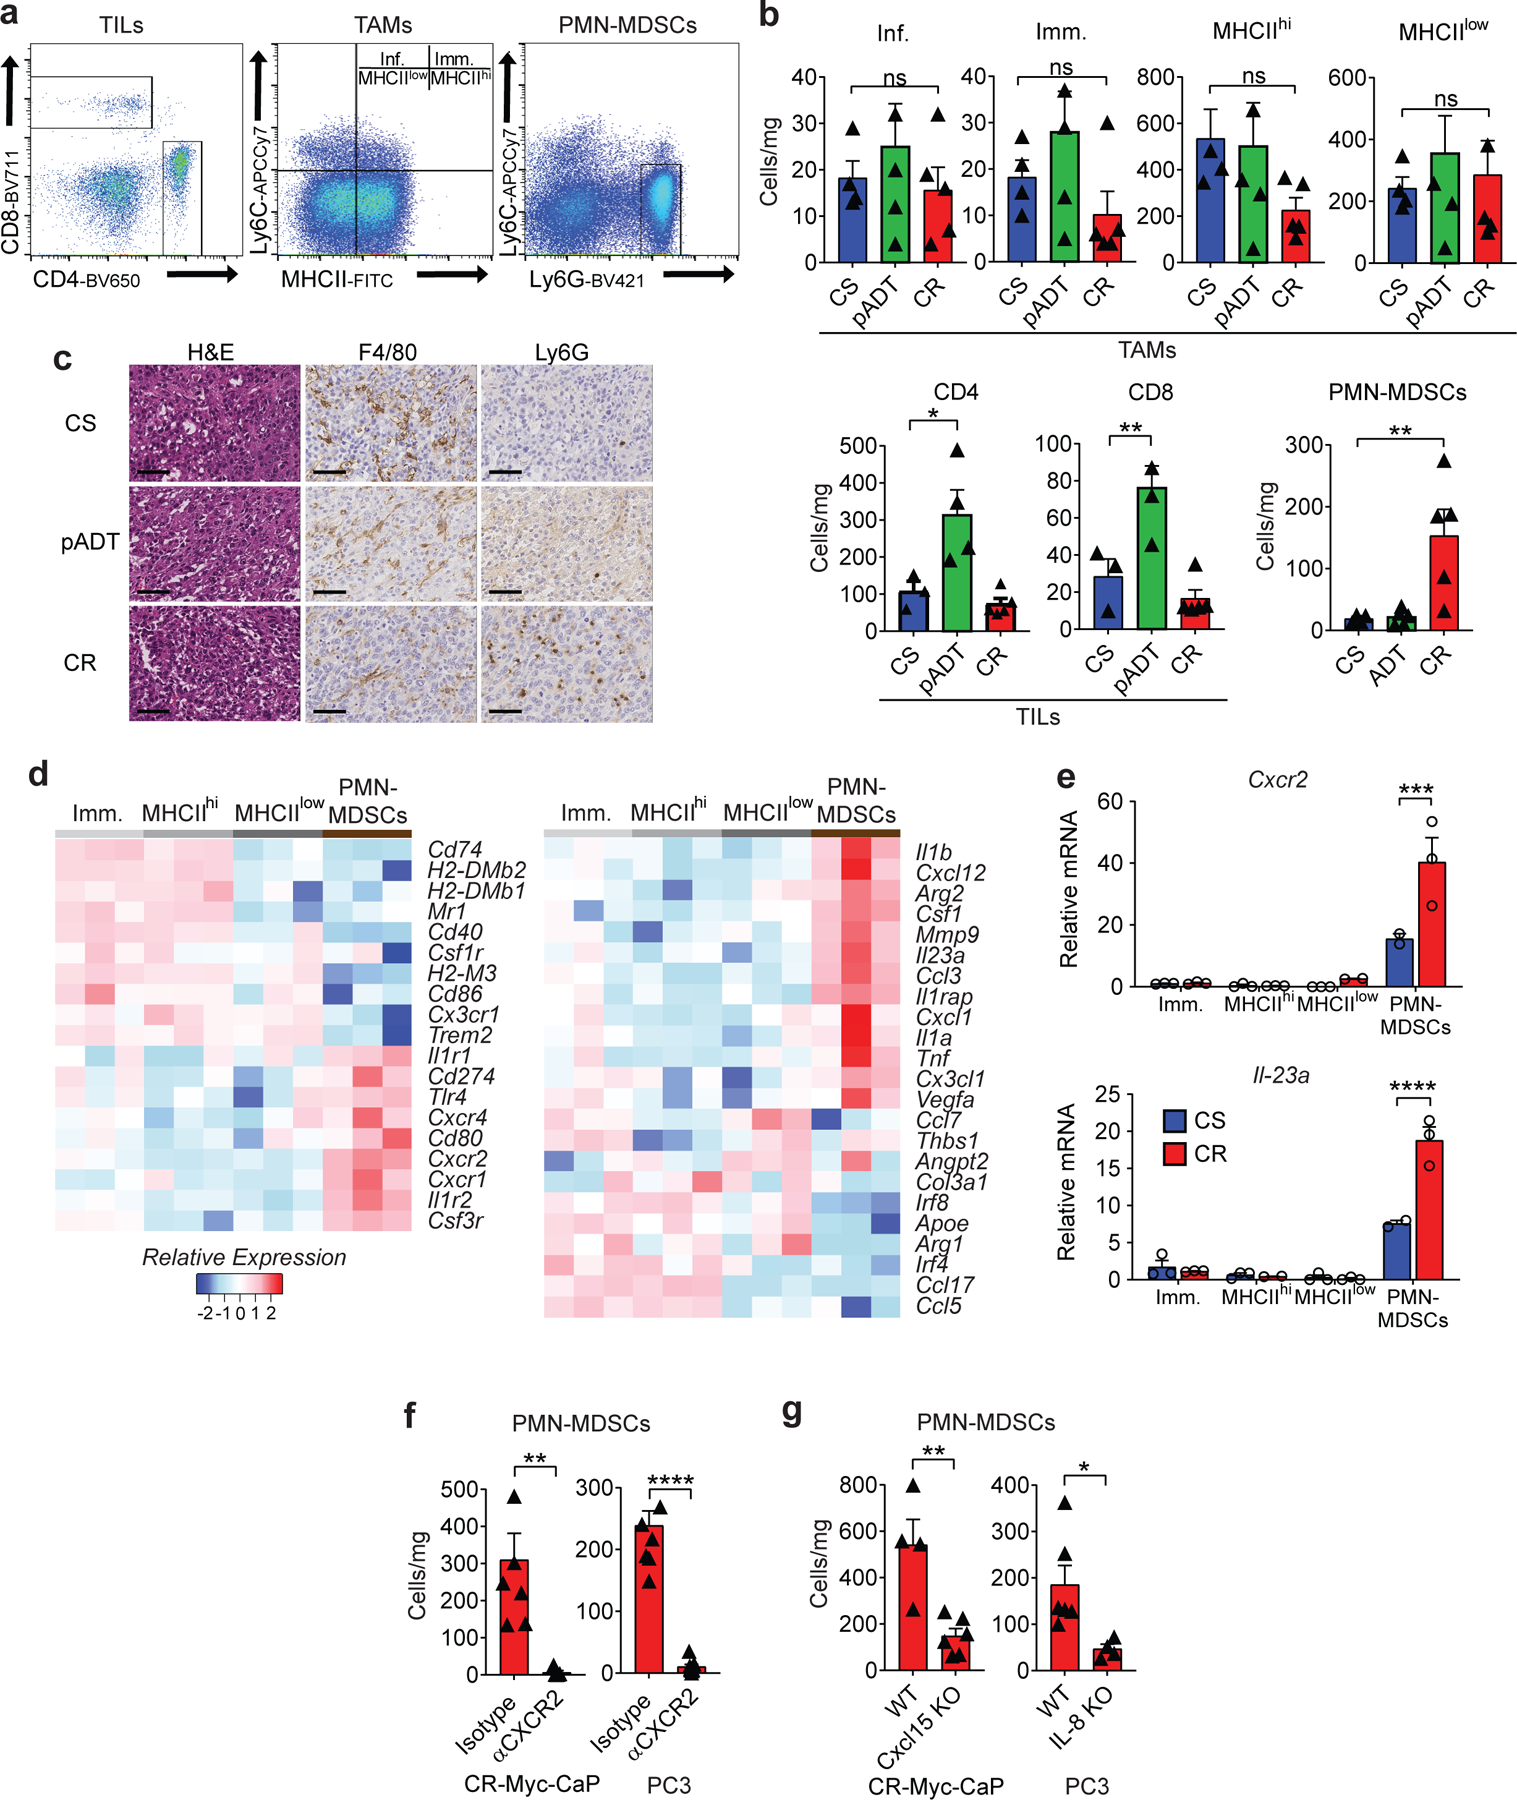
a, Gating strategy used to profile the immune compartment of the TME by flow cytometry. Tumor associated macrophages (TAMs) gated based on CD45+Ly6G−F4/80+CD11b+, Inflammatory (Inf.) TAMs as CD45+CD11b+F4/80+Ly6C+MHCII−, immature (Imm.) TAMs as CD45+CD11b+F4/80+Ly6C+MHCII+, MHCIIhi TAMs as CD45+CD11b+F4/80+Ly6C−MHCII+, MHCIIlow TAMs as CD45+CD11b+F4/80+Ly6C−MHCII−, tumor Infiltrating Lymphocytes (TILs) CD45+CD4+ or CD45+CD8+, tumor infiltrating polymorphonuclear myeloid-derived suppressor cells (PMN-MDSCs) as CD45+CD11b+Ly6C+Ly6G+. b, TAM, TIL, and PMN-MDSC density normalized to mg of tumor weight (cells/mg; p=0.0189 CD4, p=0.0093 CD8, and p=0.0099 PMN-MDSCs; Myeloid cells: n=4 CS, n=5 pADT, n=5 CR and T cells: n=3 CS, n=4 pADT, n=5 CR tumors per group, repeated x2). c, Representative H&E and immunohistochemistry (F4/80 and Ly6G) of indicated murine allografts (repeated x3). d, Normalized expression of selected genes determined by NanoString nCounter gene analysis in sorted myeloid fractions defined as in a (n=3 tumors per group). e, qRT-PCR quantification of Cxcr2 and Il-23 in indicated populations of Myc-CaP tumors (Imm.: n=3 CS & CR, MHCIIhi: n=3 CS & CR, MHCIIlow: n=3 CS & n=2 CR, and PMN-MDSCs: n=2 CS & n=3 CR tumors per group). f and g, Density of PMN-MDSCs normalized to mg of tumor weight (cells/mg) in Myc-CaP (p=0.0054 anti-CXCR2; n=7 isotype and n=5 anti-CXCR2 tumors per group; p=0.0033 Cxcl15 KO; n=4 WT and n=6 Cxcl15 KO tumors per group, repeated x2) and PC3 tumors (p<0.0001 anti-CXCR2; n=8 isotype and n=9 anti-CXCR2 tumors per group; p=0.0303 IL-8 KO; n=6 WT and n=4 IL-8 KO tumors per group, repeated x2). Cells quantified by flow cytometry as in a, tumors implanted and harvested as in materials and methods. H&E and IHC images at 40X magnification; scale bar=50 μm. Gene expression levels normalized to the mean ∆CT level in samples from the Immature TAMs (Imm.) group. Bar plots represent means with SEM. Unpaired two-tailed (f-g) t-tests were performed, p-values ≤ 0.0001 (****); p-values ≥ 0.05 (ns). Tukey’s (b) multiple comparisons test were performed for one-way and two-way ANOVAs respectively.
Figure 5 |. The Cxcl15/CXCR2 (IL-8/CXCR2) Axis Regulates PMN-MDSCs Migration, but Not Their Ability to Suppress T Cell Function.
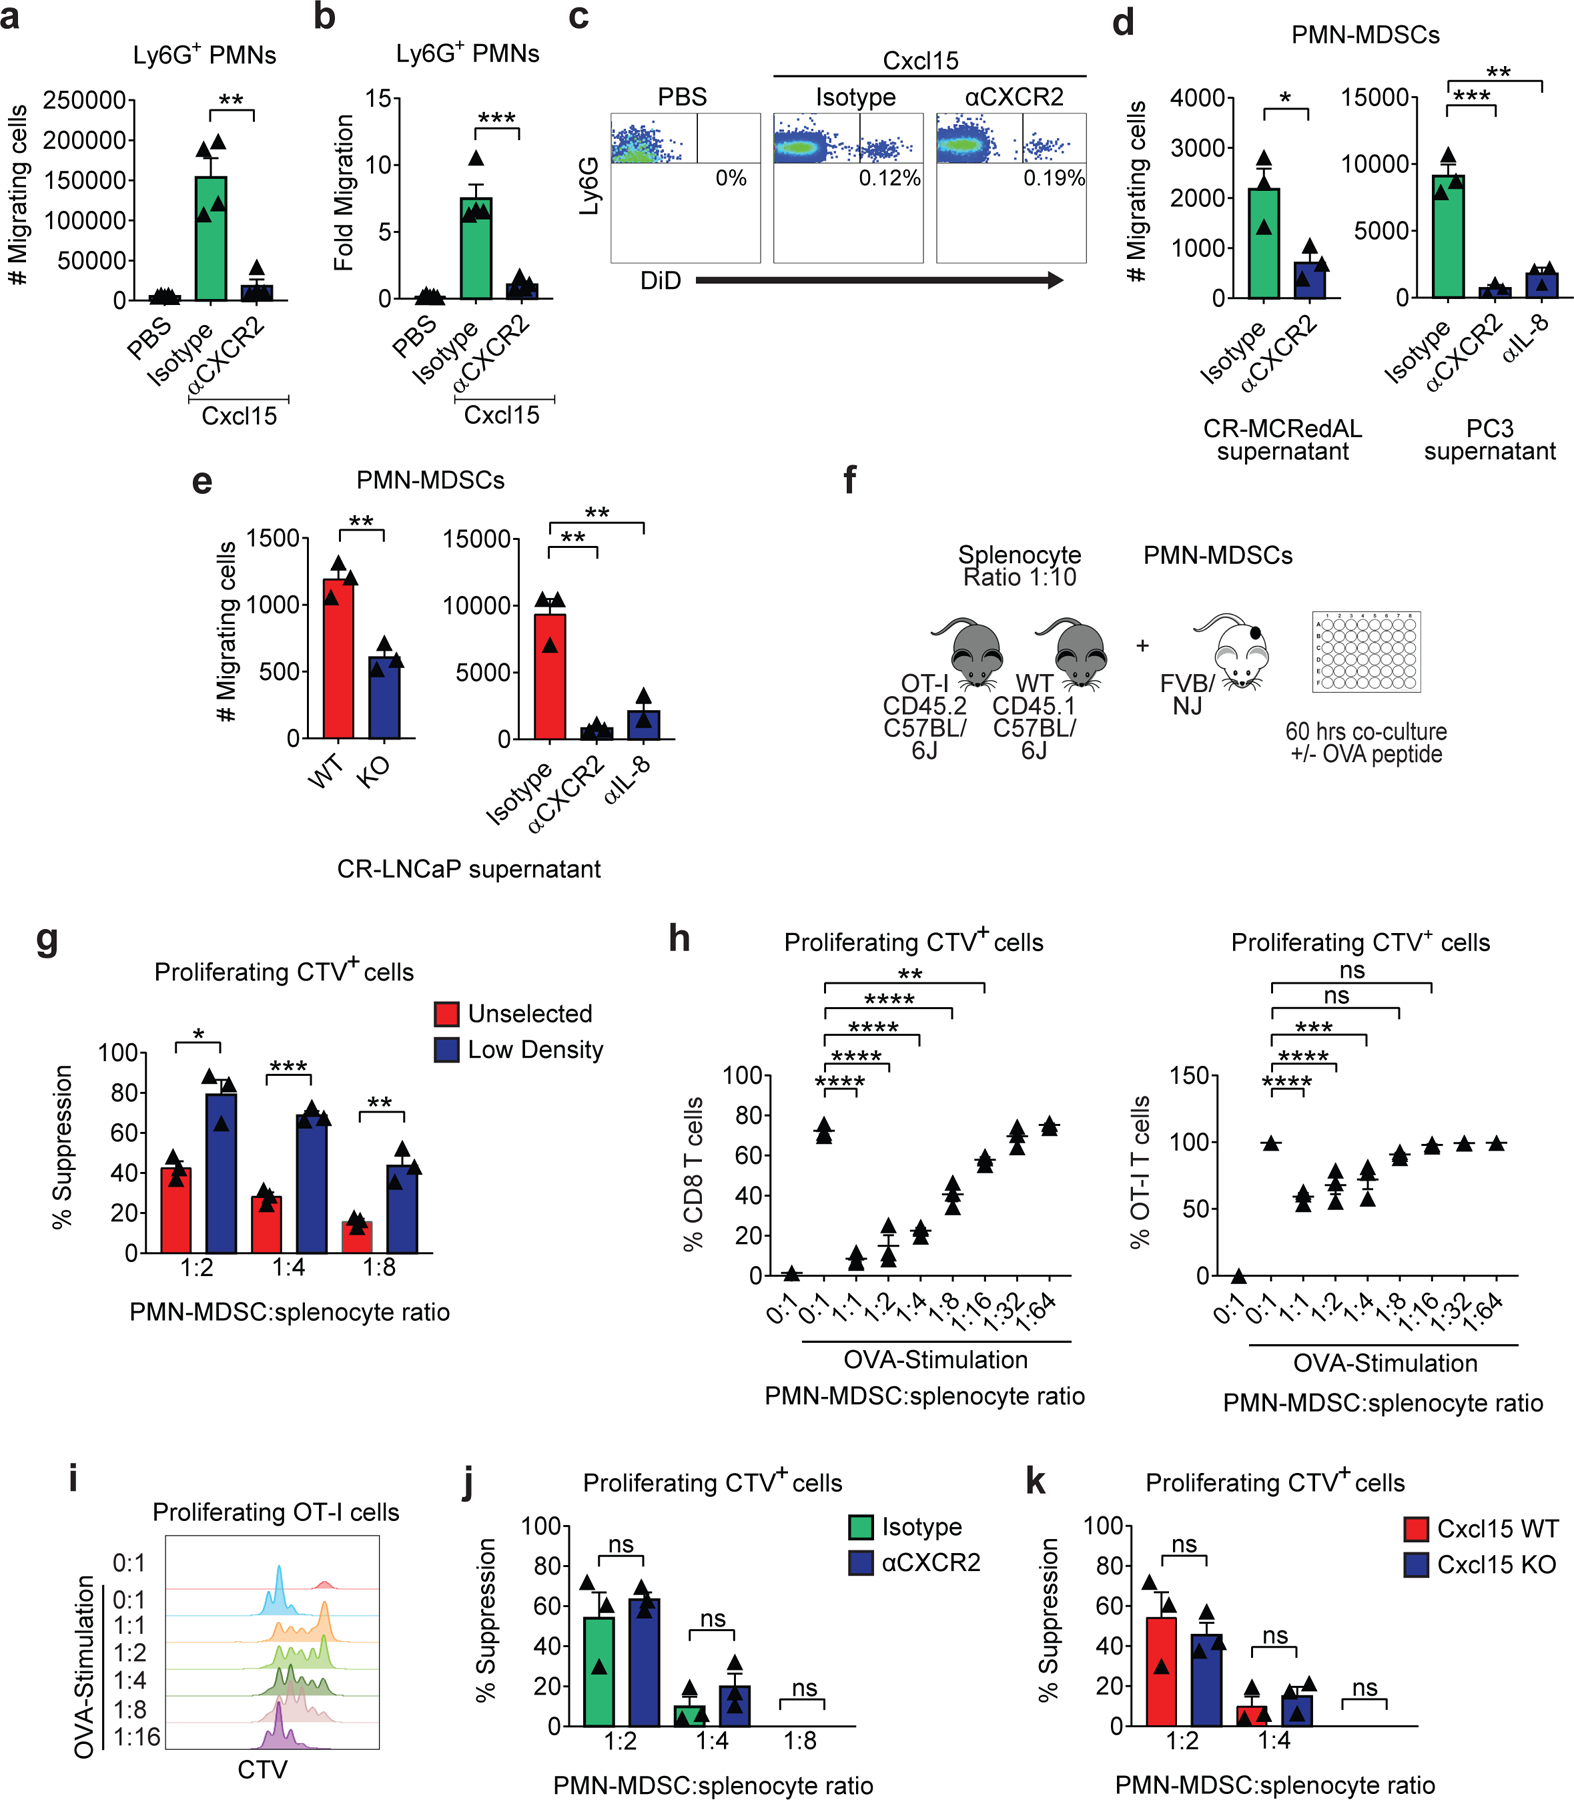
a-c, Analyses of Cxcl15 driven Ly6G+ PMNs migration to the peritoneum in animals pretreated with either isotype or anti-CXCR2 (n=5 PBS, n=4 isotype, and n=4 anti-CXCR2 mice per group, repeated x2). a, Cell numbers (p=0.0015). b, Fold change calculated as the number of Ly6G+ PMNs in peritoneal washings divided by PMN numbers in peripheral blood (p=0.0008). c, Representative flow plots of Ly6G+ PMNs in peritoneal washings d, PMN-MDSC in vitro migration towards tumor supernatants in the presence of either isotype, anti-CXCR2, or anti-IL-8 (200µg/ml). Antibodies were added at the beginning of the experiment (p=0.0304 CR-MCRedAL, p=0.0015 anti-CXCR2 and p=0.0006 anti-IL-8 for PC3 supernatant; n=3 independent assays per group, repeated x2). e, PMN-MDSC in vitro migration towards CR-LNCaP (also known as LNCaP-abl) WT or IL-8 KO tumor supernatants (left; p=0.0034) and towards WT supernatants in the presence of either isotype, anti-CXCR2, or anti-IL-8 (200µg/ml; right; p=0.0018 anti-CXCR2 and p=0.005 anti-IL-8) (n=3 independent assays per group, repeated x2). f, Schematic representation of PMN-MDSC suppression assay. OT-I splenocytes (CD45.2) were mixed with naïve splenocytes (CD45.1) in a 1:10 ratio, labeled with CTV, and co-cultured with PMN-MDSCs at the indicated ratios. Antigen-specific T cell proliferation stimulated (Stim) by OVA peptide (5pM) for 60hrs. g, Percent suppression with either unselected or low-density PMN-MDSCs (p=0.0101 1:2, 0.0002 1:4, and p=0.0051 1:8; n=3 independent assays per group, repeated x3). h, Percentage of CD8 T cells (left; p<0.0001 1:1–1:8 and p=0.0055 1:16) and antigen specific OT-I cells (CD45.2; right; p<0.0001 1:1–1:2 and p=0.0002 1:4) proliferating at different proportions of PMN-MDSCs when stimulated with or without 5pM of OVA, replicate numbers as in g. i, Representative histograms of antigen specific OT-I cell proliferation based on the dilution of CTV dye when stimulated as in h (repeated x2). j, Percent suppression in the presence of either isotype or anti-CXCR2 (200µg/ml). Antibodies were added at the beginning of the experiment (n=3 independent assays per group, repeated x2). k, Percent suppression of PMN-MDSCs derived from spleens of WT or Cxcl15 KO Myc-CaP tumor bearing mice (n=3 independent assays per group, repeated x2). Bar plots represent means with SEM. Unpaired two-tailed (a-g, j-k) t-tests were performed, p-values ≤ 0.0001 (****); p-values ≥ 0.05 (ns). For h, Tukey’s multiple comparisons test with a single pooled variance was performed.
We next tested whether supernatants from CR prostate cancer cells were sufficient to drive PMN-MDSC migration in vitro. In line with our in vivo results, the levels of Cxcl15 and IL-8 secreted by CR murine and human PCa cell lines, respectively, were sufficient to induce recruitment of PMN-MDSCs through trans-well chambers, and in each case, migration could be substantially blocked with anti-CXCR2 treatment (Fig. 5d). Either genetic or pharmacologic inhibition of IL-8 signaling in human CR prostate cancer cells significantly decreased PMN-MDSC migration, although not to the same extent achieved with anti-CXCR2 treatment, again suggesting that other cytokines that interact with CXCR2 might play a role in recruiting PMN-MDSCs (Fig. 5e). Next we sought to determine whether PMN-MDSCs could down-regulate T cell function as read out by their proliferative capacity (Fig. 5f). For this, we first enriched for PMN-MDSCs by performing a density separation on splenocytes from tumor-bearing mice and compared the suppressive capabilities of low density PMN-MDSCs to those of unselected PMN-MDSCs. Indeed, low-density PMN-MDSCs were found to suppress T cell proliferation to a greater extent than unselected PMN-MDSCs (Fig 5g). Furthermore, T cell suppression was dose dependent, and was observed in both antigen-specific (Fig. 5h, right, and Fig. 5i) and bulk T cell populations (Fig. 5h, left). Finally, we tested whether CXCR2 blockade might affect the suppressive capacity of PMN-MDSC; for these studies, we performed additional suppression analyses in either the presence of anti-CXCR2, or with PMN-MDSC isolated from mice bearing tumors in which Cxcl15 was genetically knocked out. As shown in Figs. 5j and 5k, neither anti-CXCR2 nor Cxcl15 loss decreased the suppressive capacity of PMN-MDSCs, suggesting that the Cxcl15 / CXCR2 axis modulates PMN-MDSC migration, but not function.
Finally, we investigated the pre-clinical activity of blocking the IL-8 / CXCR2 axis at the time of androgen-deprivation in the Myc-CaP model in combination with ICB (Fig. 6a). We focused our studies on CTLA-4 blockade, rather than PD-1 blockade, since anti-CTLA-4 was previously shown to mediate anti-tumor immunity in this model7, and is likely more clinically active than anti-PD-1 in PCa patients3,27. In the absence of immunotherapy, we found that the combination of ADT and CXCR2 blockade was ineffective (Fig. 7a). However, the combination of CXCR2 blockade with ICB (anti-CTLA-4) resulted in significantly increased survival over ICB alone (Fig. 6b). Unexpectedly, the triple combination therapy (ADT + anti-CXCR2 + anti-CTLA-4) was effective even when tumors were relatively advanced (400 mm3) at the time of treatment (Fig. 7b and 7d). Macrophage depletion with anti-CSF1R was not effective in this setting (Fig. 7c and 7e). Mechanistically, the increased anti-tumor efficacy mediated by the addition of anti-CXCR2 to ADT + anti-CTLA-4 was not associated with significantly increased T cell infiltration (Fig. 6c and Fig. 7f-h), or decreased Treg infiltration (Fig. 6d). Instead, enhanced anti-tumor activity correlated with an increase in polyfunctional effector CD8 T cells in tumor-draining lymph nodes (TDLN) (Fig. 6e and 6f).
Figure 6 |. CXCR2 Blockade Improves Response to Immune Checkpoint Blockade Following Androgen-Deprivation Therapy.
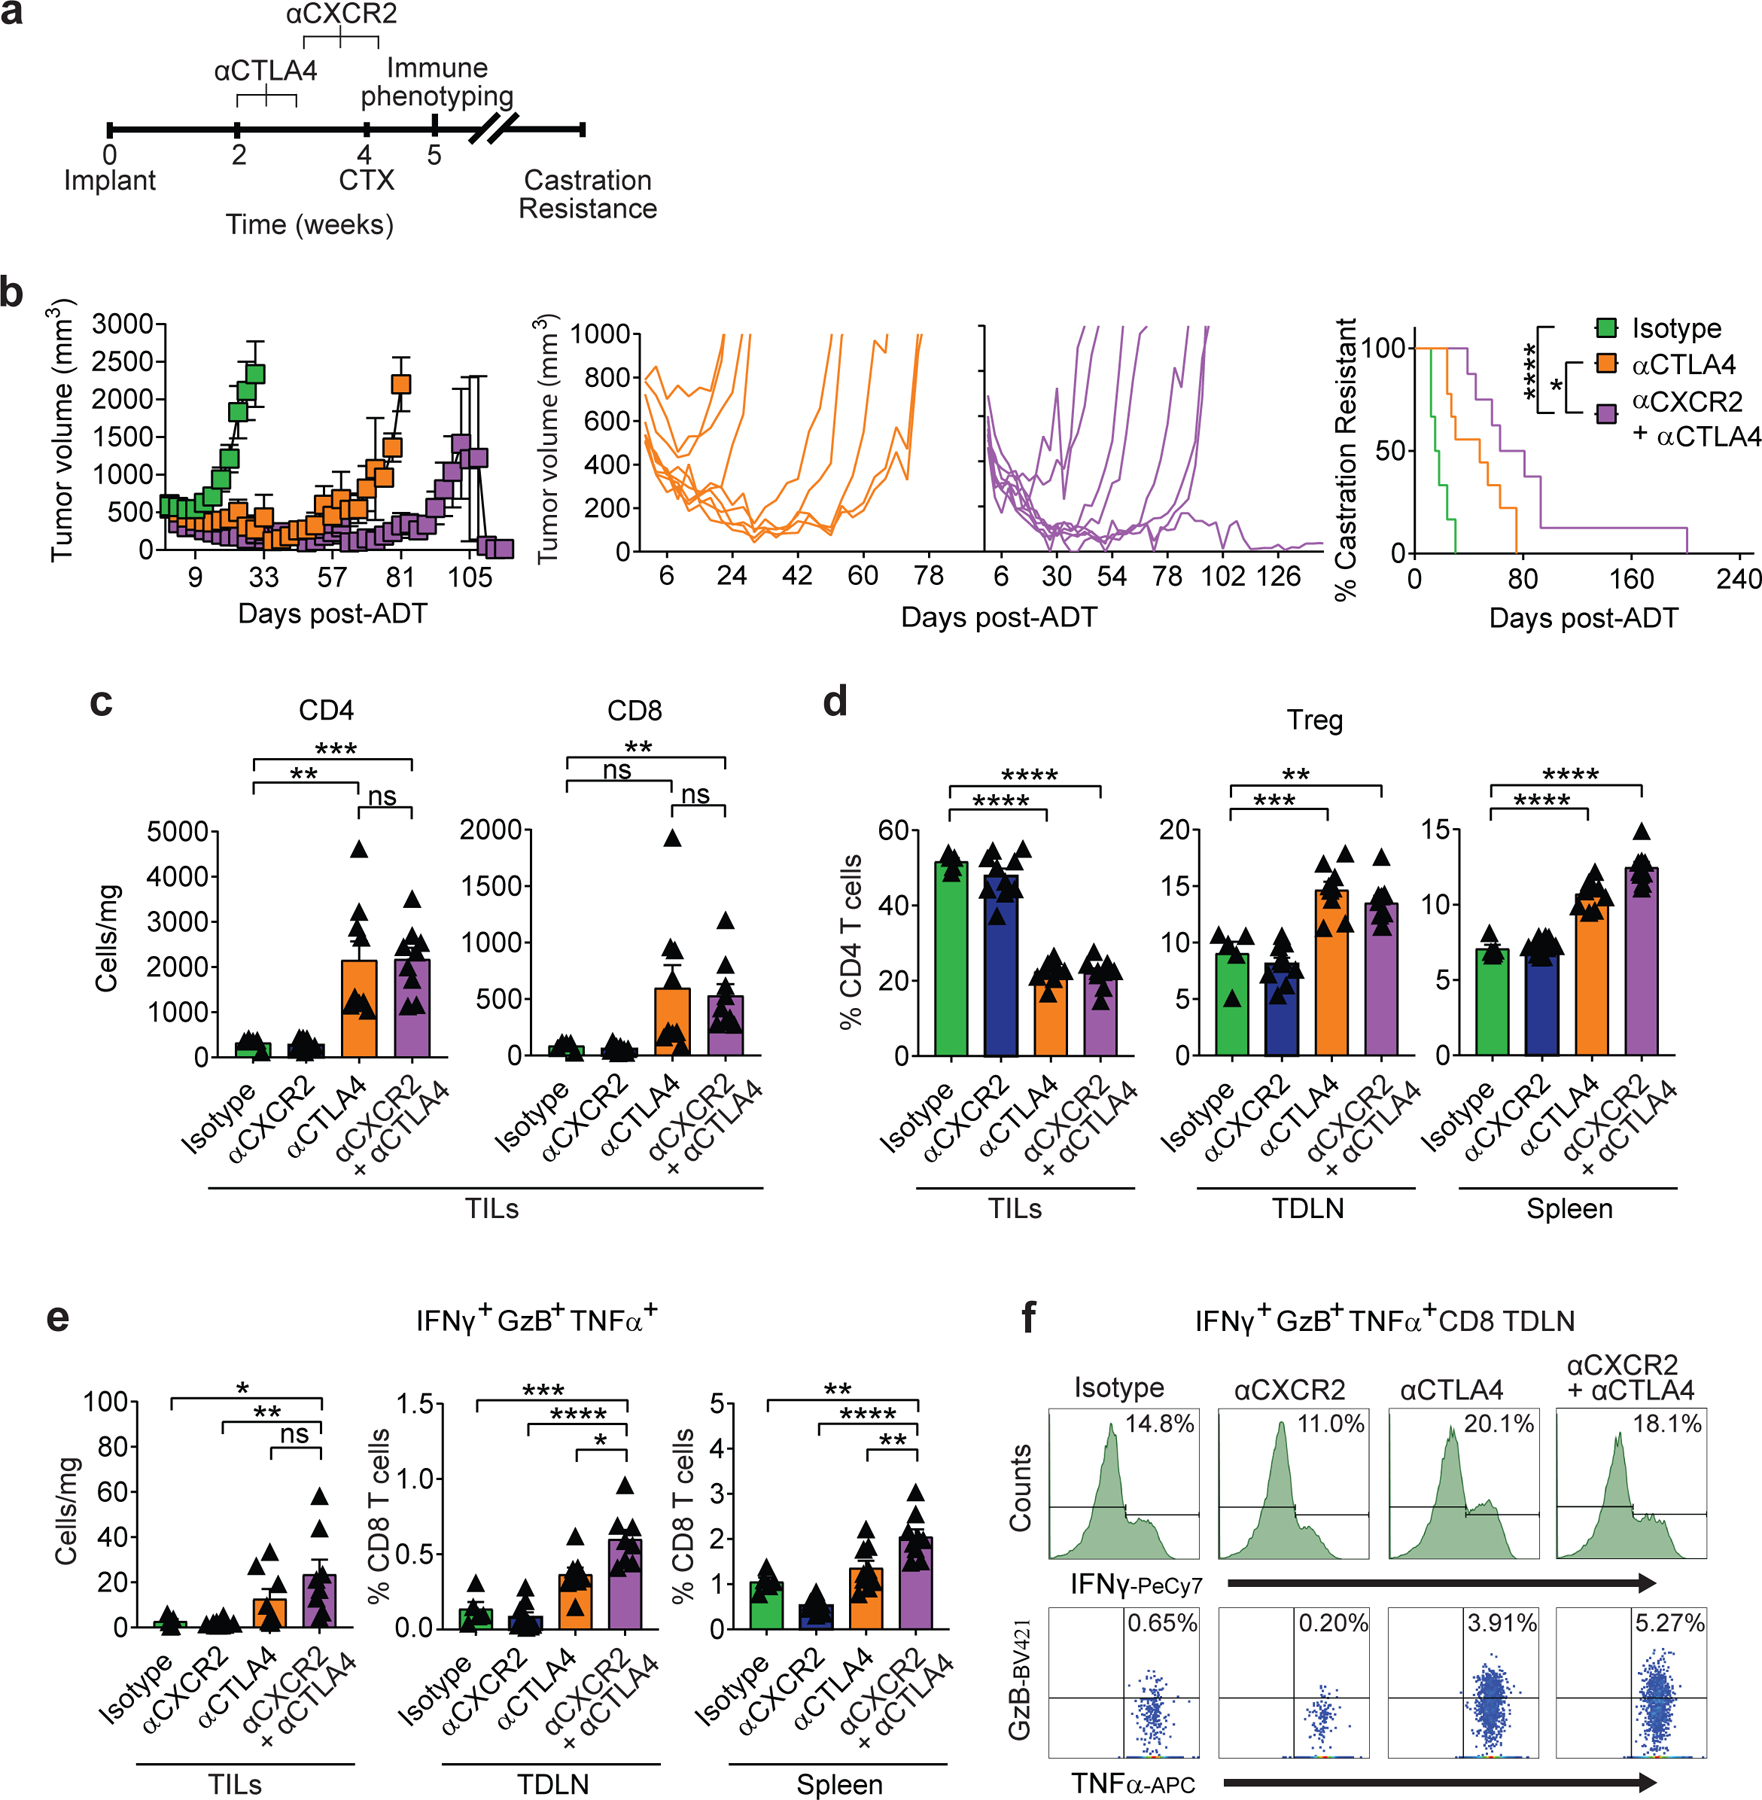
a, Treatment scheme, scale=weeks. Animals sacrificed for immune phenotyping 1 week after castration (CTX). b, Tumor growth and survival curves of mice from isotype (n=6) vs. anti-CTLA-4 (n=9) vs. anti-CXCR2 + anti-CTLA-4 (n=8) groups treated as described in a (black line vs. orange line vs. purple line, respectively; p<0.0001 for anti-CXCR2 + anti-CTLA4 and p=0.0328 for anti-CTLA4 survival analysis; 2 independent experiments). c, Tumor infiltrating lymphocyte (TILs) density in indicated treatment groups (p=0.008 anti-CTLA4 and p=0.0002 anti-CXCR2 + anti-CTLA4 for CD4, and p=0.0088 anti-CXCR2 + anti-CTLA4 for CD8; n=5 isotype, n=10 anti-CXCR2, n=9 anti-CTLA4, and n=9 anti-CXCR2 + anti-CTLA4 mice per group, 2 independent experiments). d, Treg percentages (as fraction of CD4) in indicated tissues (replicates as in c; p=0.0007 anti-CTLA4 and p=0.0021 anti-CXCR2 + anti-CTLA4 in TDLN). e, Polyfunctional CD8 T cells, left panel=density (p=0.0331 isotype and p=0.0021 anti-CXCR2 vs. anti-CXCR2 + anti-CTLA4), center/right panels = percentage of total CD8, animal numbers as in d (center: p=0.0003 for isotype and p=0.0102 for anti-CTLA4 vs. anti-CXCR2 + anti-CTLA4; right: p=0.0012 isotype and p=0.0084 anti-CTLA4 vs. anti-CXCR2 + anti-CTLA4). f, Representative histograms and dot plots of polyfunctional CD8+ IFNγ+GzB+TNFα+ from tumor draining lymph nodes (TDLN). Repeated x 2. For a-f, treatment was initiated when tumor volumes reached 200mm3. Average tumor volume (with SEM) for each experimental group. Log-rank (Mantel-Cox) test used for survival analysis. Flow cytometry as in materials and methods. Bar plots represent means with SEM. Unpaired two-tailed (c-e) t-tests were performed, p-values ≤ 0.0001 (****); p-values ≥ 0.05 (ns).
Figure 7 |. The Therapeutic Effect of the Triple Combination is Associated with PMN-MDSC Reduction.
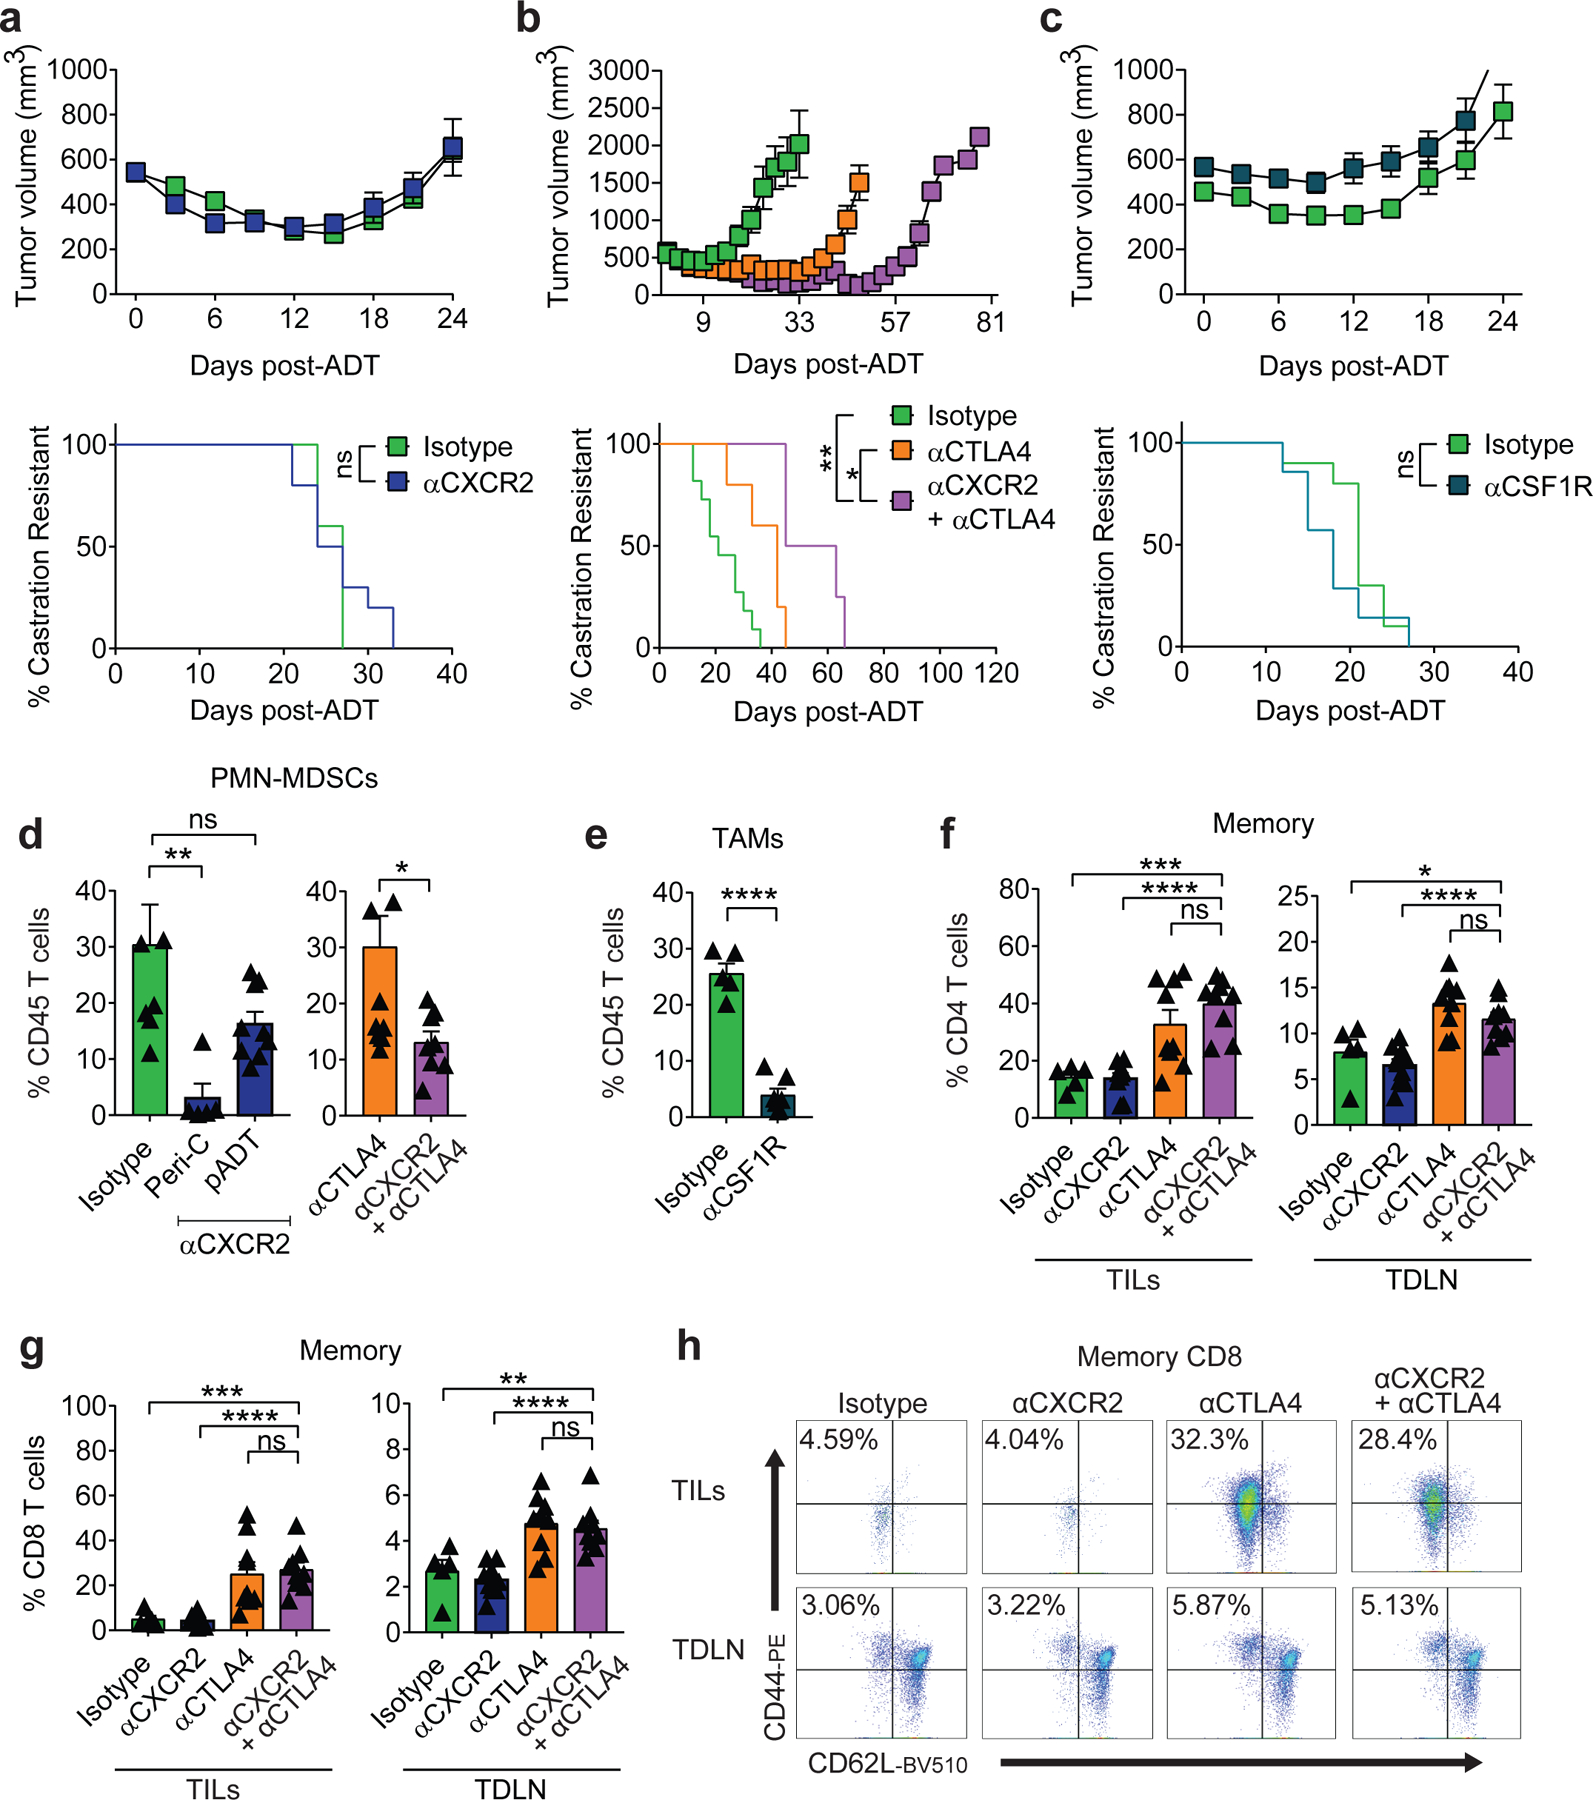
a, Tumor growth and survival curves of mice from isotype vs. anti-CXCR2 treatment groups (green vs. blue, respectively; n=10 biologically-independent animals per group, 2 independent experiments). b, Tumor growth and survival curves of mice from isotype (n=11) and anti-CTLA4 (n=5) vs. anti-CXCR2 + anti-CTLA4 (n=4) treatment groups (green p=0.0201 and orange p=0.0014 vs. purple, respectively; 2 independent experiments). c, Tumor growth and survival curves of mice from isotype (n=6) vs. αCSF1R (n=7) treatment groups (green vs. purple, respectively; 2 independent experiments). d, PMN-MDSCs as a percentage of CD45+ cells in the TME of: left, mice treated with either isotype (n=8) vs. αCXCR2 peri-castration (n=5; Peri-C p=0.0034) or 7 days after castration (n=9; pADT p=0.0725), and right, mice treated with either αCTLA-4 (n=11) vs. αCTLA-4 + αCXCR2 (n=8; p=0.0221). e, TAMs as a percentage of CD45+ cells in the TME of indicated treatment groups (n=5 isotype and n=7 anti-CSF1R tumors per group). f, Memory CD4 T cells as a percentage of CD45+CD4+ T cells in the tumor (p=0.0001 isotype vs anti-CXCR2+ anti-CTLA4 in tumor infiltrating lymphocytes: TILs) and tumor-draining lymph node (p=0.0234 isotype vs anti-CXCR2 + anti-CTLA4 in TDLN) of indicated treatment groups (n=5 isotype, n=10 anti-CXCR2, n=9 anti-CTLA4, and n=9 anti-CXCR2 + anti-CTLA4 tumors per group, repeated x2). g, Memory CD8 T cells as a percentage of CD45+CD8+ TILs and TDLN of indicated treatment groups, p=0.0004 and p=0.0084 isotype vs anti-CXCR2+ anti-CTLA4 in TIL and TDLN respectively, replicates as in f. h, Representative plot of memory CD8+ TILs and TDLN of indicated treatment groups (repeated x2). For a-c, treatment started when tumor volumes reached 400mm3. For d-h, treatment started when tumor volumes reached 200mm3. Average tumor volume (with SEM) for each experimental group. Log-rank (Mantel-Cox) test was used for survival analysis. Flow cytometry as in materials and methods. Tukey’s multiple comparisons test with a single pooled variance was performed for PMN-MDSC depletion experiment. Bar plots represent means with SEM. Unpaired two-tailed (d-g) t-tests were performed, p-values ≤ 0.0001 (****); p-values ≥ 0.05 (ns).
Discussion
Our studies reveal a novel mechanism by which castration drives the infiltration of suppressive immune cells (PMN-MDSC) into the PCa TME and define a therapeutically targetable chemokine axis. We found that castration results in increased Cxcl15 and IL-8 secretion by PCa epithelial cells; mechanistically this occurs when ADT releases AR-mediated repression at the Cxcl15 and IL-8 promoters, respectively. Secondly, we showed that upregulation of human IL-8, as well as murine Cxcl15, recruits functionally suppressive PMN-MDSCs into the PCa TME. Lastly, we found that blocking CXCR2 at the time of ADT attenuated PMN-MDSC infiltration, rendering prostate tumors more responsive to ICB. Interestingly, recent relevant clinical data show that the activity of ICB in patients is inversely proportional to pre-treatment IL-8 levels in other tumor types28,29, providing further support for a potential mechanism by which IL-8 mediated PMN-MDSC recruitment may attenuate the efficacy of ICB in PCa. Our findings are further corroborated by clinical data showing that PMN-MDSCs accumulate in the blood of patients with advanced PCa30–32, and that an intra-tumoral PMN signature is associated with poor outcome33. Finally, our data are also supported by pre-clinical studies showing that blocking MDSC function increases the efficacy of ICB in other animal models of CRPC9.
Our data showing near abrogation of PMN-MDSC infiltration following CXCR2 blockade support a primary role for this receptor in the migration of these cells post ADT. While we found that the murine IL-8 homologue Cxcl15 secreted by PCa cells is a major driver of castration-mediated PMN-MDSCs infiltration in these models, the recruitment of PMN-MDSCs and neutrophils may also be driven by other chemokines such as Cxcl134 and Cxcl1235. Although our findings suggest a role for tumor infiltrating PMN-MDSCs in suppressing anti-tumor activity of polyfunctional CD8 T cells, reducing the density of intra-tumoral PMN-MDSCs may also attenuate PCa progression by decreasing levels of IL-23, a cytokine with a recently described role in the progression of PCa to castration-resistance12. Given the established role of IL-8 in epithelial to mesenchymal transition (EMT), angiogenesis, and as an autocrine growth factor36, it is also noteworthy that blocking IL-8 may impact other aspects of tumor biology that warrant further investigation.
Translationally, our data suggest that inhibition of castration-mediated PMN-MDSC infiltration may be optimal when CXCR2 is blocked prior to initiating ADT. Based on these findings, we have initiated a phase 1b/2 trial to test whether adding ICB and anti-IL-8 prior to a short course of ADT can prevent PMN-MDSC infiltration and delay progression in men with castration sensitive PCa (NCT03689699). However, our data showing robust PMN-MDSC infiltration in later stage castration resistant tumors also support the possibility that later stage PCa patients may be responsive to IL-8 / CXCR2 blockade as well. Thus, targeting the IL-8 / CXCR2 chemokine axis in combination with immune checkpoint blockade may represent a novel treatment paradigm to improve responses to immunotherapy in men with PCa.
Materials and Methods
Patient Samples
Formalin fixed, paraffin embedded (FFPE) human prostate cancer samples were obtained from consented patients treated with androgen-deprivation therapy (ADT; degarelix; 240mg subcutaneous) in a neo-adjuvant trial (NCT01696877)22 and matched control radical prostatectomies were obtained from patients treated at the Johns Hopkins Sidney Kimmel Comprehensive Cancer Center (Baltimore, MD) under IRB-approved clinical protocol J1265. All patients provided written, informed consent.
Cell Lines
Myc-CaP cells, derived from spontaneous prostate cancer in c-Myc transgenic mice13,14, were a generous gift from Dr. C. Sawyers. To generate MCRedAL, Myc-CaP cells were transduced using mCherry containing retroviral particles from the supernatants of 293T cells transfected with pRetroQ-mCherry-C1 (Clontech, Cat#632567); MCRedAL cells were then isolated by FACS sorting based on mCherry expression. Myc-CaP and MCRedAL cells were cultured in DMEM as previously described13. LNCaP, VCaP, CWR22Rv1, DU145, PC3, and 293T cell lines were obtained and cultured as recommended by the ATCC. LAPC4 (a gift from Dr. J.T. Isaacs) were maintained in RPMI-1640 (Corning, Cat#17–105-CV) supplemented with 10% fetal bovine serum (FBS; Gemini Bio-Products, Cat#100–106). Castration-resistant LNCaP-abl cells were a gift from Dr. Z. Culig and cultured as described previously37. LAPC4-CR and VCaP-CR (a gift from S. Yegnasubramanian) were derived by passaging LAPC4 and VCaP cells through castrated animals and further subculturing in RPMI-1640 supplemented with 10% charcoal stripped serum (CSS; Gibco, Cat#A3382101) supplemented with 1X B-27 Neuronal Supplement (Gibco, Cat#17504044). For all in vitro experiments involving androgen deprivation, 10% FBS was substituted for 10% CSS in complete media. For migration/chemotaxis assays, prostate cancer cell lines were cultured in complete media containing either 0.5% or 2.5% FBS for human and murine cells, respectively. All cell lines were cultured in 1% penicillin/streptomycin (Gibco, Cat#15140122) media at 37°C, 5% CO2.
Mouse Strains
Seven-week-old FVB/NJ, J:NU, C57BL/6-Tg(TcraTcrb)1100Mjb/J (OT-I), and B6.SJL-PtprcaPepcb/BoyJ (CD45.1) male mice were purchased from The Jackson Laboratory. A breeding pair of the transgenic inducible model of prostate cancer, NPK mice24, was a gift from Dr. Cory Abate-Shen; experimental animals were bred in-house. A breeding pair of Hoxb13-rtTA|TetO-H2BGFP (HOXB13-GFP) mice38 was a gift of Dr. Charles Bieberich at UMBC, experimental animals were also bred in-house. Animals were kept in specific pathogen-free conditions under 12hr light-dark cycles with temperature and humidity set points at 20–25°C and 30–70%, respectively, at either Columbia University Medical Center or Johns Hopkins University School of Medicine. All animal experiments were performed in accordance with protocols approved by the Institutional Animal Care and Use Committee (IACUC) at the respective institutions.
Prostate Tumor Allografts and Xenografts
Eight-week-old male FVB/NJ and J:NU mice were subcutaneously inoculated in the right flank with either Myc-CaP or MCRedAL (1×10⁶ cells/mouse), and LNCaP or PC3 (3×10⁶ cells/mouse). Tumor diameters were measured with electronic calipers every 3 days as indicated and tumor volume was calculated using the formula: [longest diameter × (shortest diameter)2]/2. Myc-CaP tumor bearing mice received androgen-deprivation therapy (ADT or CTX) 4 weeks after tumor implantation, as indicated in figure legends. CTX was administered via subcutaneous (sc) injection of degarelix acetate (a GnRH receptor antagonist; Ferring Pharmaceuticals Inc.) at a dosage of 0.625mg/100μl H2O/25g body weight every 30 days, unless otherwise indicated. Onset of castration-resistance was defined as the time to tumor size increased by 30% (~650 mm3) after CTX. Chemical castration using degarelix was equivalent to bilateral orchiectomy as described in Extended Data Figure 1a.
Transgenic Inducible Model of Prostate Cancer
Tumor formation was induced in eight-week-old male NPK mice carrying the Nkx3.1CreERT2/+ allele, a conditional allele for Pten (Ptenflox/flox), and a lox-stop-lox KrasG12D allele expressing an inducible Kras allele with tamoxifen (Sigma, Cat#T5648) dissolved in corn oil and administrated by oral gavage (100mg/kg) once daily for four consecutive days as described previously24,25. Three months after tumor induction, NPK mice were either treated with vehicle or degarelix acetate as described above. Tumors were harvest four months after tumor induction – 30 days after degarelix was administrated.
Androgen Modulation In Murine Prostate
Eight-week-old male HOXB13-GFP mice carrying the Hoxb13-rtTA transgene and a Tetracycline operator–Histone 2B-Green Fluorescent Protein (TetO-H2BGFP), which results in GFP expression restricted to luminal epithelial Hoxb13+ cells (described previously38), were used to evaluate Cxcl15 expression on murine prostate epithelial cells responsive to androgen signaling. A cycle of prostate regression/regeneration was induced in these mice as described previously39. Briefly, mice were allowed to regress for six weeks to reach the fully involuted state. Mice were randomized to either untreated (CS), or castrated via bilateral orchiectomy. Castrated mice were further dived into pADT or pADT + testosterone (T) treatment groups. Testosterone was administered for four weeks for prostate regeneration using subcutaneous silastic implants yielding physiological levels of serum testosterone. All mice received 2mg/ml of doxycycline (Sigma, Cat#D9891) in the drinking water to induce GFP expression38 under the control of the luminal epithelial promoter, HoxB13, one week prior to euthanization. Murine prostate epithelial cells were isolated by cell sorting based on GFP expression and the following markers CD45-CD11b-F4/80-CD24+CD49fint.
Antibody Blockade
Anti-CXCR2 (murine IgG1-D265A, clone:11C8; a non-FcγR-binding mutant with deficient FcγR-mediated binding; BMS), anti-CSF1R (rat IgG2a, clone:AFS98; with competent FcγR-mediated depletion; BioXCell, Cat#BE0213), and anti-CTLA-4 (murine IgG2a, clone:12C11; with competent FcγR-mediated depletion; BMS)7 were used. Antibodies were administered via intraperitoneal (ip) injection at a dose of 50mg/kg body weight for 3 doses every 4 days for CXCR2, 50mg/kg body weight every 3 days for the duration of the experiment for CSF1R, and/or 10mg/kg body weight for 3 doses every 3 days for CTLA-4. Mouse IgG1 (clone:4F7; BMS), rat IgG2a (clone:2A3; BioXCell, Cat#BE0089), and mouse IgG2a (clone:4C6; BMS) were used as isotype controls. Anti-CXCR2 and anti-CSF1R treatments started 7 days before CTX; while anti-CTLA-4 treatment was started either 3 or 12 days before CTX (400mm3 vs. 200mm3, respectively).
Flow cytometry
Single-cell suspensions from prostate tumor and tissues were prepared using the murine tumor dissociation kit according to the manufacturer’s recommendations (Miltenyi, Cat#130–096-730). Single-cell suspensions of tumor-draining lymph nodes (TDLNs) and spleens were homogenized mechanically with the back of a syringe. Cells were Fc-blocked with purified rat anti-mouse CD16/CD32 (Clone: 2.4G2, BD Biosciences, Cat#553142) for 15min at RT. Dead cells were discriminated using the LIVE/DEAD (L/D) fixable viability dye eFluor 506 or near-IR dead cell stain kit (Thermo Fisher, Cat#50–246-097 and Cat#L34975) and samples were stained for extracellular and intracellular markers as described previously40. Briefly, extracellular staining was performed at room temperature (RT) for 30min followed by 45min of fixation/permeabilization using Perm/Wash (eBioscience, Cat#50–112-9081 or BD Biosciences, Cat#554714) and 45min of intracellular staining at RT. For cytokine staining, cells were stimulated with PMA (50ng/ml; Thermo Fisher, Cat#NC9619504) and ionomycin (500ng/ml; Cell Signaling, Cat#9995S) for 4hrs in the presence of protein transport inhibitor cocktail (eBiosciences, Cat#00–4980-03). Gates of cytokines were determined by fluorescence minus one (FMO) controls. Staining was visualized by fluorescence activated cell sorting (FACS) analysis using a BD FACSCelesta™ and analyzed using FlowJo_v10. Murine prostate luminal epithelial cells are defined as CD45−CD11b−F4/80−CD24+CD49fintGFP+, and prostate epithelial tumor cells are defined as CD45−CD11b−F4/80−mCherry+. Tumor associated macrophages (TAMs) are referred to as CD45+CD11b+F4/80+, inflammatory TAMs as CD45+CD11b+F4/80+Ly6C+MHCII−, immature TAMs as CD45+CD11b+F4/80+Ly6C+MHCII+, MHCIIhi TAMs as CD45+CD11b+F4/80+Ly6C−MHCII+, MHCIIlow TAMs as CD45+CD11b+F4/80+Ly6C−MHCII−. PMN-MDSCs are defined as CD45+CD11b+Ly6C+Ly6G+. CD4 T cells as CD45+CD4+, regulatory T cells as CD45+CD4+CD25+, CD8 T cells as CD45+CD8+, polyfunctional CD8 T Cells as CD45+CD8+INFγ+TNFα+GzB+, and memory CD8 T cells as CD45+CD8+CD44+CD62L−. 123Count eBeads counting beads (Thermo Fisher, Cat#01–1234-42) were used to normalize the numbers of PMN-MDSCs in migration/chemotaxis experiments. All flow antibodies used are listed in Supplementary Table 3.
Protein Quantification
Tumors collected at indicated treatment time points were minced, lysed in CelLytic M (Sigma, Cat#C2978) containing halt protease and phosphatase inhibitor (Thermo Fisher, Cat#78446) in a 1:100 ratio, and incubated on ice for 30min with intermittent vortexing. Tumor lysates were assayed for raw protein concentration with Coomassie assay (Pierce, Cat#23200). IL-8 (BD Bioscience, Cat#555244), CXCL-2, and Cxcl15 (R&D Systems, Cat#DY27605 and Cat#DY442) were analyzed by ELISA kits following the manufacturer’s instructions. IL-8, CXCL-1, CXCL-5, and CXCL-12 (MSD, Cat#K15067L-1) were evaluated using the mesoscale MESO QuickPlex SQ 120 instrument.
Immunohistochemical staining (IHC)
Tumor and tissue samples were fixed with either 10% formalin (Fisher Scientific, Cat#23–305510) or zinc fixative (BD Biosciences, Cat#552658) for 24hrs before paraffin embedding and sectioning. Sections were stained with hematoxylin and eosin (H&E), and antibodies against mouse Ly6G (clone:1A8; BD Bioscience, Cat#551459) and F4/80 (clone:BM8; eBioscience, Cat#14–4801-82). Staining was performed by the Molecular Pathology core of the Herbert Irving Comprehensive Cancer Center at Columbia University using a 1:100 titration. All images were acquired on a Leica SCN 400 system with high throughput 384 slide autoloader (SL801) and a 40X objective; files were processed with Aperio ImageScope_v12.3.1.6002. Marker-positive cell counts were obtained from 5 random 40X fields per histological section and results were averaged over the number of counted fields for the HOXB13-GFP transgenic mouse model. For NPK transgenic tumor model counting was restricted to annotated tumor regions. All image analysis was performed using ImageJ_v2.1.2.
RNA In Situ Hybridization (RISH) and Immunohistochemistry
Manual fluorescent RISH was performed on formalin-fixed and zinc-fixed paraffin embedded sections using manufacturer-supplied protocols. Briefly, 5µm sections were cut, baked at 60°C for 1hr, dewaxed, and air-dried before pre-treatments. RISH Cxcl15 experimental probe, as well as 3-plex positive control probes (cnts; Polr2a, Ppib, Ubc) and 3-plex negative control probes (DapB of Bacillus subtilis strain) from Advanced Cell Diagnostics (ACD) were used in this study. Positive and negative control probes were used to optimize digestion conditions for RNA In situ hybridization. Detection of specific probe binding sites was performed with RISH Multiplex Fluorescent Reagent Kit v2 Reagent kit (ACD, Cat#323100) following the manufacturer’s instructions. Tyramide CF568 (Biotium, Cat#92173) was used to visualize RISH signal. For a more precise identification of cells expressing Cxcl15, RISH was coupled to immunohistochemistry of PanCK (clone:Poly; Dako, Cat#Z0622) and CD45 (clone:30-F11; BD Biosciences, Cat#550539). Immediately after RISH detection, samples were permeabilized with 0.2% TBS-Tween 20 for 10min at RT, and then blocked with 2.5% of normal goat serum for 30min at RT. Primary antibody for PanCK was diluted 1/400 in renaissance background reducing diluent (Biocare Medical, Cat#PD905) and incubated overnight at 4°C. After washing off the primary antibody, the slides were incubated 15min at RT horseradish peroxidase (HRP) secondary antibody (Vector, Cat#MP-7451–50). Tyramide CF640R (Biotium, Cat#92175) was used to visualize PanCK staining. In some cases, CD45 staining was also performed. For this, HRP signal was abolished by a 30min incubation at RT with PeroxAbolish (Biocare Medical, Cat#50–832-55) and then blocked with 2.5% of normal goat serum for 30min at RT. Primary antibody for CD45 was diluted 1/50 in renaissance background reducing diluent and incubated 90min at RT. After washing off the primary antibody, the slides were incubated 15min at RT with HRP-secondary antibody (Vector, Cat#MP-7444–15). Tyramide CF488A (Biotium, Cat#92171) was used to visualize CD45 staining. All images were acquired on a Nikon A1RMP confocal microscope using a 60X objective. Comparisons of ISH-IHC results were performed using ImageJ_v2.1.2. One FFPE block containing the highest grade index tumor was chosen for IL-8 RISH analysis from each prostatectomy case from Degarelix treated patients (n=15; NCT01696877)22 and matched radical prostatectomy specimens (n=20). RISH was performed using the RNAscope 2.5 FFPE Brown Reagent Kit (ACD, Cat#322310) per the manufacturer instructions. Briefly, FFPE tissues were baked at 60°C for 30min, dewaxed, and air-dried before pre-treatments. Slides were incubated with a custom RNAscope target probe designed against IL-8 mRNA (probe region 2–1082, NCBI seq. #NM_000584.3) and counterstained with Gill’s Hematoxylin. A probe designed for peptidyl prolyl isomerase B (PPIB), also known as cyclophilin B, was used as a positive control mRNA (probe region 139–989, NCBI seq. #NM_000942.4) to verify the RNA quality in each FFPE section. Whole tissue slides were scanned at 20X with an Aperio ScanScope CS linear-array scanner and image analysis was performed using AperioImageScope_v12.2.2.8013. Each slide was annotated to restrict the analysis to cancer regions. Staining artifacts and benign glands admixed with cancer were excluded from the analysis.
Whole Genome Expression Profiling and Analysis
MCRedAL tumor were harvested when their tumor volume reached ~500mm3 (CS group), and 7 days after chemical castration (pADT). MCRedAL cells were isolated based on their mCherry+CD45−F4/80−CD11b−expression by flow sorting on a DakoCytomation MoFlo. RNA was extracted using Trizol LS (Invitrogen, Cat#10296028) and treated with DNAse-I using RNA clean & Concentrator (Zymo Research, Cat#R1013). The analysis was performed using Affymetrix Mouse Clariom D (MTA 1.0) array according to the manufacturer’s instructions. Resulting CEL files were analyzed in Affymetrix Expression Console_v. 1.4 using the SST-RMA method, and all samples passed the quality control. Log2 probe intensities were extracted from CEL (signal intensity) files and normalized using RMA quantile normalization, then further analyzed using Partek Genomics Suite_v6.6. Illustrations (volcano plots, heatmaps, and histograms) were generated using TIBCO Spotfire DecisionSite with Functional Genomics. Gene set enrichment analysis (GSEA) of differently expressed genes was performed using the hallmark gene sets Molecular Signature Database (MSigDB: http://www.gsea-msigdb.org/gsea/msigdb/index.jsp).
Nanostring
RNA extraction was performed using the Trizol LS reagent as per manufacturer’s instructions. For NanoString analysis, the nCounter mouse PanCancer Immune Profiling panel was employed using the nCounter Analysis System. Analysis was conducted using nSolver_v2 software (NanoString). Heatmap analyses were performed using R_v3.6.2 (https://www.r-project.org/).
Pairwise Alignment
The homology of the murine chemokines Cxcl1, Cxcl2, Cxcl5, Cxcl15, Cxcl12, and Cxcl17 to human IL-8 was evaluated using BLASTP 2.9.0+ (https://blast.ncbi.nlm.nih.gov/Blast.cgi?PAGE=Proteins)41. Proteins were consider homologous if they shared > 30% amino acid identity42. Expected values of <0.05 were consider statistically significant. The expected value includes an inherent Bonferroni correction.
Chromatin immunoprecipitation assay (ChIP)-Seq
ChIP-Seq data was obtained from GEO (GSE83860) which contains ChIP-Seq data acquired with androgen receptor (AR) and nuclear factor NF-kappa-B p65 subunit (p65) specific antibodies on cell lysates from LNCaP cells cultured under the following treatments: DMSO, DHT, and TNFα43. ChIP-Seq data were aligned to the hg38 reference version using the subread package, and then the BAM files were sorted and indexed using SAMtools. Loci with significant differential binding (FDR=0.05) of pulled-down proteins to DNA were identified using the csaw package for ChIP-Seq analysis, closely following Lun and Smyth’s script. ChIP-Seq visualization was performed using the Integrative Genomics Viewer (IGV) from the Broad Institute (http://software.broadinstitute.org/software/igv/)44. Similarly, AR and RNA polymerase 2 (Pol2) occupancy at the CXCL8, CXCL1, CXCL2, CXCL5, and CXCL12 promoters in LNCaP and VCaP cell lines was assessed in GSE5506445. Finally, we used GSE56288 containing ChIP-Seq datasets for AR, FOXA1 and HOXB13 obtained from benign prostate tissues (n=5) and primary prostate cancers (n=11), to query CXCL8, CXCL1, CXCL2, CXCL5, and CXCL12 promoter occupancy in human tissues46.
ChIP-qPCR
Chromatin immunoprecipitation was performed as described47. In brief, Myc-CaP cells were washed with serum-free media and then grown in media containing 10% charcoal stripped FBS for 48hrs. Cells were treated with either 10, 100nM 5α-Dihydrotestosterone (DHT; Sigma, Cat#D-073–1ML) or vehicle for 8hrs in the presence and absence of TNFα (50Units/ml; PeproTech Cat#315–01A). DNA was cross-linked with 1% formaldehyde in PBS for 10min and crosslinking was quenched by addition of 0.125 M glycine. Fixed cells were then lysed in lysis buffer (1% SDS, 5mM EDTA, 50mM Tris HCl, pH8.1) and sonicated to a fragment size of 200–600bp using a Covaris water bath sonicator. Sheared chromatin was then precipitated using the iDeal ChIP-qPCR Kit (Diagenode, Cat#C01010180) with the following primary antibodies (AR [Millipore, Cat#06–680], H3K9Ac [Abcam, Cat# ab4441], phospho-Ser5 RNA polymerase 2 [pSer5 pol II; Abcam, Cat#ab5408], or control IgG [Cell Signaling, Cat#2729S]) overnight at 4°C. Enriched DNA pull-downs were analyzed using primers specific to Cxcl15 locus: Forward: 5’-CTCCTTCTGGGCTTGTGAAG-3’ and Reverse: 5’-AGGCCACAGGGCTTCTTTAT-3’ using quantitative (q) RT-PCR.
Similarly, LNCaP cells were washed with serum-free media and then grown in media containing 10% charcoal stripped FBS for 72hrs. Cells were treated with either 0.1, 1, 10, or 100nM DHT or vehicle for 8hrs in the presence of TNFα (50Units/ml; PeproTech, Cat#300–01A). Sheared chromatin was then precipitated using the iDeal ChIP-qPCR Kit with primary antibodies as above (AR, H3K9Ac, pSer5 pol II, or control IgG). Enriched DNAs were analyzed using primers specific to CXCL8 locus: Forward: 5’-AGCTGCAGAAATCAGGAAGG-3’ and Reverse: 5’-TATAAAAAGCCACCGGAGCA-3’ using quantitative (q) RT-PCR. Control primers for the KLK3 locus were described previously47. For each sample, 1/100 of the lysate volume prior to antibody precipitation was saved as total input. This input sample was de-crosslinked and handled identical to the IP samples in subsequent qPCR steps. The percent input was calculated by substracting the CT-value of the corresponding input sample from the CT-value of the IP sample and then performing Log2 transformation (percent input=2^-(CT[IP] – CT[input])). Data is shown as relative enrichment normalized to input DNA.
Quantitative (q) RT-PCR
Total RNA was extracted using Trizol (Invitrogen, Cat#15596018). cDNA was prepared from total RNA preps using the RNA to cDNA EcoDry Premix (Clontech, Cat#639548). Real-time assays were conducted using TaqMan real-time probes (Applied Biosystems). ∆∆CT method was used for relative gene expression. Expression of the target gene was normalized to the reference gene (18S; Cat#4310893E) and the mean expression level of the control group. LCM samples were normalized to 18S, TBP (Hs00427620_m1), and GAPDH (Hs02758991_g1) reference genes.
Laser Capture Microscopy (LCM)
FFPE whole tissue slides from cancer containing blocks from patients with clinically localized prostate cancer were obtained from radical prostatectomy specimens from control patients (n=20) or Degarelix treated patients (n=15; NCT01696877)22, were sectioned at a thickness of 8 μm and transferred onto PEN membrane glass slides. Sections were deparaffinized, hydrated and stained with hematoxylin prior to microdissection. Individual cancer cells and cancer cell clusters were microdissected by a trained pathologist using a Leica LMD 7000 laser capture microscope. RNA was recovered from the microdissected material using the RNeasy FFPE kit (Qiagen, Cat#73504). Quantitative RT-PCR was performed as described above. For the analysis, a Mann-Whitney U test was performed.
Luciferase Assay
The minimal IL-8 promoter containing the binding site (BS) for AR and p65 (identified in Extended Data Fig. 2b) was cloned into pGL4[luc2P/Hygro] constructs (Promega, Cat#CS179401) driving the firefly luciferase reporter gene. To examine the levels of IL-8 promoter activity, plated Myc-CaP WT, scramble (Scr) and AR knockdowns (KD) cells were co-transfected with the IL-8 promoter driven firefly luciferase construct and the promoterless Renilla luciferase construct. Transfection was performed using lipofectin 3000 (Invitrogen, Cat#L3000001) according to the manufacturer’s instructions. Myc-CaP cells were conditioned with 10nM DHT in the presence of TNFα (50Units/ml). Enzalutamide (10µM; Selleck Cat#S1250) was used to pharmacologically inhibit AR signaling in Myc-CaP WT cells. Luciferase activity was evaluated 6 hrs after changing the condition media according to the figure legends. The results are normalized as the ratio between firefly luciferase activity to renilla luciferase activity and expressed as relative luminescence units (RLU).
AR Knock Downs
Transduction was performed using lentiviral particles containing either scramble shRNA or a unique 29-mer shRNA targeting mouse Ar packaged on pGFP-C-shLenti construct (ORIGENE, Cat#TL514763V). Viral load was titrated to mimic different multiplicity of infections (MOI 5, 10, and 20) using appropriate volumes of medium with lentivirus containing polybrene (Sigma, Cat#TR-1003-G). Successfully transduced cells were selected by culturing in the presence of 2µg/ml of Puromycin (InvivoGen, Cat#ant-pr-1), and evaluated based on their GFP expression 7 days after transfection. Flow Cytometry confirmed above 80% enrichment.
IL-8 and Cxcl15 CRISPR/Cas9 Knock Outs
The 20bp long gRNA, designed using Deskgen online software (https://zlab.bio/guide-design-resources), for targeting IL-8 and Cxcl15 in exon 3 (5’-TTCAGTGTAAAGCTTTCTGA-3’ and 5’ACAGAGCAGTCCCAAAAAAT-3’, respectively) were incorporated into two complementary 100-mer oligonucleotides and cloned into a gRNA containing plasmid containing the (NeoR/KanR) cassette (Addgene #41824). The human codon optimized pCAGGS-Cas9-mCherry was used for gene-editing experiments (a gift from Stem Cell Core Facility at Columbia University). gRNA and Cas9 containing plasmids were introduced to prostate epithelial cells using the basic nucleofector kit (Lonza, Cat#VPI-1005) following the manufacturer’s instructions for primary mammalian epithelial cells (program W001). Successfully transfected cells were selected by culturing in the presence of 400µg/ml of neomycin sulfate analog (G418; Gibco, Cat#10131027), and isolated based on their mCherry expression 24hrs after transfection. Knock out clones were screened for IL-8 and Cxcl15 expression by ELISA and gene-editing confirmed by PCR amplification and Sanger sequencing (GENEWIZ) using primers ~200bp away from the cut site (IL-8 Forward: 5’-TTTGGACTTAGACTTTATGCCTGAC-3; IL-8 Reverse: 5’-TCCTGGGCAAACTATGTATGG-3; Cxcl15 Forward: 5’-GCTAGGCACACTGATATGTGTTAAA-3; Cxcl15 Reverse: 5’-ACATTTGGGGATGCTACTGG-3).
Migration/Chemotaxis Assay
Cells and supernatants used in this assay were resuspended in culture media containing 0.5% or 2.5% FBS. Transwell plates of 3µm pore size were coated with Fibronectin (Corning, Cat#354597) and loaded with 500ml of medium or with different cell supernatants in triplicates (lower chamber). Cells were resuspended at 2×10⁷ cells/ml, and 200ml of this suspension was placed in each of the inserts (upper chamber). After 2.5hrs of incubation at 37°C and 5% CO2, inserts were removed and 10,000 beads were added to each well. In some cases, either isotype, anti-CXCR2, or anti-IL-8 (200µg/ml) were added at the beginning of the experiment. The cells in the lower chamber were collected along with the starting cell population, stained with L/D, CD11b, Ly6C, and Ly6G and evaluated by flow cytometry in a BD FACSCelesta™. The ratio of beads to cells was determined, allowing calculation of the number of cells that had migrated to the bottom well. In vivo, LD-PMN-MDSCs were collected as described below from splenocytes of CR-Myc-CaP tumor bearing mice and labeled with DiD (DiIC18(5) or 1,1’-Dioctadecyl-3,3,3’,3’-Tetramethylindodicarbocyanine, 4-Chlorobenzenesulfonate Salt; Invitrogen, Cat#V22887), a lipophilic membrane dye, as described previously48. DiD+ LD-PMN-MDSCs were adoptively transferred into FVB/NJ recipient 8-week male mice and their ability to migrate in response to 200ng of recombinant Cxcl15 (PeproTech, Cat#250–37) was evaluated 4hrs after injection. Beads were also used to calculate absolute numbers of Ly6G+ PMNs and DiD+ LD-PMN-MDSCs in vivo.
PMN-MDSC Enrichment
Animals were sacrificed and spleens were collected. After dissociating cell clumps, the cell suspension was centrifuged (740g, 10min, RT) and resuspended in 1ml HBSS–EDTA containing 0.5% BSA. Cells were then resuspended in 50% Percoll solution and treated on a three-layer Percoll (Sigma, Cat#GE17–0891-01) gradient (55%, 72%, and 81%) at (1500g, 30min, 10°C without break). LD-PMN-MDSCs were collected from the 50–55% and 55–72% interfaces. Red blood cells (RBCs) were eliminated with RBC lysis solution (Miltenyi, Cat#130–094-183).
In vitro Suppression Assays
PMN-MDSCs were isolated from the spleen of CR-Myc-CaP-tumor bearing mice using the neutrophil isolation kit (Miltenyi, Cat#130–097-658) according to the manufacturer’s instructions; greater than 95% enrichment was confirmed by flow cytometry. Unless otherwise indicated, a density gradient separation was performed prior to column purification. OT-I (CD45.2) transgenic splenocytes were mixed at a 1:10 ratio with sex-matched CD45.1 splenocytes. Splenocytes containing CD8 T responder cells were stained with CellTrace Violet (5µM CTV; Thermo Fisher, Cat#C34557) and plated on a 96-well round-bottom plate at a density of 2×10⁵ cells per well. PMN-MDSCs cells were added at 2-fold dilutions starting from 2×10⁵ cells, in the presence of their cognate peptides (5pM OVA; Anaspec, Cat#AS-60193–1) and incubated for 60hrs. Proliferation of CD8 T responder cells (gated as L/D−CD8+CTV+) was quantified by flow cytometry based on the dilution of CTV. Percent suppression (% Suppression) was calculated by the following formula: % Suppression=[1-(% divided cells of the condition/the average of % divided cells of T responder only conditions)] x 100.
Z-score Analysis
IL-8 expression was evaluated in a publicly available data set (GSE8466)21 using z-score values of quantile-normalized microarray transcripts from benign prostate biopsies. Z-score values were obtained by scaling the data for each gene in each patient to: (expression - mean expression across all genes)/(standard deviation of expression across all genes).
Statistics & Reproducibility
Numbers of mice for each experiment were chosen based on the number required for statistical significance, as well as our prior success rates for tumor implantation (for experiments utilizing allografts and xenografts). Calculations were performed using Gpower software based on preliminary experiments and a two-sided type I error (alpha) = 0.05 with a 80% power. No data were excluded from the analyses, although ulcerated tumors were not processed. Groups were established based on genotype and tumor status. All other aspects were randomized. All animals were exposed to the same environment. Harvested tissues were processed identical conditions and reagents. Human specimens were obtained from participants in a randomized clinical trial (NCT01696877) and matched control patient samples obtained from patients treated at Johns Hopkins Sidney Kimmel Comprehensive Cancer Center (Baltimore, MD) under IRB-approved clinical protocol J1265. Tumor measurements and IHC staining were performed by trained technicians who were blinded as to the treatment groups. Blinding was not performed for flow cytometry analyses; this was not possible for flow cytometry experiments because all samples were collected and processed in parallel by the same individual and the treatment group data were indicated on the mouse cage. In vitro assays in this manuscript were performed unblinded; the treatment groups had to be clearly identified throughout the experiments to prevent cross contamination. The neo-adjuvant clinical trial that randomized patients to ADT vs Vaccination + ADT was an unblinded study. Samples from patients on the vaccine arm of the study were not included, here we analyzed only patients treated with ADT alone. Statistical analyses were performed using Prism 7_v04 (GraphPad). Unpaired t t-tests, Mann-Whitney U test, Tukey’s and Sidak’s multiple comparisons tests, or Log-rank (Mantel-Cox) tests were conducted and considered statistically significant at p-values ≤0.05 (*), 0.01 (**), 0.001 (***) and 0.0001 (****). Further information on research design is available in the Nature Research Reporting Summary linked to this article.
Biological Materials
Biological materials used in this study may be requested from the corresponding author, with the exception of anti-CTLA-4, anti-CXCR2, and anti-IL-8 antibodies which were obtained through an MTA with A.K and M.S.
Data Availability
Microarray data from this study have been deposited in the Gene Expression Omnibus (GEO) under accession code GSE171491. Previously published microarray data ChIP-seq data that were re-analyzed here are available under accession codes GSE8466, GSE56288, GSE83860, and GSE55064. Source data for this study have been provided as Source Data files. All other data supporting the findings of this study are available from the corresponding author upon reasonable request.
Extended Data
Extended Data Figure 1 |. Cxcl15 Regulation Upon AR signaling Stimulation and Inflammatory Stimuli in Prostate Tumor Epithelial Cells.
a, Androgen responsive prostate tumor cells progressed from castration-sensitive (CS) to androgen responsive (pADT), and eventually developed castration-resistance (CR). CR was tumor size defined as ≥ 30% of nadir tumor volume. Top, tumor growth curve of MCRedAL tumors (n=3 mice per group, repeated x2); bottom: treatment and harvest timeline. CTX: Castration. b, Upper: sorting strategy to isolate tumor epithelial cells from a based on their expression of mCherry and their CD45−CD11b−F4/80−phenotype; Lower: purity check of mCherry+ sorted cells. c, Histogram of log2 fold change comparisons (SD Log2 FC) between pADT and CS groups among all the microarray transcripts (n=3 tumors per group). d, qRT-PCR quantification of Cxcl15 in Myc-CaP cells cultured at indicated concentrations of DHT for 8hrs and TNFα (50Units/ml) for 6hrs, cells cultured in androgen-free media for 48 hours before stimulation (n=2 independently cultured replicates per condition, repeated x2). Expression levels normalized to mean ΔCT level in samples cultured in androgen free media without TNFα or DHT. e, qRT-PCR quantification of Cxcl15 in Myc-CaP WT cells expressing either nothing, scramble (Scr) shRNA, or an anti-AR shRNA (KD: knock-down) cultured in the presence of DHT (10nM) for 8hrs and TNFα (50Units/ml) for 6hrs, cells cultured in androgen-free media for 24hrs before DHT stimulation (n=2 independently cultured replicates per condition, repeated x2). Expression levels normalized to mean ΔCT level in WT samples cultured in androgen free media without TNFα or DHT. f, qRT-PCR quantification of Cxcl15 in Myc-CaP cells cultured at indicated concentrations of DHT for 8hrs and TNFα (50Units/ml) for 6hrs in the presence and absence of the AR blocker Enzalutamide (10µM), cells cultured in androgen-free media for 48hrs before stimulation (n=2 independently cultured replicates per condition, repeated x2). Bar plots represent means with SEM. Unpaired two-tailed (d-f) t-tests were performed, p-values ≤ 0.0001 (****); p-values ≥ 0.05 (ns).
Extended Data Figure 2 |. IL-8 Regulation in Prostate Tumor Epithelial Cells.
a, Percentage input bound in ChIP-qPCR assays assessing binding of AR, pSer5 Pol II, and H3K9ac at the KLK3 (PSA) promoter (top) and upstream region (bottom) in LNCaP cells cultured at indicated concentrations of DHT for 8hrs and TNFα (50Units/ml) for 6hrs, cells cultured in androgen-free media for 72hrs before DHT stimulation (n=2 independently cultured replicates per group). b, ChIP-Seq analysis of AR and NF-κB p65 subunit at the IL-8 (CXCL8) promoter in LNCaP cells cultured in the presence of either vehicle (DMSO), DHT (100nM), or TNFα (1000U/ml) (n=2 replicates per group; GSE83860). c, ChIP-Seq analysis at the IL-8 (CXCL8) promoter for AR and RNA pol II binding in LNCaP cells (top), and AR binding in VCaP cells (bottom). Both cell lines were cultured in the presence of either vehicle (DMSO) or DHT (10nM) (GSE55064). For b, loci with significant differential binding (black bar) were identified as described in materials and methods. Blue shading marks AR binding site; while orange shading marks NF-κB p65 subunit binding site. Bar plots represent means with SEM. Unpaired one-tailed t-tests were performed, p-values ≤ 0.0001 (****); p-values ≥ 0.05 (ns).
Extended Data Figure 3 |. Chemokine Regulation in Prostate Tumor Epithelial Cells.
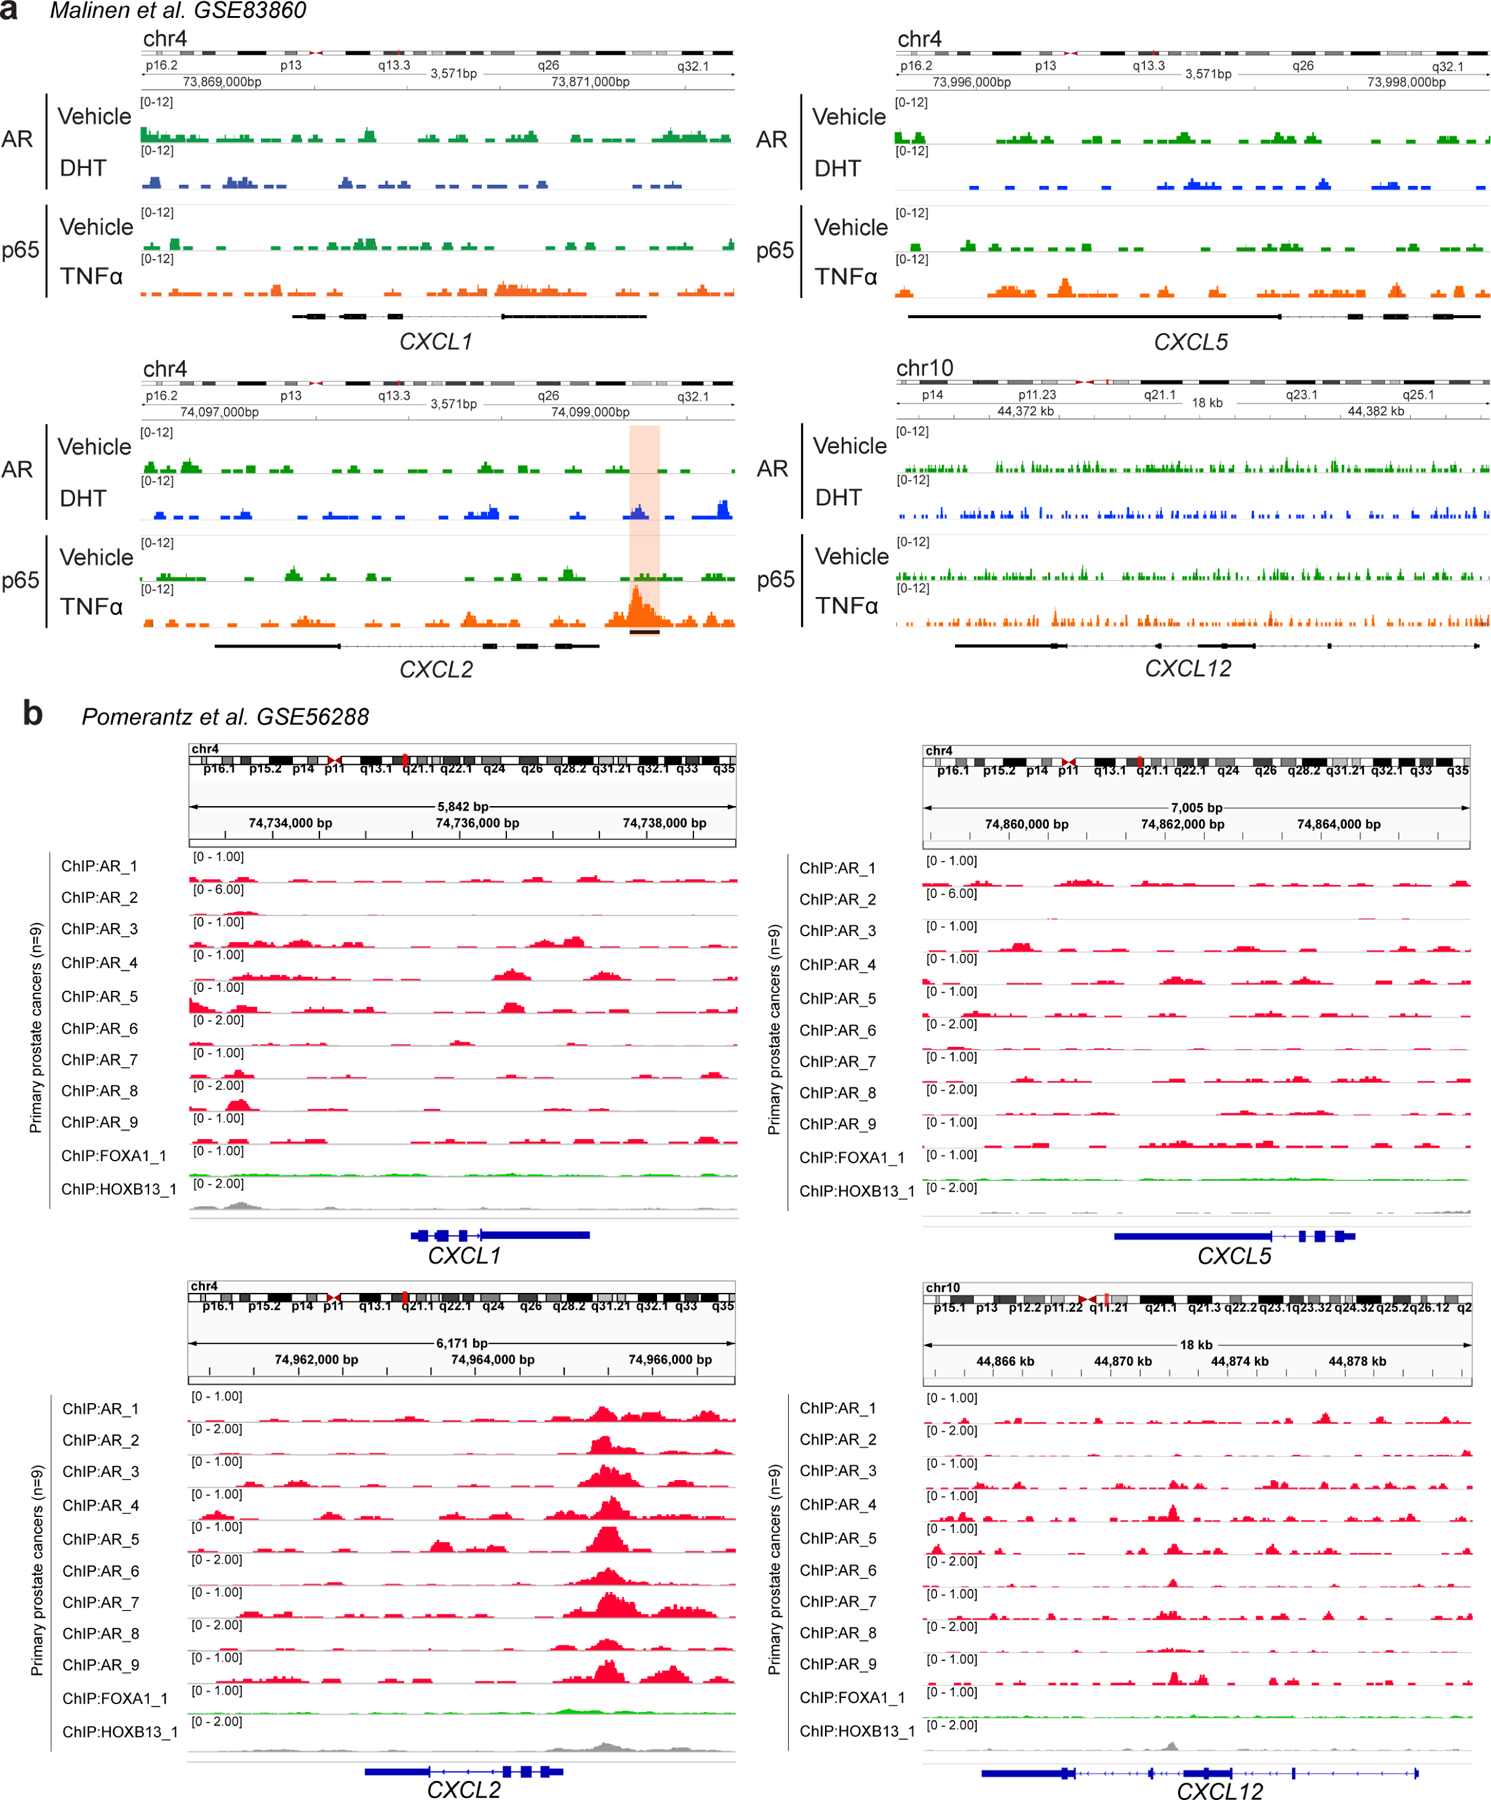
a, ChIP-Seq enrichment of AR and NF-κB p65 subunit at the CXCL1, CXCL2, CXCL5, and CXCL12 promoters in LNCaP cells cultured in the presence of either vehicle (DMSO), AR signaling (DHT: 100nM), or an inflammatory stimuli (TNFα: 1000U/ml) (n=2 independently cultured replicates per group; GSE83860). Orange shading marks NF-κB p65 subunit binding site. b, ChIP-Seq enrichment of AR at the CXCL1, CXCL2, CXCL5, and CXCL12 promoters in primary human prostate cancers (n=9 patients; GSE56288).
Extended Data Figure 4 |. IL-8 Expression in Mouse and Human Prostate Cancer.
a, Representative images of positive and negative controls (cnts: murine and bacteria probe, respectively) in Myc-CaP tumors from indicated treatment groups highlight the specificity of RNA In situ hybridization independently of treatment groups. Tumors were harvested when tumor volume reached ~500mm3 (CS group) or at the time of castration-resistance (CR). Prostate tumor tissue sections were hybridized with CF568-labeled probe sets (white) to Cxcl15, CF640-labeled anti-PanCK antibody (red), and CF488-labeled anti-CD45 antibody (green). Nuclei were counterstained with DAPI (blue). b, qRT-PCR quantification of IL-8 in AR positive castration-sensitive (LNCaP, LAPC4, and VCaP) and AR independent castration-resistant (CWR22Rv1, DU145, and PC3) human prostate cancer cell lines (n=2 independently cultured replicates per group, repeated x2). IL-8 expression levels were normalized to mean ΔCT level in DU145 samples. c, CXCL1, CXCL2, CXCL5, and CXCL12 protein expression in human AR positive castration-sensitive LNCaP cell line (CS) and it’s isogenic castration-resistant counterpart LNCaP-abl (CR) quantified by MSD (n=3 independently cultured replicates per group, repeated x1). d, IL-8 protein expression in LNCaP and AR-independent PC3 human prostate cancer cell lines quantified by MSD, replicates as in c. e, Treatment scheme for GFP induction with Doxycycline (DOX) in transgenic Hoxb13-rtTA|TetO-H2BGFP mice for specific isolation of benign murine prostate epithelial cells from castration-sensitive (CS), androgen-deprivation treated (pADT) non-tumor bearing mice, and ADT-treated mice that received testosterone repletion (pADT + T). f, IL-8-RISH quantification in human prostate tumor specimens from untreated (n=20 patients) or ADT-treated (n=15 patients; NCT01696877). Quantification was restricted to tumor areas and represented as number of positive cells per mm2. Images representative of 3 independent experiments. RISH images are 60X magnification; scale bar=100 μm. For b, Tukey’s multiple comparisons test with a single pooled variance was performed, p-values ≤ 0.0001 (****). Bar plots represent means with SEM. Unpaired two-tailed (c-d) t-tests were performed, p-values ≤ 0.0001 (****); p-values ≥ 0.05 (ns). For f a Mann-Whitney U test was used due to the non-normal data distribution observed. The box plot includes 25th to 75th of all IL-8 positive cells/mm2 values with horizontal line indicating the median values. The whiskers represent the highest values, including outliers and extremes.
Extended Data Figure 5 |. PMN-MDSCs Infiltration Relays on IL-8 (Cxcl15) / CXCR2 Signaling Following ADT.
a, PMN-MDSCs as a percentage of CD45+ cells in the TME of indicated human prostate tumors as determined by flow cytometry (n=3 LNCaP and n=6 PC3 tumors per group, 2 independent experiments). b, Representative H&E and immunohistochemistry (Ly6G and F4/80) sections of the indicated human prostate xenografts (repeated x3). c, Dorsal prostate transgenic NPK tumors (p=0.0493) and d, Anterior prostate transgenic NPK tumor (p=0.0006). Left: representative H&E and immunohistochemistry of Ly6G in transgenic NPK tamoxifen-inducible prostate tumors harvested from untreated (CS group) or ADT-treated mice (CR group). CTX (degarelix) was administrated 3 months after tamoxifen-induction, and tumors were harvest 30 days later; right: Ly6G positive counts per mm2 of tumor area as described in the methods section. e, PMN-MDSC density normalized to mg of tumor weight in transgenic NPK tamoxifen-inducible prostate tumors from mice treated as described in c-d (p=0.0208; cells/mg; n=4 CS & n=3 CR tumors per group). f, Left: representative H&E and immunohistochemistry of Ly6G in non-cancerous murine prostate from castration-sensitive (CS), androgen-deprivation treated (pADT) non-tumor bearing mice, and ADT-treated mice that received testosterone repletion (pADT + T). Repeated x2; right: counts of Ly6G positive cells per field as described in the methods section. g, Representative histograms of protein expression determined by flow cytometry in PMN-MDSCs from indicated organs (repeated x2). h, Representative H&E and immunohistochemistry (Ly6G and F4/80) on CR-Myc-CaP allografts treated as indicated (repeated x3). i, Representative H&E and immunohistochemistry (Ly6G and F4/80) in PC3 tumor xenografts treated as indicated (repeated x3). H&E and IHC images are 40X magnification; scale bar=50 μm. Bar plots represent means with SEM. Unpaired two-tailed (a-e) t-tests were performed, p-values ≤ 0.0001 (****); p-values ≥ 0.05 (ns). For f, Tukey’s multiple comparisons test with a single pooled variance was performed.
Supplementary Material
Acknowledgments
We thank members of the Drake Lab for discussion and insightful comments; F. Veglia for advice with in vitro suppression assays; K.C. Smith, A. Floratos, and the Center for Computational Biology and Bioinformatics at Columbia University for ChIP-Seq analysis; S. Coley, T. Swayne, E. Munteanu, and the Confocal and Specialized Microscopy Shared Resource at Columbia University for help with microscopy; L. Dasko-Vincent from the Sidney Kimmel Comprehensive Cancer Center Imaging Facility at Johns Hopkins for support with LCM, J. Pevsner for assistance on protein homology analyses, and B. Johnson for help with statistical analyses. This study was supported by U.S. Department of Defense (W81XWH-13–1-0369), U.S. National Institutes of Health National Cancer Institute (R01: CA127153 and R01: CA183929–05), the Patrick C. Walsh Fund, the OneInSix Foundation, and the Prostate Cancer Foundation. Research reported in this publication was performed in the CCTI Flow Cytometry Core, supported in part by the Office of the Director, National Institutes of Health under awards S10OD020056. H&E/IHC staining and image collection for this work was performed in the Molecular Pathology Shared Resource and the Confocal and Specialized Microscopy Shared Resource of the Herbert Irving Comprehensive Cancer Center at Columbia University, supported by NIH grant #P30 CA013696 (National Cancer Institute). The content is solely the responsibility of the authors and does not necessarily represent the official views of the National Institutes of Health.
Footnotes
Competing Interests
C.G.D. has served as a consultant for Agenus, Dendreon, Janssen Oncology, Eli Lilly, Merck, AstraZeneca, MedImmune, Pierre Fabre, Genentech, and Genocea Biosciences. A.M.C. is a shareholder of Aclaris Therapeutics, Inc, and a consultant for Dermira, Inc. and Aclaris Therapeutics, Inc. Columbia University has filed a US patent claiming the benefit of U.S. Provisional Patent Application No. 62/809,060 (inventors C.G.D. and Z.A.L.B.) on the use of IL-8 / CXCR2 blockade of PMN-MDSC recruitment to the TME for the treatment of prostate cancer. The remaining authors declare no competing interests.
References
- 1.Kantoff PW et al. Sipuleucel-T immunotherapy for castration-resistant prostate cancer. N Engl J Med 363, 411–422, doi: 10.1056/NEJMoa1001294 (2010). [DOI] [PubMed] [Google Scholar]
- 2.Kwon ED et al. Ipilimumab versus placebo after radiotherapy in patients with metastatic castration-resistant prostate cancer that had progressed after docetaxel chemotherapy (CA184–043): a multicentre, randomised, double-blind, phase 3 trial. Lancet Oncol 15, 700–712, doi: 10.1016/S1470-2045(14)70189-5 (2014). [DOI] [PMC free article] [PubMed] [Google Scholar]
- 3.Beer TM et al. Randomized, Double-Blind, Phase III Trial of Ipilimumab Versus Placebo in Asymptomatic or Minimally Symptomatic Patients With Metastatic Chemotherapy-Naive Castration-Resistant Prostate Cancer. J Clin Oncol 35, 40–47, doi: 10.1200/JCO.2016.69.1584 (2017). [DOI] [PubMed] [Google Scholar]
- 4.Topalian SL, Drake CG & Pardoll DM Immune checkpoint blockade: a common denominator approach to cancer therapy. Cancer Cell 27, 450–461, doi: 10.1016/j.ccell.2015.03.001 (2015). [DOI] [PMC free article] [PubMed] [Google Scholar]
- 5.Topalian SL et al. Safety, activity, and immune correlates of anti-PD-1 antibody in cancer. N Engl J Med 366, 2443–2454, doi: 10.1056/NEJMoa1200690 (2012). [DOI] [PMC free article] [PubMed] [Google Scholar]
- 6.Gao J et al. VISTA is an inhibitory immune checkpoint that is increased after ipilimumab therapy in patients with prostate cancer. Nat Med 23, 551–555, doi: 10.1038/nm.4308 (2017). [DOI] [PMC free article] [PubMed] [Google Scholar]
- 7.Shen YC et al. Combining intratumoral Treg depletion with androgen deprivation therapy (ADT): preclinical activity in the Myc-CaP model. Prostate Cancer Prostatic Dis 21, 113–125, doi: 10.1038/s41391-017-0013-x (2018). [DOI] [PMC free article] [PubMed] [Google Scholar]
- 8.Obradovic AZ et al. T-Cell Infiltration and Adaptive Treg Resistance in Response to Androgen Deprivation With or Without Vaccination in Localized Prostate Cancer. Clin Cancer Res 26, 3182–3192, doi: 10.1158/1078-0432.CCR-19-3372 (2020). [DOI] [PMC free article] [PubMed] [Google Scholar]
- 9.Lu X et al. Effective combinatorial immunotherapy for castration-resistant prostate cancer. Nature 543, 728–732, doi: 10.1038/nature21676 (2017). [DOI] [PMC free article] [PubMed] [Google Scholar]
- 10.Lopez-Bujanda Z & Drake CG Myeloid-derived cells in prostate cancer progression: phenotype and prospective therapies. J Leukoc Biol 102, 393–406, doi: 10.1189/jlb.5VMR1116-491RR (2017). [DOI] [PMC free article] [PubMed] [Google Scholar]
- 11.Lopez-Bujanda ZA et al. Robust antigen-specific CD8 T cell tolerance to a model prostate cancer neoantigen. OncoImmunology 9, 1809926, doi: 10.1080/2162402X.2020.1809926 (2020). [DOI] [PMC free article] [PubMed] [Google Scholar]
- 12.Calcinotto A et al. IL-23 secreted by myeloid cells drives castration-resistant prostate cancer. Nature 559, 363–369, doi: 10.1038/s41586-018-0266-0 (2018). [DOI] [PMC free article] [PubMed] [Google Scholar]
- 13.Watson PA et al. Context-dependent hormone-refractory progression revealed through characterization of a novel murine prostate cancer cell line. Cancer Res 65, 11565–11571, doi: 10.1158/0008-5472.CAN-05-3441 (2005). [DOI] [PubMed] [Google Scholar]
- 14.Ellwood-Yen K et al. Myc-driven murine prostate cancer shares molecular features with human prostate tumors. Cancer cell 4, 223–238 (2003). [DOI] [PubMed] [Google Scholar]
- 15.Rossi DL et al. Lungkine, a novel CXC chemokine, specifically expressed by lung bronchoepithelial cells. J Immunol 162, 5490–5497 (1999). [PubMed] [Google Scholar]
- 16.Schmitz JM, McCracken VJ, Dimmitt RA & Lorenz RG Expression of CXCL15 (Lungkine) in murine gastrointestinal, urogenital, and endocrine organs. J Histochem Cytochem 55, 515–524, doi: 10.1369/jhc.6A7121.2007 (2007). [DOI] [PubMed] [Google Scholar]
- 17.Chen R et al. Telomerase Deficiency Causes Alveolar Stem Cell Senescence-associated Low-grade Inflammation in Lungs. J Biol Chem 290, 30813–30829, doi: 10.1074/jbc.M115.681619 (2015). [DOI] [PMC free article] [PubMed] [Google Scholar]
- 18.Elliott CL, Allport VC, Loudon JA, Wu GD & Bennett PR Nuclear factor-kappa B is essential for up-regulation of interleukin-8 expression in human amnion and cervical epithelial cells. Mol Hum Reprod 7, 787–790, doi: 10.1093/molehr/7.8.787 (2001). [DOI] [PubMed] [Google Scholar]
- 19.Fiedler MA, Wernke-Dollries K & Stark JM Inhibition of TNF-alpha-induced NF-kappaB activation and IL-8 release in A549 cells with the proteasome inhibitor MG-132. Am J Respir Cell Mol Biol 19, 259–268, doi: 10.1165/ajrcmb.19.2.3149 (1998). [DOI] [PubMed] [Google Scholar]
- 20.Khanjani S, Terzidou V, Johnson MR & Bennett PR NFkappaB and AP-1 drive human myometrial IL8 expression. Mediators Inflamm 2012, 504952, doi: 10.1155/2012/504952 (2012). [DOI] [PMC free article] [PubMed] [Google Scholar]
- 21.Mostaghel EA et al. Intraprostatic androgens and androgen-regulated gene expression persist after testosterone suppression: therapeutic implications for castration-resistant prostate cancer. Cancer Res 67, 5033–5041, doi: 10.1158/0008-5472.CAN-06-3332 (2007). [DOI] [PubMed] [Google Scholar]
- 22.Antonarakis ES et al. Neoadjuvant randomized trial of degarelix (Deg) ± cyclophosphamide/GVAX (Cy/GVAX) in men with high-risk prostate cancer (PCa) undergoing radical prostatectomy (RP). Journal of Clinical Oncology 35, 5077–5077, doi: 10.1200/JCO.2017.35.15_suppl.5077 (2017). [DOI] [Google Scholar]
- 23.Cioni B et al. Loss of androgen receptor signaling in prostate cancer-associated fibroblasts (CAFs) promotes CCL2- and CXCL8-mediated cancer cell migration. Mol Oncol 12, 1308–1323, doi: 10.1002/1878-0261.12327 (2018). [DOI] [PMC free article] [PubMed] [Google Scholar]
- 24.Aytes A et al. ETV4 promotes metastasis in response to activation of PI3-kinase and Ras signaling in a mouse model of advanced prostate cancer. Proc Natl Acad Sci U S A 110, E3506–3515, doi: 10.1073/pnas.1303558110 (2013). [DOI] [PMC free article] [PubMed] [Google Scholar]
- 25.Arriaga JM et al. A MYC and RAS co-activation signature in localized prostate cancer drives bone metastasis and castration resistance. Nature Cancer 1, 1082–1096, doi: 10.1038/s43018-020-00125-0 (2020). [DOI] [PMC free article] [PubMed] [Google Scholar]
- 26.Alshetaiwi H et al. Defining the emergence of myeloid-derived suppressor cells in breast cancer using single-cell transcriptomics. Sci Immunol 5, doi: 10.1126/sciimmunol.aay6017 (2020). [DOI] [PMC free article] [PubMed] [Google Scholar]
- 27.Antonarakis ES et al. Pembrolizumab for Treatment-Refractory Metastatic Castration-Resistant Prostate Cancer: Multicohort, Open-Label Phase II KEYNOTE-199 Study. J Clin Oncol 38, 395–405, doi: 10.1200/JCO.19.01638 (2020). [DOI] [PMC free article] [PubMed] [Google Scholar]
- 28.Schalper KA et al. Elevated serum interleukin-8 is associated with enhanced intratumor neutrophils and reduced clinical benefit of immune-checkpoint inhibitors. Nature Medicine 26, 688–692, doi: 10.1038/s41591-020-0856-x (2020). [DOI] [PMC free article] [PubMed] [Google Scholar]
- 29.Yuen KC et al. High systemic and tumor-associated IL-8 correlates with reduced clinical benefit of PD-L1 blockade. Nat Med 26, 693–698, doi: 10.1038/s41591-020-0860-1 (2020). [DOI] [PMC free article] [PubMed] [Google Scholar]
- 30.Kawahara T et al. Neutrophil-to-lymphocyte ratio predicts prostatic carcinoma in men undergoing needle biopsy. Oncotarget 6, 32169–32176, doi: 10.18632/oncotarget.5081 (2015). [DOI] [PMC free article] [PubMed] [Google Scholar]
- 31.Yin X et al. Prognostic Role of Neutrophil-to-Lymphocyte Ratio in Prostate Cancer: A Systematic Review and Meta-analysis. Medicine (Baltimore) 95, e2544, doi: 10.1097/MD.0000000000002544 (2016). [DOI] [PMC free article] [PubMed] [Google Scholar]
- 32.Alfaro C et al. Tumor-Produced Interleukin-8 Attracts Human Myeloid-Derived Suppressor Cells and Elicits Extrusion of Neutrophil Extracellular Traps (NETs). Clin Cancer Res 22, 3924–3936, doi: 10.1158/1078-0432.CCR-15-2463 (2016). [DOI] [PubMed] [Google Scholar]
- 33.Gentles AJ et al. The prognostic landscape of genes and infiltrating immune cells across human cancers. Nat Med 21, 938–945, doi: 10.1038/nm.3909 (2015). [DOI] [PMC free article] [PubMed] [Google Scholar]
- 34.Kumar V et al. Cancer-Associated Fibroblasts Neutralize the Anti-tumor Effect of CSF1 Receptor Blockade by Inducing PMN-MDSC Infiltration of Tumors. Cancer Cell 32, 654–668 e655, doi: 10.1016/j.ccell.2017.10.005 (2017). [DOI] [PMC free article] [PubMed] [Google Scholar]
- 35.Patnaik A et al. Cabozantinib Eradicates Advanced Murine Prostate Cancer by Activating Antitumor Innate Immunity. Cancer Discov 7, 750–765, doi: 10.1158/2159-8290.CD-16-0778 (2017). [DOI] [PMC free article] [PubMed] [Google Scholar]
- 36.David J, Dominguez C, Hamilton D & Palena C The IL-8/IL-8R Axis: A Double Agent in Tumor Immune Resistance. Vaccines (Basel) 4, 22, doi:doi: 10.3390/vaccines4030022 (2016). [DOI] [PMC free article] [PubMed] [Google Scholar]
- 37.Culig Z et al. Switch from antagonist to agonist of the androgen receptor bicalutamide is associated with prostate tumour progression in a new model system. Br J Cancer 81, 242–251, doi: 10.1038/sj.bjc.6690684 (1999). [DOI] [PMC free article] [PubMed] [Google Scholar]
- 38.Rao V et al. A Hoxb13-driven reverse tetracycline transactivator system for conditional gene expression in the prostate. Prostate 72, 1045–1051, doi: 10.1002/pros.22490 (2012). [DOI] [PMC free article] [PubMed] [Google Scholar]
- 39.Wang X et al. A luminal epithelial stem cell that is a cell of origin for prostate cancer. Nature 461, 495–500, doi: 10.1038/nature08361 (2009). [DOI] [PMC free article] [PubMed] [Google Scholar]
- 40.Lopez-Bujanda ZA, et al. TGM4: an immunogenic prostate-restricted antigen. Journal for ImmunoTherapy of Cancer, InPress (2021). [DOI] [PMC free article] [PubMed]
- 41.Altschul SF et al. Protein database searches using compositionally adjusted substitution matrices. Febs J 272, 5101–5109, doi: 10.1111/j.1742-4658.2005.04945.x (2005). [DOI] [PMC free article] [PubMed] [Google Scholar]
- 42.Pevsner J Bioinformatics and functional genomics (John Wiley & Sons, 2015). [Google Scholar]
- 43.Malinen M, Niskanen EA, Kaikkonen MU & Palvimo JJ Crosstalk between androgen and pro-inflammatory signaling remodels androgen receptor and NF-kappaB cistrome to reprogram the prostate cancer cell transcriptome. Nucleic Acids Res 45, 619–630, doi: 10.1093/nar/gkw855 (2017). [DOI] [PMC free article] [PubMed] [Google Scholar]
- 44.Robinson JT et al. Integrative genomics viewer. Nat Biotechnol 29, 24–26, doi: 10.1038/nbt.1754 (2011). [DOI] [PMC free article] [PubMed] [Google Scholar]
- 45.Asangani IA et al. Therapeutic targeting of BET bromodomain proteins in castration-resistant prostate cancer. Nature 510, 278–282, doi: 10.1038/nature13229 (2014). [DOI] [PMC free article] [PubMed] [Google Scholar]
- 46.Pomerantz MM et al. The androgen receptor cistrome is extensively reprogrammed in human prostate tumorigenesis. Nat Genet 47, 1346–1351, doi: 10.1038/ng.3419 (2015). [DOI] [PMC free article] [PubMed] [Google Scholar]
- 47.Haffner MC et al. Androgen-induced TOP2B-mediated double-strand breaks and prostate cancer gene rearrangements. Nat Genet 42, 668–675, doi: 10.1038/ng.613 (2010). [DOI] [PMC free article] [PubMed] [Google Scholar]
- 48.Carlson AL et al. Tracking Single Cells in Live Animals Using a Photoconvertible Near-Infrared Cell Membrane Label. Plos One 8, doi: 10.1371/journal.pone.0069257 (2013). [DOI] [PMC free article] [PubMed] [Google Scholar]
Associated Data
This section collects any data citations, data availability statements, or supplementary materials included in this article.
Supplementary Materials
Data Availability Statement
Microarray data from this study have been deposited in the Gene Expression Omnibus (GEO) under accession code GSE171491. Previously published microarray data ChIP-seq data that were re-analyzed here are available under accession codes GSE8466, GSE56288, GSE83860, and GSE55064. Source data for this study have been provided as Source Data files. All other data supporting the findings of this study are available from the corresponding author upon reasonable request.