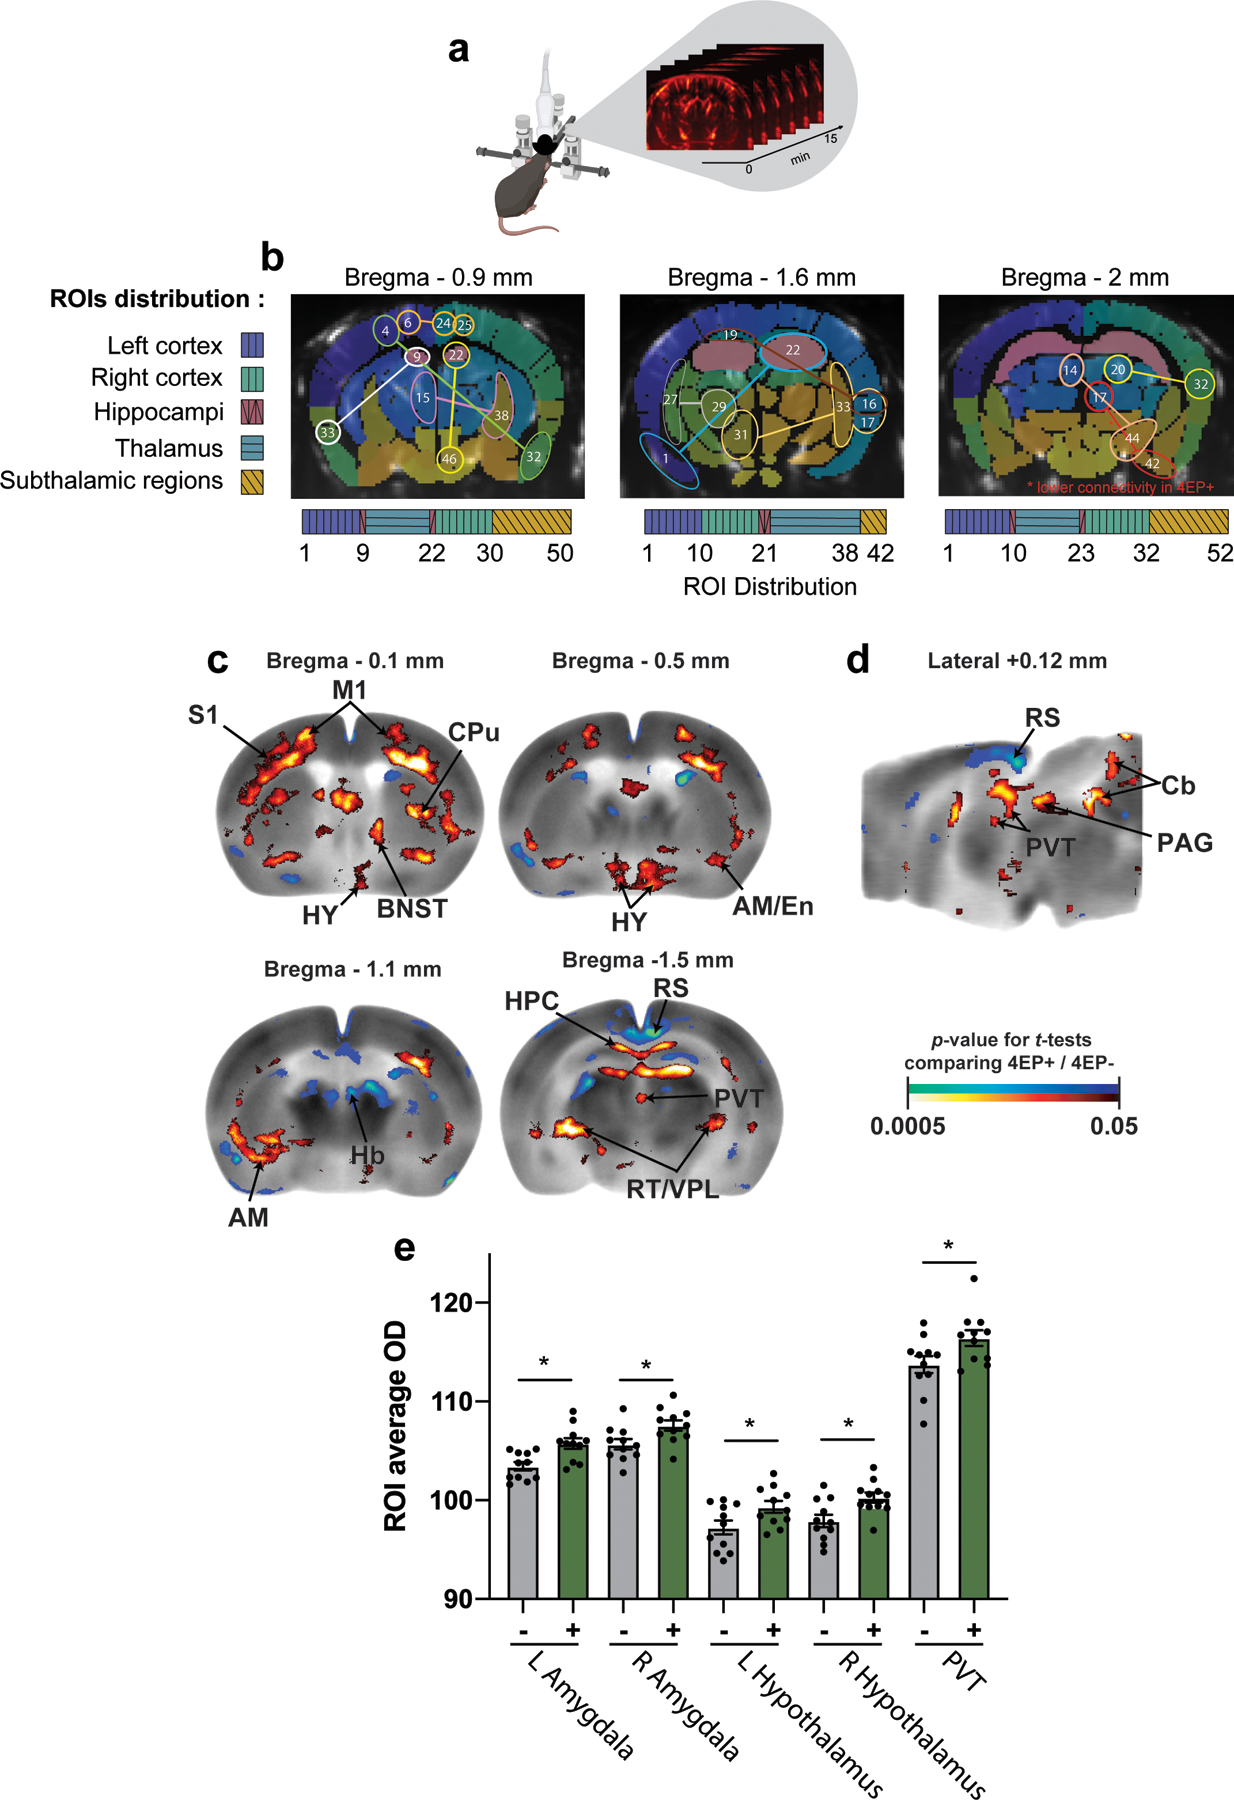
Extended Data Fig. 4. Extended information on functional connectivity experiments fUSi and autoradiography.

a, Schematic representation of the functional ultrasound (fUSi) set-up. Functional acquisitions are acquired non-invasively through intact skull and scalp in anesthetized mice during 15 minutes per coronal plane. Created with BioRender.com. b, Maps overlaid with regions of interest colored in a gradient for easier visualization. Significant pairs are indicated, corresponding to the data in main Fig. 2b. Three coronal planes per mouse were studied: Bregma −0.9 mm, Bregma −1.6 mm, Bregma −2mm. 50, 52 and 52 ROIS are respectively delineated for each plane according the Paxinos Atlas. Coronal plane B-0.9mm: ROIs #1 to #8 are located in the left cortex, ROI#9 is the left hippocampus, ROIs#11 to #21 are located in the thalamus, ROI#22 is the right hippocampus, ROIs#23 to #30 are located in the right cortex and finally ROIs#31 to #48 are subthalamic regions. Coronal plane B-1.6mm: ROIs #1 to #20 are located in the cortex, ROIs#21 #22 are the left and right hippocampi, ROIs#23 to #38 are located in the thalamus and ROIs#39 to #42 are subthalamic regions. Coronal plane B-2mm: ROIs #1 to #9 are located in the left cortex, ROI#10 is the left hippocampus, ROIs#11 to #22 are located in the thalamus, ROI#23 is the right hippocampus, ROIs#24 to #32 are located in the right cortex and finally ROIs#33 to #50 are subthalamic regions. c-d, Color-coded overlays over representative coronal (c) and sagittal (d) sections of the mouse brain template showing significant differences in regional cerebral glucose uptake following open field exposure in 4EP+ mice compared to 4EP- mice (n=11) (t-test, p ≤ 0.05, extent threshold > 200 contiguous voxels, with both conditions met to be deemed significant; red/blue: increase/decrease in glucose uptake in 4EP+ compared to 4EP- mice). e, Quantitated 2DG-uptake by region of interest, including the amygdala, hypothalamus and PVT, confirming changes in relative 2DG uptake in the open field groups (n=11 each group) From left to right, p=0.01; 0.03; 0.02; 0.009; 0.003). Average optical density of each ROI in each animal was normalized to whole-brain average of that animal. Abbreviations: AM, amygdala; HY, hypothalamus; PVT, paraventricular nucleus of the thalamus; BNST, bed nucleus of the stria terminalis; S1, primary somatosensory cortex; CPu, caudate putamen; Hb, habenular nucleus; RT, reticular nucleus of the thalamus; VPL/VPM, Posterior Lateral/Ventral Posterior Medial Thalamus; R, right; L, left. Two cohorts of mice from multiple litters were used for each experiment in this figure. Panel e was analyzed by one-way ANOVA with multiple comparison correction and two-stage linear step-up procedure of Benjamini, Krieger and Yekutieli. * p ≤ 0.05.
