. 2022 May 25;11:e78110. doi: 10.7554/eLife.78110

Figure 5. Sugar and water gustatory receptor neurons (GRNs) do not activate each other.

(A, B) Calcium responses of sugar GRNs expressing P2X2 and GCaMP6s to proboscis presentation of PEG as a negative control, ATP to activate P2X2, or sucrose as a positive control. GCaMP6s fluorescence traces (ΔF/F) (A) and maximum ΔF/F post-stimulus presentation (B), n = 5. Sugar GRNs responded to ATP, but the response to subsequent sucrose presentation was attenuated. (C, D) GCaMP6s responses of sugar GRNs in flies expressing P2X2 in water GRNs to PEG, ATP, and sucrose delivery, ΔF/F traces (C), and maximum ΔF/F graph (D), n = 11. (E, F) ArcLight responses of sugar GRNs in flies expressing P2X2 in water GRNs, ΔF/F traces (E), and maximum ΔF/F graph (F), n = 6. (G, H) Calcium responses of water GRNs expressing P2X2 and GCaMP6s to proboscis delivery of PEG (negative control), ATP, and water (positive control), ΔF/F traces (G), and maximum ΔF/F graph (H), n = 5. Water GRNs responded to ATP presentation, but the subsequent response to water was diminished. (I, J) GCaMP6s responses of water GRNs in flies expressing P2X2 in sugar GRNs to PEG, ATP, and water, ΔF/F traces (I), and maximum ΔF/F graph (J), n = 6. (K, L) ArcLight responses of water GRNs in flies expressing P2X2 in sugar GRNs to PEG, ATP, and water, ΔF/F traces (K), and maximum ΔF/F graph (L), n = 9. For all traces, stimulus presentation is indicated by shaded bars. Traces of individual flies to the first of three taste stimulations (shown in Figure 5—figure supplement 2, Figure 5—figure supplement 3, and Figure 5—figure supplement 7) are shown in gray, the average in black, with the SEM indicated by the gray shaded area. Repeated-measures ANOVA with Tukey’s multiple-comparisons test, *p<0.05, **p<0.01, ***p<0.001.

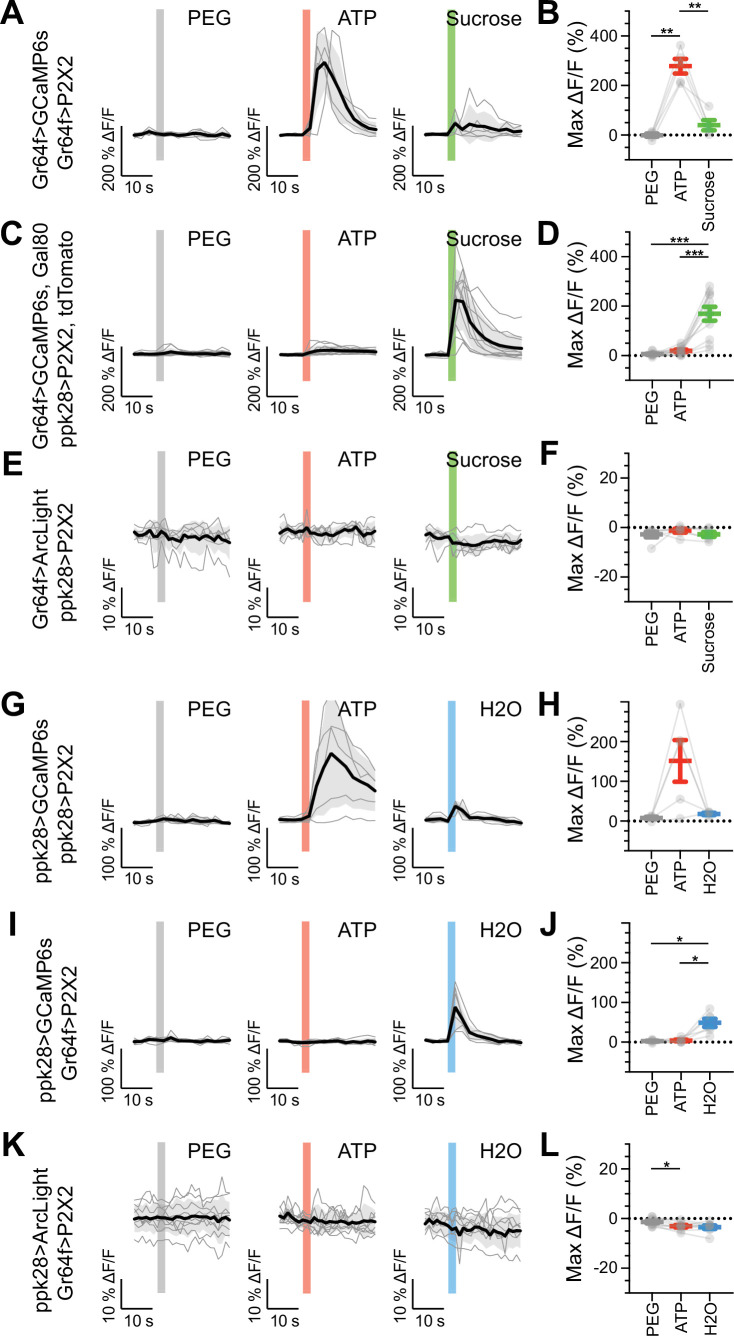
Figure 5.

Figure 5—figure supplement 1. Bitter gustatory receptor neurons (GRNs) do not respond to the activation of other GRN classes in fed flies.

Figure 5—figure supplement 1.

(A, B) Calcium responses of bitter GRNs expressing GCaMP6s in a UAS-P2X2 background to proboscis presentation of PEG as a negative control, ATP, or a mixture of denatonium and caffeine, which are bitter compounds, as a positive control, GCaMP6s ΔF/F traces (A), and maximum ΔF/F graph (B), n = 5. (C, D) Calcium responses of bitter GRNs expressing GCaMP6s and P2X2 to PEG, ATP, or bitter delivery, ΔF/F traces (C), and maximum ΔF/F graph (D), n = 5. (E, F) GCaMP6s responses of bitter GRNs in flies expressing P2X2 in sugar GRNs to PEG, ATP, and bitter, ΔF/F traces (E), and maximum ΔF/F graph (F), n = 6. (G, H) GCaMP6s responses of bitter GRNs in flies expressing P2X2 in water GRNs to delivery of PEG, ATP, or bitter to the proboscis, ΔF/F traces (G), and maximum ΔF/F graph (H), n = 9. Period of stimulus presentation is indicated by shaded bars, three stimulations/fly. Traces of individual flies are shown in gray, the average in black, with the SEM indicated by the gray shaded area. Repeated-measures ANOVA with Tukey’s multiple-comparisons test, *p<0.05, **p<0.01.
Figure 5—figure supplement 2. Sugar gustatory receptor neurons (GRNs) do not respond to the activation of other GRN classes in fed flies.

Figure 5—figure supplement 2.

(A, B) Calcium responses of sugar GRNs expressing GCaMP6s in a UAS-P2X2 background to proboscis presentation of PEG as a negative control, ATP, or sucrose as a positive control, GCaMP6s ΔF/F traces (A), and maximum ΔF/F graph (B), n = 6. (C, D) Calcium responses of sugar GRNs expressing GCaMP6s and P2X2 to PEG, ATP, or sucrose delivery, ΔF/F traces (C), and maximum ΔF/F graph (D), n = 5. (E, F) GCaMP6s responses of sugar GRNs in flies expressing P2X2 in bitter GRNs to PEG, ATP, and sucrose, ΔF/F traces (E), and maximum ΔF/F graph (F), n = 6. (G, H) GCaMP6s responses of sugar GRNs in flies expressing P2X2 in water GRNs to PEG, ATP, or sucrose presentation, ΔF/F traces (G), and maximum ΔF/F graph (H), n = 7. (I, J) GCaMP6s responses of sugar GRNs in flies expressing P2X2 in water GRNs and Gal80 in sugar GRNs to inhibit P2X2 misexpression to PEG, ATP, or sucrose presentation, ΔF/F traces (I), and maximum ΔF/F plots (J), n = 11. Period of stimulus presentation is indicated by shaded bars, three stimulations/fly. Data from first stimulation of (C) and (K) is shown in Figure 4A–D. Traces of individual flies are shown in gray, the average in black, with the SEM indicated by the gray shaded area. Repeated-measures ANOVA with Tukey’s multiple-comparisons test, *p<0.05, **p<0.01, ***p<0.001.
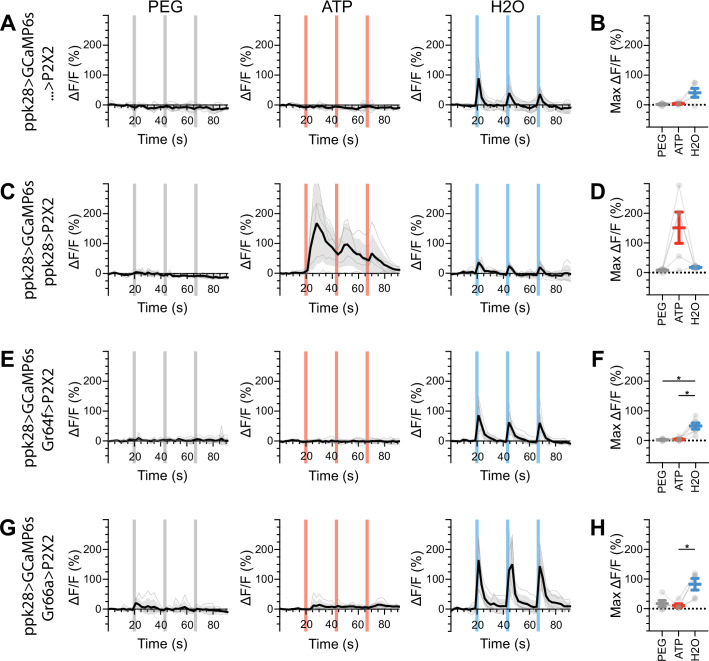
Figure 5—figure supplement 3. Water gustatory receptor neurons (GRNs) do not respond to the activation of other GRN classes in fed flies.

Figure 5—figure supplement 3.

(A, B) Calcium responses of water GRNs expressing GCaMP6s in a UAS-P2X2 background to proboscis presentation of PEG as a negative control, ATP, or water as a positive control, GCaMP6s ΔF/F traces (A), and maximum ΔF/F graph (B), n = 5. (C, D) Calcium responses of water GRNs expressing GCaMP6s and P2X2 to PEG, ATP, or water delivery, ΔF/F traces (C), and maximum ΔF/F graph (D), n = 5. (E, F) GCaMP6s responses of water GRNs in flies expressing P2X2 in sugar GRNs to PEG, ATP, and water, ΔF/F traces (E), and maximum ΔF/F graph (F), n = 6. (G, H) GCaMP6s responses of water GRNs in flies expressing P2X2 in bitter GRNs upon PEG, ATP, or water presentation, ΔF/F traces (G), and maximum ΔF/F graph (H), n = 5. Period of stimulus presentation is indicated by shaded bars, three stimulations/fly. The first response in (C) and (E) is shown in Figure 4G–J. Traces of individual flies are shown in gray, the average in black, with the SEM indicated by the gray shaded area. Repeated-measures ANOVA with Tukey’s multiple-comparisons test, *p<0.05.
Figure 5—figure supplement 4. Bitter gustatory receptor neurons (GRNs) do not respond to the activation of other GRN classes in food-deprived flies.

Figure 5—figure supplement 4.

(A, B) Calcium responses of bitter GRNs expressing GCaMP6s in a UAS-P2X2 background to proboscis presentation of PEG as a negative control, ATP, or a mixture of the bitter compounds denatonium and caffeine as a positive control, GCaMP6s ΔF/F traces (A), and maximum ΔF/F graph (B), n = 6. (C, D) Calcium responses of bitter GRNs expressing GCaMP6s and P2X2 to PEG, ATP, or bitter delivery, ΔF/F traces (C), and maximum ΔF/F graph (D), n = 5. (E, F) GCaMP6s responses of bitter GRNs in flies expressing P2X2 in sugar GRNs to PEG, ATP, and bitter, ΔF/F traces (E), and maximum ΔF/F graph (F), n = 6. (G, H) GCaMP6s responses of bitter GRNs in flies expressing P2X2 in water GRNs to delivery of PEG, ATP, or bitter, ΔF/F traces (G), and maximum ΔF/F graph (H), n = 5. Period of stimulus presentation is indicated by shaded bars, three stimulations/fly. Flies were food-deprived for 23–26 hr. Traces of individual flies are shown in gray, the average in black, with the SEM indicated by the gray shaded area. Repeated-measures ANOVA with Tukey’s multiple-comparisons test, *p<0.05, **p<0.01, ***p<0.001.
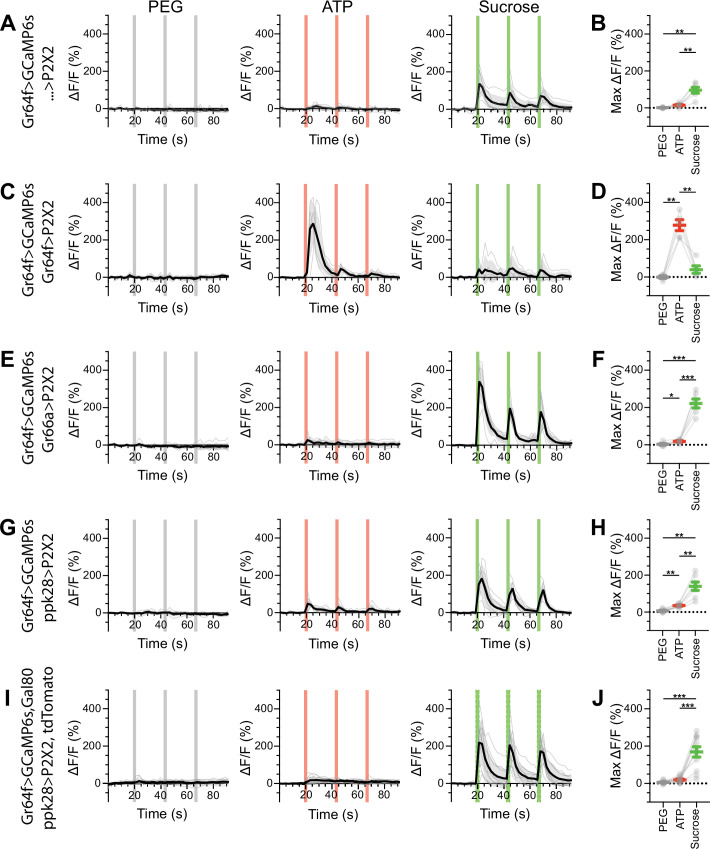
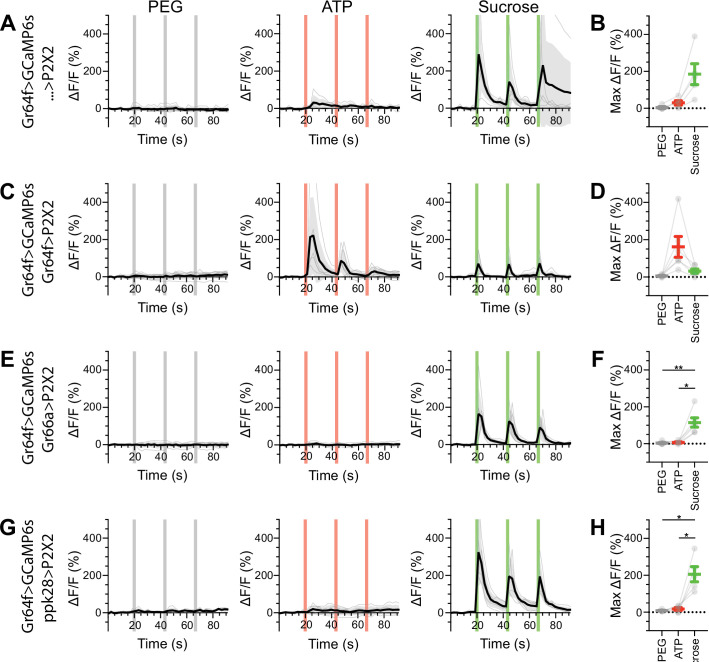
Figure 5—figure supplement 5. Sugar gustatory receptor neurons (GRNs) do not respond to the activation of other GRN classes in food-deprived flies.

Figure 5—figure supplement 5.

(A, B) Calcium responses of sugar GRNs expressing GCaMP6s in a UAS-P2X2 background to proboscis presentation of PEG as a negative control, ATP, or sucrose as a positive control, GCaMP6s ΔF/F traces (A), and maximum ΔF/F graph (B), n = 5. (C, D) Calcium responses of sugar GRNs expressing GCaMP6s and P2X2 to PEG, ATP, or sucrose delivery, ΔF/F traces (C), and maximum ΔF/F graph (D), n = 6. (E, F) GCaMP6s responses of sugar GRNs in flies expressing P2X2 in bitter GRNs to PEG, ATP, and sucrose, ΔF/F traces (E), and maximum ΔF/F graph (F), n = 6. (G, H) GCaMP6s responses of sugar GRNs in flies expressing P2X2 in water GRNs to PEG, ATP, and sucrose presentation to the proboscis, ΔF/F traces (G), and maximum ΔF/F graph (H), n = 5. Period of stimulus presentation is indicated by shaded bars, three stimulations/fly. Flies were food-deprived for 23–26 hr. Traces of individual flies are shown in gray, the average in black, with the SEM indicated by the gray shaded area. Repeated-measures ANOVA with Tukey’s multiple-comparisons test, *p<0.05, **p<0.01.
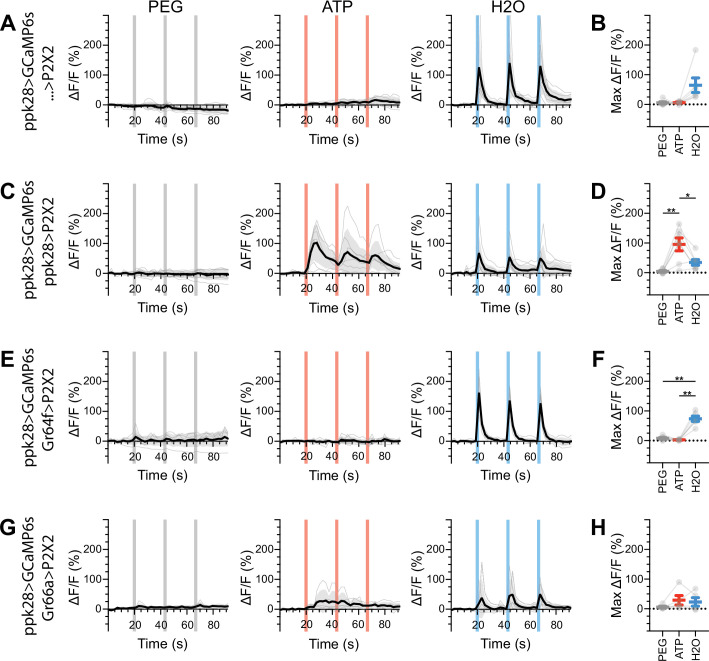
Figure 5—figure supplement 6. Water gustatory receptor neurons (GRNs) do not respond to the activation of other GRN classes in food-deprived flies.

Figure 5—figure supplement 6.

(A, B) Calcium responses of water GRNs expressing GCaMP6s in a UAS-P2X2 background to proboscis presentation of PEG as a negative control, ATP, or water as a positive control, GCaMP6s ΔF/F traces (A), and maximum ΔF/F graph (B), n = 6. (C, D) Calcium responses of water GRNs expressing GCaMP6s and P2X2 to PEG, ATP, or water delivery, ΔF/F traces (C), and maximum ΔF/F graph (D), n = 7. (E, F) GCaMP6s responses of water GRNs in flies expressing P2X2 in sugar GRNs to PEG, ATP, and water, ΔF/F traces (E), and maximum ΔF/F graph (F), n = 6. (G, H) GCaMP6s responses of water GRNs in flies expressing P2X2 in bitter GRNs to PEG, ATP, and water delivery, ΔF/F traces (G), and maximum ΔF/F graph (H), n = 5. Period of stimulus presentation is indicated by shaded bars, three stimulations/fly. Flies were food-deprived for 23–26 hr. Traces of individual flies are shown in gray, the average in black, with the SEM indicated by the gray shaded area. Repeated-measures ANOVA with Tukey’s multiple-comparisons test, *p<0.05, **p<0.01.
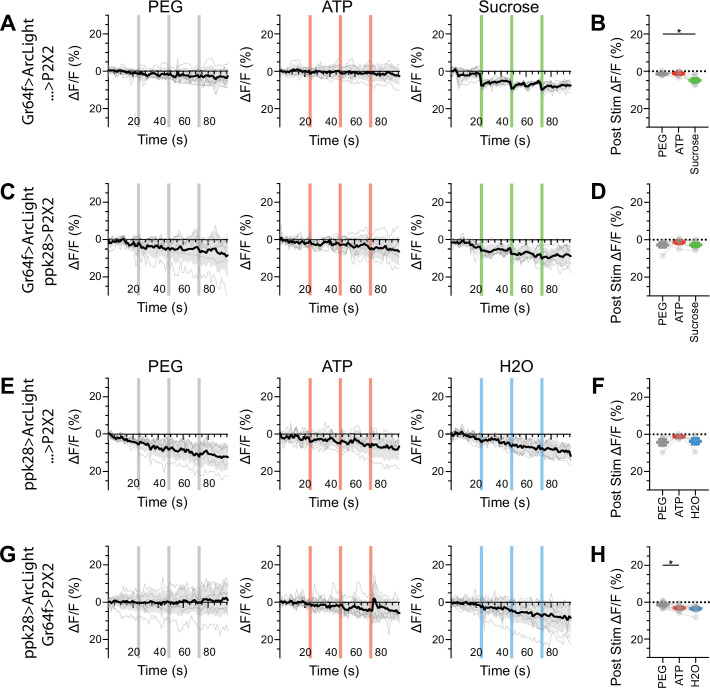
Figure 5—figure supplement 7. Sugar and water gustatory receptor neurons (GRNs) do not show voltage responses upon reciprocal activation.

Figure 5—figure supplement 7.

(A, B) ArcLight responses of sugar GRNs in a UAS-P2X2 background to proboscis presentation of PEG as a negative control, ATP, or sucrose as a positive control. ArcLight fluorescence traces (ΔF/F) (A), and maximum ΔF/F post stimulus presentation (B), n = 6. (C, D) ArcLight responses of sugar GRNs in flies expressing P2X2 in water GRNs to PEG, ATP, and sucrose delivery, ΔF/F traces (C), and maximum ΔF/F graph (D), n = 6. (E, F) ArcLight responses of water GRNs in a UAS-P2X2 background to proboscis delivery of PEG, ATP, and water (positive control), ΔF/F traces (E), and maximum ΔF/F graph (F), n = 5. (G, H) ArcLight responses of water GRNs in flies expressing P2X2 in sugar GRNs to PEG, ATP, and water delivery, ΔF/F traces (G), and maximum ΔF/F graph (H), n = 9. Period of stimulus presentation is indicated by shaded bars, three stimulations/fly. The first response in (C) and (G) is shown in Figures 24. Traces of individual flies to three taste stimulations are shown in gray, the average in black, with the SEM indicated by the gray shaded area. Repeated-measures ANOVA with Tukey’s multiple-comparisons test, *P<0.05.