Abstract
Background:
Open-heart surgeries for coronary arterial bypass graft and valve replacements are performed on 400,000 Americans each year. Unexplained hypotension during recovery causes morbidity and mortality through cerebral, kidney and coronary hypoperfusion. An early detection method that distinguishes between hypovolemia and decreased myocardial function prior to onset of hypotension, is desirable. We hypothesized that admittance measured from a modified pericardial drain can detect changes in left ventricular end-systolic, end-diastolic, and stroke volumes.
Methods:
Admittance was measured from two modified pericardial drains placed in N=7 adult female dogs using an open-chest preparation, each with eight electrodes The resistive and capacitive components of the measured admittance signal were used to distinguish blood and muscle components. Admittance measurements were taken from twelve electrode configurations in each experiment. Left ventricular preload was reduced by inferior vena cava occlusion. Physiological response to vena cava occlusion was measured by aortic pressure, aortic flow, left ventricle diameter, left ventricular wall thickness, and the electrocardiogram.
Results:
Admittance successfully detected a drop in left ventricular end diastolic volume (p<0.001), end systolic volume (p<0.001), and stroke volume (p<0.001). Measured left ventricular muscle resistance correlates with crystal derived left ventricular wall thickness (R2=0.96), validating the method’s ability to distinguish blood from muscle components.
Conclusions:
Admittance measured from chest tubes can detect changes in left ventricular endsystolic, end-diastolic, and stroke volumes, and may therefore have diagnostic value for unexplained hypotension.
Graphical Abstract
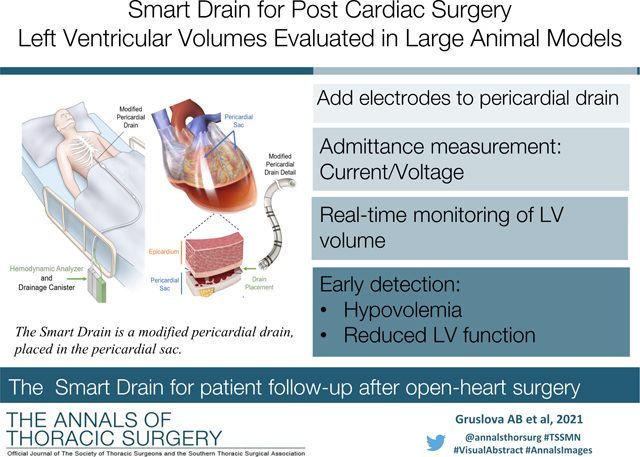
Hypotension following major cardiac surgery is a major cause of morbidity whose causes are challenging to diagnose. Left ventricular (LV) volume status provides valuable diagnostic information as it can distinguish between hypovolemia and myocardial contractile dysfunction. However, constant volume monitoring by echocardiography is impractical in most clinical settings. Use of pulmonary artery catheters as a surrogate for LV filling pressure has gained popularity, but their efficacy has been called into question [1–4]. Therefore, a reliable continuous method to measure LV volumes in patients recovering from cardiac surgery is needed to reduce morbidity in patients recovering from cardiac surgery.
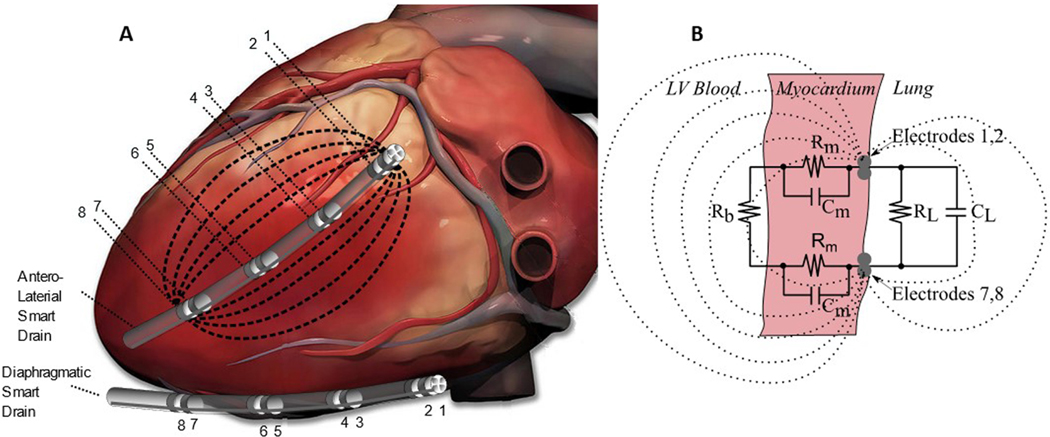
Pericardial drains are temporarily fitted as standard clinical practice in the cardiothoracic intensive care unit in patients recovering from open heart surgery to clear effusion. We propose that a “Smart Drain” using blood volume measurements taken from outside of the heart via pericardial drains could measure LV volumetric status in real time (Figure 1). This system would provide an real-time measurement of blood volume without the need for cardiac imaging or additional instrumentation such as measurement catheters. A real-time LV volume measurement would enable rapid diagnosis and treatment - volume administration for hypovolemia as indicated by reduced end diastolic volume (EDV); inotropic support in the case of myocardial dysfunction indicated by reduced stroke volume (SV) and increased end systolic volume (ESV); or pressor support for increased SV implying reduced systemic vascular resistance.
Figure 1.
Electrical current flowing between electrodes 1 and 8 of an antero-lateral smart drain. A) The Smart Drain with multiple electrode pairs placed for different sensitivity regions. A vector uses four electrodes in a tetrapolar measurement (two current and two voltage). Cardiac image derived from https://iheartanatomy.wordpress.com/. B) Equivalent electrical circuit diagram showing current passes through blood (Rb), myocardium (Rm and Cm), and lung (RL and CL).
Admittance blood volume measurements have the potential to measure LV volume from outside of the heart. Intracardiac admittance (Gb) blood volume measurements have previously been extensively validated against 3D Echo in humans [5–14]. Based on our previous validation studies, we hypothesized that measured admittance from a modified pericardial drain, Gb, can be used to accurately detect changes in LV hemodynamics (SV, EDV and ESV).
Material and Methods
Admittance Method.
Admittance allows for the dynamic removal of unwanted myocardial resistance (Rm) and capacitance (Cm) that occurs in traditional conductance measurements [5], Figure 1B. The optimal frequency for measurement of cardiac blood volumes has been shown to be 20kHz [6]. At this frequency, the capacitive contribution from the myocardium can be measured, while blood contribution is purely resistive, allowing dynamic separation [8]. Further studies show that electrode fouling does not occur over short periods of recovery [9], and double-layer effects and dielectric artifact is substantially reduced with a tetrapolar electrode design [7]. Compared to traditional conductance measurements which use a single value for parallel structures, admittance exploits the differing electrical properties of blood (resistive) and myocardium (resistive and capacitive) to separate them in real-time [5–14]. This results in a signal that is less dependent on catheter position [8], has improved signal to noise ratio in the presence of series muscle conductance.
Experimental Protocol.
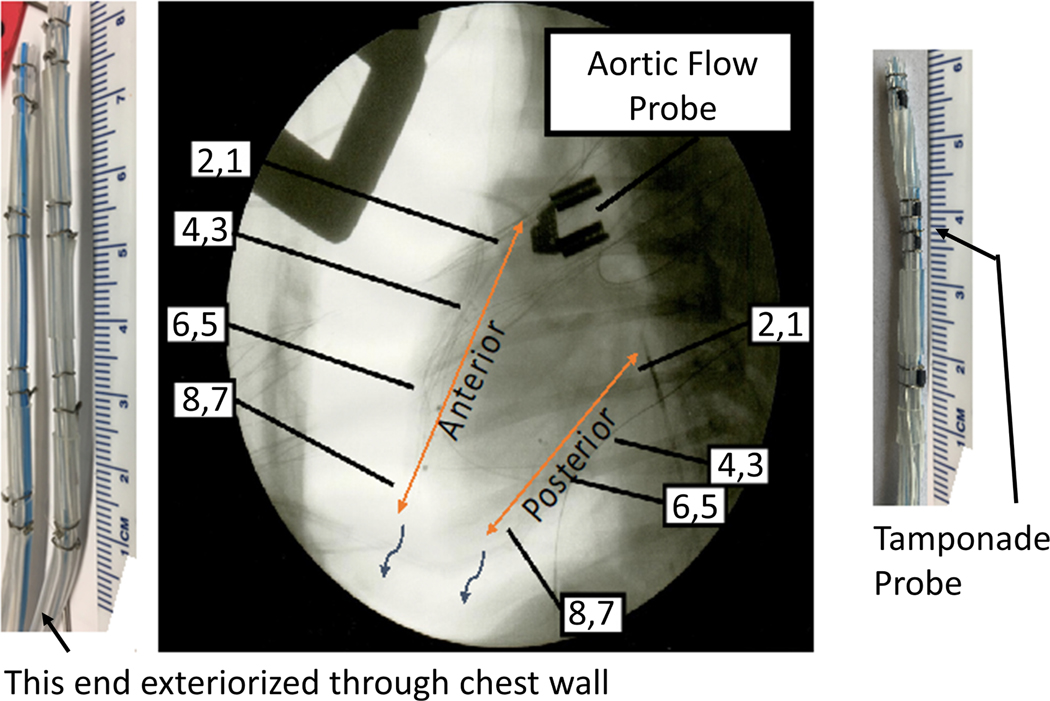
All experiments performed conform to the Guidelines for the Care and Use of Laboratory Animals established by the National Institutes of Health. All experiments were approved by the Institute for Animal Care and Use Committee at the UT Health at San Antonio, and care was provided in animal experiments in accordance with above guidelines. The study was performed using N=7 adult female canine subjects with an age of 3.2± 1.6 years and a weight of 27.2 ± 3.0 kg. One porcine subject was used for the tamponade study. All surgical procedures and data collection were performed with the subjects anesthetized via IV injection of 2–6 mg/kg Propofol and maintained on 1–3% Isoflurane in 100% Oxygen at 1–3 L/min. Paralytic agent was not used. Median sternotomy was performed to gain access to the heart, and the pericardial sac was opened as performed in coronary arterial bypass graft and valve replacement surgery. After completing the preparation procedures, including placement of the Smart Drains, the pericardium was reattached to envelop the heart and pericardial drain to simulate the recovery state in humans. The drains were not sutured in place, consistent with standard clinical practice, see Figure 2.
Figure 2.
Fluoroscopy showing two hand-built Smart rains, 8 electrodes each, in a canine pericardial sac. The tamponade probe has four electrodes 2 mm apart.
Volume Standards.
Two different standards were used to obtain left ventricle SV, EDV, and ESV in real-time: a flow probe and 1-dimensional endocardial ultrasonic crystals. An electromagnetic flow probe (Transonic Systems, NY, USA) was placed on the ascending thoracic aorta. A pair of sonometric crystals (Sonometrics Corp, London, ON, Canada) were implanted directly into the LV endocardium and were used to measure short axis LV diameter. LV volume as a prolate ellipsoid was calculated assuming the long axis was three times the measured short axis diameter. Since we used a paired-t test to determine statistically valid changes, the only assumption made was that the LV volume is proportional to the short axis diameter cubed. A second pair of sonometric crystals were placed in the LV wall from the epicardium to endocardium, measuring LV myocardial thickness. Aortic pressure was measured with a percutaneous pressure catheter,
Hypovolemic Shock Model.
Preload was reduced directly by partially occluding the blood return to the heart using a suture placed around the inferior vena cava for transient occlusion (IVCO) for about 60 seconds, then released to allow blood return to the heart. This method creates a state of low preload, and lower cardiac output. Decreased preload was confirmed with reduced aortic flow and central aortic pressures. Definition of successful IVCO was a mean arterial pressure of 50mmHg or less.
Instrumentation.
Constant current at 20kHz 100μA (root means squared) is delivered to the outer two electrodes of a tetrapolar measurement array on the chest tube (e.g., 1, 8 in Figure 1). The 100μA amplitude is much lower than the depolarization threshold for myocardium at 20kHz [16]. The two voltage electrodes (e.g., 2, 7 as an example in Figure 2) are connected to an instrumentation amplifier. Complex impedance (Z = ReZ + j*ImZ) is calculated as the ratio of resulting voltage divided by applied current, where j is the √(−1), ReZ is the real part of Z, and ImZ is the imaginary part of Z. Each tube has eight electrodes, giving six possible sets of tetrapolar configurations (1–2-3–4, 1–2-5–6, 1–2-7–8, 3–4-5–6, 3–4-7–8, and 5–6-7–8). To make measurements from multiple sets of tetrapolar electrodes, the multichannel admittance system cycles between the electrode sets every 1ms (four electrodes per admittance channel) and records the admittance measurements. Four independent admittance measurements can be made at 250 Hz.
Choice of Electrodes.
The sensitivity region for admittance measurements is strongly dependent on the position of the four electrodes. If electrodes 1–2-7–8 are selected as in Figure 1, the measurement is sensitive to the electrical properties of the region between 1–2 and 7–8. Electrodes that are closer together are more sensitive to impedance changes closer to the electrodes. Conversely, larger electrode spacing will cause the electric field to penetrate through the myocardium and farther into the LV blood chamber. The system can automatically cycle through electrode sets. At the time of implantation, the choice of which electrodes to use for the measurement of SV, EDV, and ESV can be made automatically by software. In this study, one tube was placed antero-laterally near the left anterior descending artery (LAD) and another along the diaphragm (Figures 1 and 2). Surgeons place tubes so they function as drains. Clearly, the tube will not be placed near the bypass grafts. Fundamentally, the smart drain measures ventricular blood volume adjacent to the electrodes. For example, if the drain is placed on the diaphragmatic surface, it will measure LV volume. If the drain is placed near the left anterior descending artery, it will measure blood volume near LV lateral wall. If the drain is placed over the anterior RV, it will measure RV volume.
Inclusion Criteria.
Signal to noise ratio and synchronization to electrocardiogram (ECG) are used as a criterion to select which electrode configuration to use. The admittance, Gb (mS), should increase with LV volume. A data set was included if 1) the Gb signal is synchronized to the ECG for both baseline and IVCO; and 2) the synchronization was successfully repeated across three IVCO events.
Admittance Measurement of Blood Volume:
Admittance measurement of blood volumes have been described and validated extensively in previous publications. Briefly, with chest tubes located exterior to the heart, the electrical field enters the myocardium, travels through the ventricular blood pool, and then returns across the myocardium (Fig. 1). Hence, a series model is appropriate for describing the behavior of the current (Fig. 1B). At f=20kHz frequency, myocardium has a resistance (Rm) and a capacitance (Cm), while blood has a resistance only (Rb). The admittance method takes advantage of the fact that myocardial resistance is related to myocardial capacitance according to [6]:
where σ is the muscle conductivity and ε is the muscle relative permittivity. The σ/ε ratio is a constant property of muscle tissue, and we used 800000s−1 in this study [6]. At f=20kHz, we calculate a dimensionless constant:
Since all data were collected at end expiration, the properties of the lung (RL and CL) can be neglected. The total complex impedance Z of this circuit may be written:
The admittance method removes the effect of muscle by this simple equation:
Systolic and diastolic data were calculated using the 10% and 90% percentile of the measurements during each cardiac cycle. The method also allows estimation of muscle resistance:
Using this model, conductance of blood, , should be proportional to left ventricular blood volume, and Rm should be proportional to myocardial thickness.
Admittance Detection of Tamponade:
The dotted lines in Figure 1A illustrate the current paths of the admittance method if electrodes 1–2-7–8 are used. Basically, the measurement is sensitive to the electrical properties of the spherically shaped region between the two current electrodes. Therefore, a Smart Drain with four electrodes spaced 2 mm apart will be sensitive to the pericardial space and insensitive to the left ventricle. To study if we could detect tamponade, we used the modified drain shown on the right side of Figure 2, which has the 2 mm spacing on electrodes 3–4-5–6. We used a porcine model for this study because the porcine pericardium is stronger than the canine. Otherwise, the canine and porcine protocols were identical. We first took baseline measurements of admittance. Next, we injected 50 mL of blood into the pericardial space and measured admittance again. We then removed the blood. This baseline, 50-mL injection, measurement, and removal sequence was performed a total of three times. Lastly, a baseline, 100-mL injection, measurement, and removal sequence was performed also a total of three times.
Statistical Analysis.
For evaluation of the Smart Drain technique, we placed one tube in an anterolateral position and a second along the diaphragm. Each tube containing eight electrodes was connected to custom hardware capable of simultaneously recording SV, EDV, and ESV as measured by admittance together with gold-standard (invasive) aortic-flow probe measurement and ultrasound crystal derived LV volumes. Data represented in the graphs are shown as mean ± SE. Two-tail T test and one-way ANOVA were used for all comparisons. A value of p<0.05 was considered as statistically significant. The Pearson Correlation Coefficient was computed to test correlation between two variables.
Results
Expected Physiology.
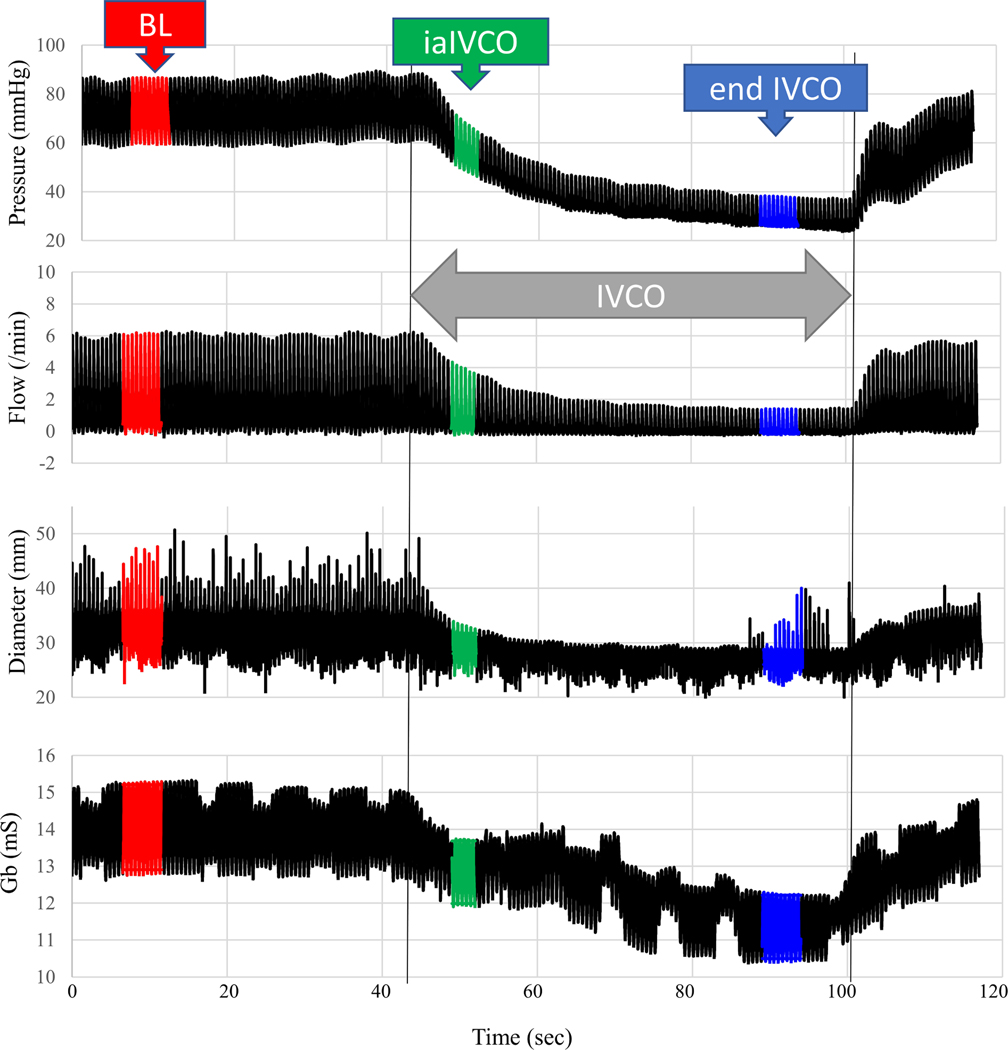
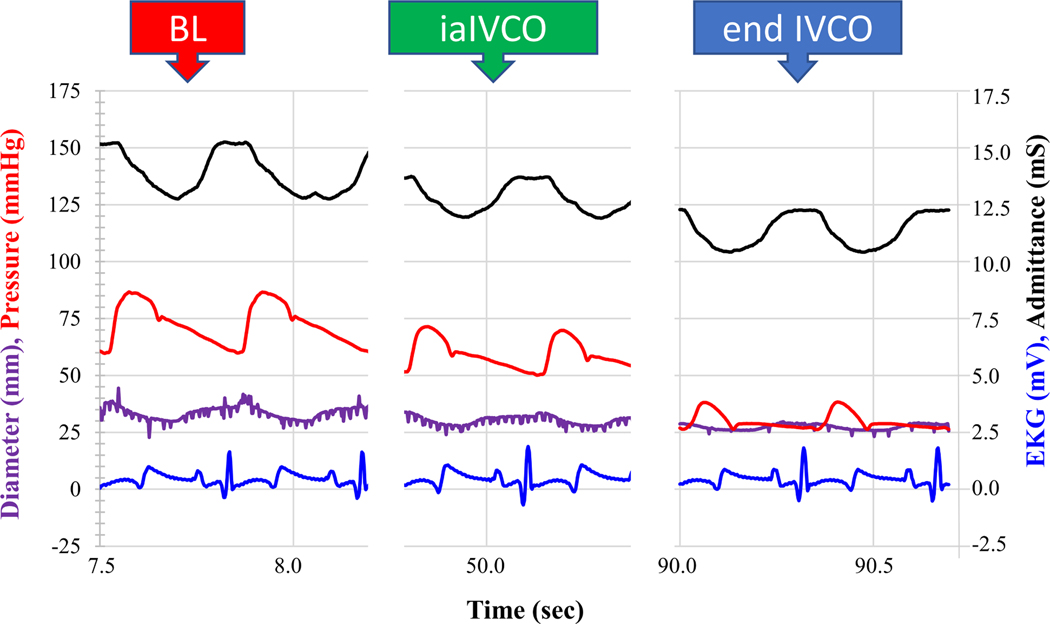
The physiological response of the heart was measured during an intermittent reduction of preload using the IVCO technique. Figure 3 shows a typical experimental result. Baseline data were first recorded at end expiration with the respirator off (red data in Figure 3). Occluding the IVC resulted in a drop in aortic pressure, aortic flow, and LV diameter. The LV muscle thickness increased with IVCO. These expected physiological responses occurred in all data sets. This run also showed a drop in admittance, Gb (mS). Data were recorded immediately after IVCO during expiration (green data in Figure 3). Data were also recorded at end expiration with the respirator off (blue data in Figure 3). Figure 4 shows typical individual beats at baseline, immediately after IVCO and at end IVCO.
Figure 3.
Physiological response to IVCO (double grey arrow). Red is baseline (BL), green is immediately after IVCO (iaIVCO), and blue is end IVCO.
Figure 4.
Physiological response to IVCO. Zoomed-in to show individual beats at baseline (BL), immediately after IVCO (iaIVCO), and end IVCO.
Admittance Results.
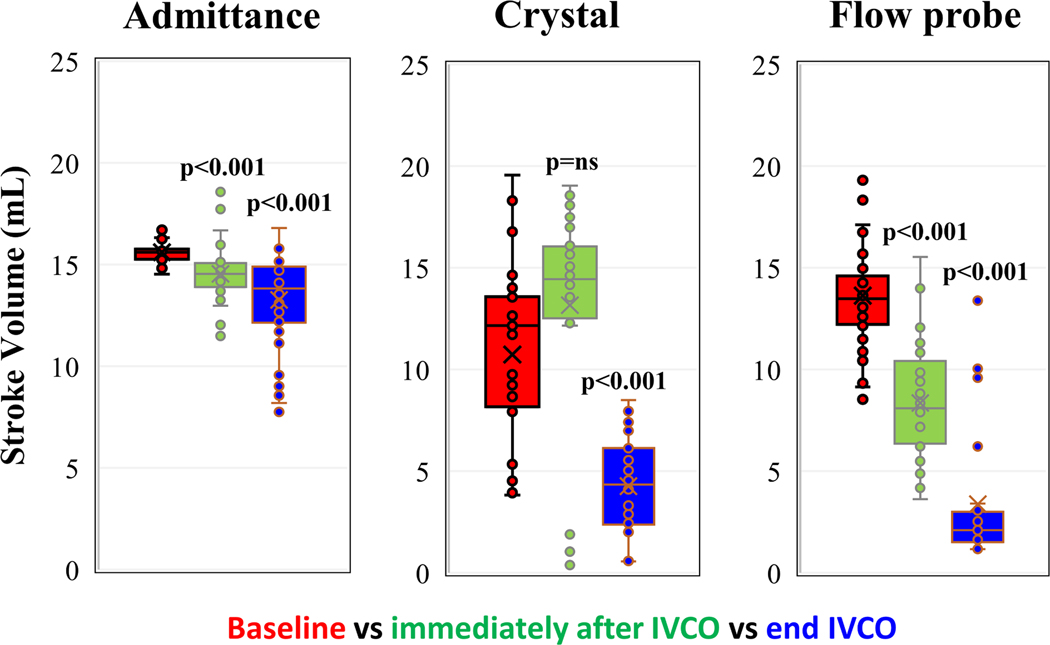
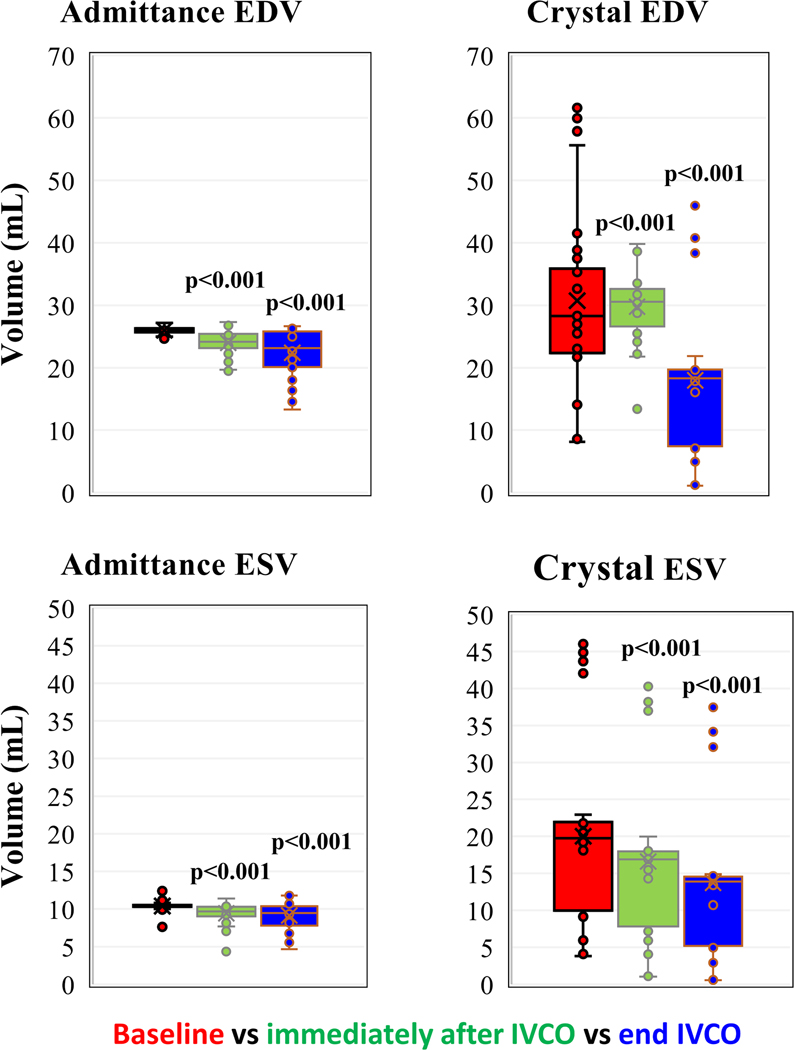
Synchrony and repeatability guaranteed proper contact during this open chest experiment. For each subject there were multiple measurement vectors that satisfied the inclusion criteria. In other words, a tetrapolar electrode configuration could always be found that could be used to measure LV volume. The green data in Figure 3 show the admittance response is immediate and tracks the change in LV diameter. The expected physiological response in measured Gb to these IVCO events is strongly correlated with measurements of LV volume as shown in Figure 5 and Figure 6 for both admittance Gb measured immediately after IVCO (iaIVCO) and at end of IVCO. Admittance successfully detected a drop in LV EDV (p<0.001), ESV (p<0.001), and SV (p<0.001). Removal of the IVCO resulted in restoration of baseline aortic pressure, aortic flow, LV diameter and Gb (Figure 3).
Figure 5.
SV measured with admittance, ultrasound crystal derived volume, and electromagnetic flow probe. p>0.05 is not significant (p=ns). Comparison with baseline, immediately after IVCO, and end IVCO. Paired-t test, N=7.
Figure 6.
EDV (above) and ESV (below) measured with admittance, and ultrasound crystal derived volume. Comparison with baseline, immediately after IVCO and end of IVCO. Paired-t test, N=7.
Admittance Detection of Tamponade:
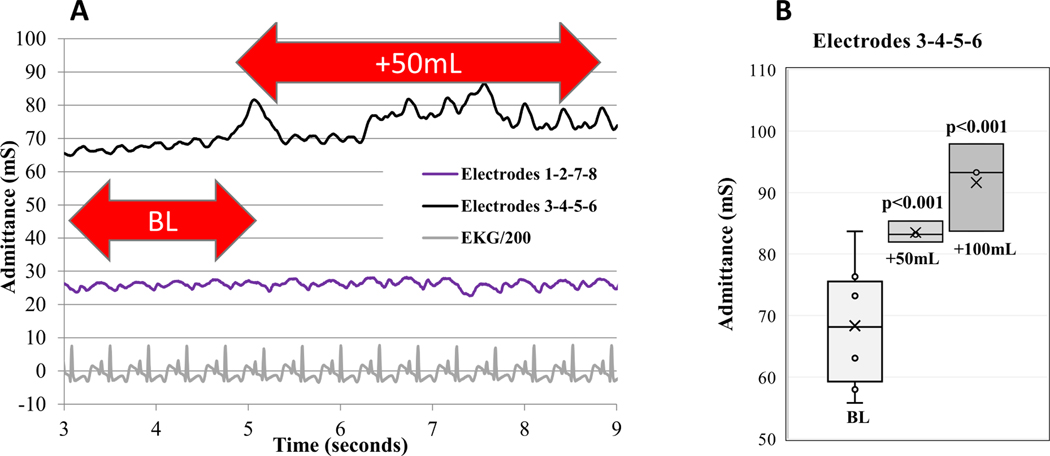
Figure 7A shows the admittance as a function of time during a 50-mL blood injection into the pericardial space. The data shows the Smart Drain with the 2mm spacing (3–4-5–6) is sensitive to tamponade and can detect both a 50 mL and a 100 mL injection of blood into the pericardial space (Figure 7B), N=3 (p<0.001). Smart Drains with the usual 40 mm spacing (1–2-7–8) are sensitive to LV blood but not pericardial blood.
Figure 7.
A) 50 mL blood injected at 5 sec. Admittance measured with electrodes 3–4-5–6 spaced 2 mm apart is sensitive to tamponade. Admittance measured with electrodes 1–2-7–8 spaced 40 mm apart is insensitive to tamponade. B) Paired-t test, N=3.
Myocardial Wall Thickness.
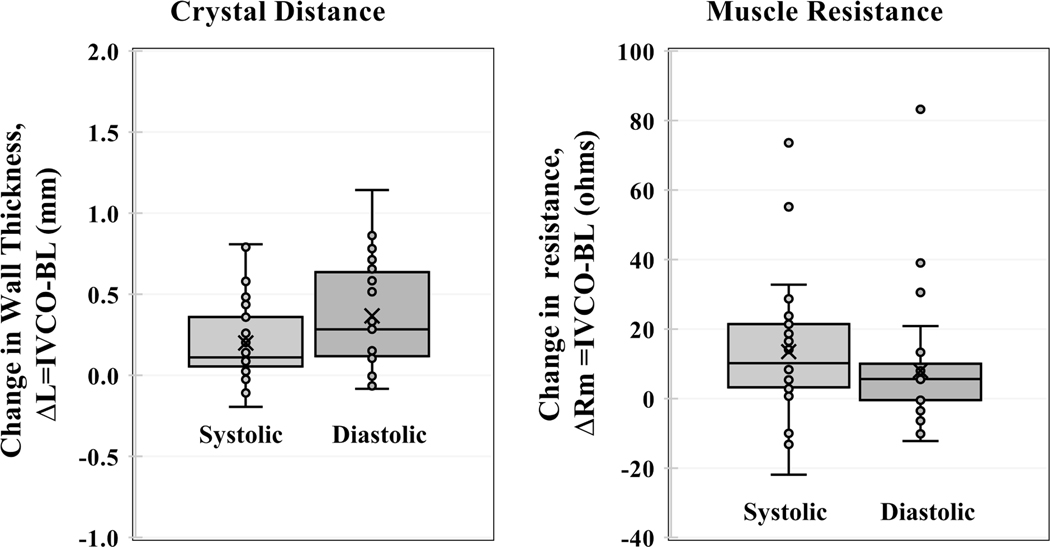
If the admittance method were correct, one would expect a linear relationship between resistance estimated by the admittance technique (Rm) and myocardial wall thickness measured with sonometric crystals. There were 29 measurements on four canine subjects where there were valid crystal wall thickness data for both baseline and IVCO conditions. In addition to detecting changes in LV volume, Figure 8 shows the Smart Drain system can also track real-time changes in LV wall thickness. Using paired-t analysis there was a significant increase in wall thickness with IVCO for both systolic (p < 0.001) and diastolic (p < 0.001) measurements (Figure 9).
Figure 8.
Muscle thickness, L, measured with crystals. Muscle resistance, Rm, estimated from the admittance measurements (N=29).
Figure 9.
Change in muscle thickness ΔL (N=29) and change in muscle resistance ΔRm (N=48) show increases from baseline to IVCO for both systole and diastole.
Comment
This study shows that both small and large reductions in EDV, ESV, and SV resulting from reduced venous return can be detected via admittance-based measures of left-ventricular blood volume. Furthermore, we have demonstrated a linear correlation between LV myocardial thickness and myocardial resistance, validating the assumptions underlying admittance-based measurement of ventricular volumes.
IVCO causes a dramatic change in cardiac function. For example, systolic pressures dropped from 80 mmHg to below 40 mmHg. It is clinically relevant to be able to detect more subtle changes in left ventricular hemodynamics. For this reason, we also observed the region immediately after IVCO, where the pressures dropped from 80 down to only 60–70 mmHg. All admittance measurements were significant for these early and small change in LV volumes. The error bars in Figures 4 and 5 are not noise in the admittance measurements, rather they are variability between subjects. Remember, each subject is its own control, meaning we are looking for changes in Gb related to that subject’s normal Gb. This normal Gb is recorded in each subject after the drain is inserted. When we observe Gb as a function of time during end expiration (Figure 3), we see admittance noise levels of less than 0.2 mS. We can map this Gb noise to volume noise by observing the diastolic Gb dropped from 15 to 12 mS (Figure 3), while the diastolic volume from 30 to 10 mL. Therefore, we can estimate the sensitivity to volume change to be 0.2mS*(30–10mL)/(15–12mS) = 1.3mL.
Admittance is an invasive measurement of LV volume, more accurate than non-invasive measures [5], without increasing risk from additional procedures beyond those performed in the operating room in routine care if a modified chest drain is installed. There has been a shift in postoperative care after open heart surgery to less invasive measurements. Therefore, getting important clinical data from catheters already in place is desirable. There are theoretical benefits to early and accurate diagnosis of the etiology for postoperative hypotension.
The major advantage of admittance over traditional blood-volume conductance measurements in this setting is that it can separate out the contributions of myocardium from the impedance signal. This advantage is particularly relevant in the setting of a pericardial chest tube, where the electrical field must cross the myocardium twice to reach the blood pool creating a significant myocardial contribution. The principle underlying the use of admittance to measure chamber blood volume is that current passes across the ventricular wall, through the blood in the LV cavity whose conductance is proportional to blood volume, and then back across the ventricular wall to the anode of the tetrapolar array, shown as dotted lines in Figure 1. Therefore, to use admittance to measure LV volume, it is important to properly model the electrical behavior of the LV wall. The admittance technique was validated by measuring myocardial thickness in real time using sonometric crystals. Figure 8 shows a strong correlation between estimated myocardial resistance (Rm) and measured LV wall thickness, which supports the validity of the method.
The ability to select between different electrode sets allows flexibility of drain placement, because different sensitivity levels exist for each of the tetrapolar electrode configurations, and sensitivity levels are likely to be influenced by patient anatomy and the nature of the surgical procedure. Depending on the size of the heart and the placement of the drain, one does not know a priori which configuration set should be used. The selection can be done automatically in software, using two criteria. First, the software will consider all the electrode sets that have Gb synchronized to ECG over multiple beats. Second, the software will select the electrode set with the largest diastolic/systolic difference in Gb (best signal to noise ratio). This selection occurs during initial placement, or it could be repeated if there were to be a shift in pericardial drain location.
The key innovation of the Smart Drain is the addition of admittance measurements to the standard pericardial drain, allowing for real-time monitoring of left ventricular volume without additional instrumentation. The admittance measurements demonstrate excellent sensitivity compared with volume standards. The Smart Drain system is real-time and can run continuously because it is an adaptation of a simple device (pericardial drain) that is routinely used in the intensive care unit post-surgical recovery.
Limitations
One limitation of the approach is user variation on placement of chest tubes [17]. To mitigate this risk, each Smart Drain has eight electrodes, which creates six sets of tetrapolar configurations (12–3-4, 1–2-5–6, 1–2-7–8, 3–4-5–6, 3–4-7–8, and 5–6-7–8). The software can automatically evaluate each configuration to see if it is properly synchronized to the ECG, and the software will pick the configuration with the best signal to noise ratio. In clinical practice, if none of the configurations are operational, the device can alert the user, and the user can choose to relocate the Smart Drain or abandon the measurement.
A limitation of our study design is that we only investigated hypovolemic shock, which resulted in a decrease in EDV, ESV, and SV. To be clinically useful, the device will need to be able to discriminate between hypovolemia and decreased myocardial function. However, since admittance is a function of physical dimensions of the LV and electrical properties of blood, we are confident that it will detect changes in EDV and ESV independently. For LV-electrode admittance measurements in mice [6–9], we increased cardiac function with drugs, and reduced cardiac function by IVCO or pacing. For RV-electrode admittance measurements in humans [10], we increased cardiac function with dobutamine, and reduced cardiac function by pacing. For RV-electrode admittance measurements in canines [12], we reduced cardiac function by overdrive pacing long term and created ventricular tachycardia and ventricular fibrillation arrythmias. In each case, we could independently detect changes in ESV and EDV. Future work should confirm that other clinically relevant hemodynamics states, such as increased EDV in the case of myocardial dysfunction, and increased SV in the case of reduced systemic vascular resistance, are also captured correctly.
It is possible for blood clots to form on the tube and cover the admittance electrodes. Luckily, clotted blood will not affect this four-electrode measurement. The outer two electrodes generate current (e.g., electrodes 1 and 8 in Figure 1), and the inner two electrodes measure voltage (e.g., electrodes 2 and 7 in Figure 1). The tetrapolar approach eliminates any electrical effects of blood clotting around the electrodes. There is a constant current source, so the current will remain the same even if clot forms on the electrodes, so the electric field in the LV will remain the same. No current flows into the voltage electrodes, so again the clot around the electrodes will not affect the measurement.
Another limitation is tamponade, since accumulation of fluid in the pericardial sac will cause an increase in admittance, mimicking an increase in LV volume. Tamponade can sometimes be diagnosed by observing the tube itself for blood. An additional pressure sensor located on the Smart Drain could be used to detect a rise in pericardial pressure indicative of tamponade. We also used the Smart Drain itself to detect tamponade. The data in Figure 7 demonstrate we can differentiate between changes in LV volume and increases in blood in the pericardial space.
The electrodes and wires are embedded into the drainage tubes and have the potential problem of blood clots. The eventual clinical device will need smooth exposed stainless-steel electrodes and will need the wires to be encased in the tube material itself.
Conclusions
A modified pericardial drain (the “Smart Drain”) that incorporates multiple electrodes can detect changes in left ventricular blood volume (EDV, ESV, and SV) directly from the admittance signal. This allows for discrimination between the possible causes of unexplained hypotension, namely low cardiac output (reduced SV), low contractility (high ESV, low SV), and low volume status (low EDV) states.
Acknowledgments
Source of funding: NIH (R01 HL118176–02)
Abbreviations
- Cm
myocardial capacitance
- ECG
electrocardiogram
- EDV
end diastolic volume
- ESV
end systolic volume
- Gb
Intracardiac admittance
- iaIVCO
immediately after inferior vena cava occlusion
- IVCO
inferior vena cava occlusion
- LAD
left anterior descending
- LV
left ventricular
- Rm
myocardial resistance
- SV
stroke volume
Footnotes
Conflict of interest statement: Dr. Jonathan Valvano has a financial interest in CardioVol LLC., which is developing this technology for commercial application.
Publisher's Disclaimer: This is a PDF file of an unedited manuscript that has been accepted for publication. As a service to our customers we are providing this early version of the manuscript. The manuscript will undergo copyediting, typesetting, and review of the resulting proof before it is published in its final form. Please note that during the production process errors may be discovered which could affect the content, and all legal disclaimers that apply to the journal pertain.
References
- [1].Montrief T, Koyfman A, Long B. Coronary artery bypass graft surgery complications: A review for emergency clinicians. The American Journal of Emergency Medicine. 2018;36 (12):2289–2297. [DOI] [PubMed] [Google Scholar]
- [2].Sanders J, Cooper J, Mythen MG, Montgomery HE. Predictors of total morbidity burden on days 3, 5 and 8 after cardiac surgery. Perioper Med. 2017; 6:2. [DOI] [PMC free article] [PubMed] [Google Scholar]
- [3].Bridgewater B. Mortality data in adult cardiac surgery for named surgeons: retrospective examination of prospectively collected data on coronary artery surgery and aortic valve replacement. BMJ. 2005;330:506. [DOI] [PMC free article] [PubMed] [Google Scholar]
- [4].Tuman KJ, McCarthy RJ, Spiess DB, Davalle M, Hompland SJ, Dabir R, AD Ivankovich. Effect of pulmonary artery catheterization on outcome in patients undergoing coronary artery surgery. Anesthesiology. 1989;70(2):199–206. [DOI] [PubMed] [Google Scholar]
- [5].Haines DE, Wong W, Canby R, Jewell C, Housmsse M, Pederson D, et al. Validation of a defibrillation lead ventricular volume measurement compared to three-dimensional echocardiography. Heart Rhythm. 2017;14(10):1515–1522. [DOI] [PubMed] [Google Scholar]
- [6].Raghavan K, Porterfield JE, Kottam ATG, Feldman MD, Escobedo D, Valvano JW, Pearce JA. Electrical Conductivity and Permittivity of Murine Myocardium. IEEE Trans. Biomed. Eng 2009;56(8):2044–2053. [DOI] [PubMed] [Google Scholar]
- [7].Wei CL, Valvano JW, Feldman MD, Pearce JA. Nonlinear conductance-volume relationship for murine conductance catheter measurement system. IEEE Trans. Biomed. Eng, 2005;52(10):1654–1661. [DOI] [PubMed] [Google Scholar]
- [8].Porterfield JE, Kottam ATG, Raghavan K, Escobedo D, Jenkins JT, Larson ER, et al. Dynamic correction for parallel conductance, GP, and gain factor, α, in invasive murine left ventricular volume measurements. J Appl Physiol. 2009;107(6):1693–1703. [DOI] [PMC free article] [PubMed] [Google Scholar]
- [9].Trevino RJ, Jones DL, Escobedo D, Porterfield J, Larson E, Chisholm GB, et al. Validation of a new micro-manometer pressure sensor for cardiovascular measurements in mice. Biomedical Instrumentation & Technology.2010;44(1):75–83. [DOI] [PubMed] [Google Scholar]
- [10].Haines DE, Wong W, Canby R, Jewell C, Houmsse M, Pederson D, Sugeng L, Porterfield J, Kottam A, Pearce J, Michalek J, Trevino A, Sagar S, Valvano JW, Feldman MD Validation of a Defibrillation Lead Ventricular Volume Measurement Compared to 3D Echocardiography, Heart Rhythm. 2017;14(10):1515–1522. [DOI] [PubMed] [Google Scholar]
- [11].Porterfield JE, Larson ER, Jenkins JT, Escobedo D, Valvano JW, Pearce JA, Feldman MD Left ventricular epicardial admittance measurement for detection of acute LV dilation. Journal of Applied Physiology 2011; 110(3): 799–806. [DOI] [PMC free article] [PubMed] [Google Scholar]
- [12].Holt LM, Oglesby ML, Wang AP, Valvano JW, and Feldman MD. A Real-Time Hemodynamic ICD Measurement: Evaluation in Chronically Implanted Canines With Pacing-Induced Dilated Cardiomyopathy. J Am Coll Cardiol EP. 2019;5(6):742–743. [DOI] [PubMed] [Google Scholar]
- [13].Larson ER, Porterfield JE, Sagar S, Marmol-Velez J, Panday M, Escobedo D, et al. Admittance to detect alterations in left ventricular stroke volume. Heart Rhythm. 2014;11(11):2075–2083. [DOI] [PubMed] [Google Scholar]
- [14].Larson ER, Valvano JW, Pearce JA, Feldman MD. Analysis of the Spatial Sensitivity of Conductance / Admittance Catheter Ventricular Volume Estimation. IEEE Transactions on Biomedical Engineering. TBME-01930–2012.R1. 2013; 60(8): 2316–2324. [DOI] [PubMed] [Google Scholar]
- [15].Gabriel S, Lau RW, Gabriel C. The dielectric properties of biological tissues: III. Parametric models for the dielectric spectrum of tissues. Phys. Med. Biol 1996;41(11):2271–2293. [DOI] [PubMed] [Google Scholar]
- [16].“ANSI/AAMI/UL 2800–1:2019; Standard for Safety for Medical Device Interoperability,” published by AAMI; Arlington, VA: 22203, 2019, ISBN 978–1-57020–711-2. [Google Scholar]
- [17].Refat AM and Abdelsayed A. Does the position of the drains after open heart surgery make a difference? A clinical randomized trial. J Egyptian Society of Cardio-Thoracic Surgery. 2018; 26 (4):281–286. [Google Scholar]


