

Abstract
Objectives
Muscular strength represents a specific component of health-related fitness. Hand grip strength (HGS) is used as an indicator for musculoskeletal fitness in children. HGS can also be used as a marker of cardiometabolic risk, but most available HGS data are derived from Western high-income countries. Therefore, this study examines whether HGS is associated with body composition and markers of cardiovascular risk in children from three sub-Saharan African countries.
Design
Cross-sectional study.
Setting
Public primary schools (grade 1–4) in Taabo (Côte d’Ivoire), Gqeberha (South Africa) and Ifakara (Tanzania).
Participants
Data from 467 children from Côte d’Ivoire (210 boys, 257 girls), 864 children from South Africa (429 boys, 435 girls) and 695 children from Tanzania (334 boys, 361 girls) were analysed.
Primary and secondary outcome measures
Body composition (assessed via bioelectrical impedance analysis) was the primary outcome. Cardiovascular risk markers were considered as secondary outcome. Blood pressure was measured with an oscillometric monitor, and blood markers (cholesterol, triglycerides, glycated haemoglobin) via Afinion point-of-care testing. HGS (independent variable) was assessed with a hydraulic hand dynamometer. Inferential statistics are based on mixed linear regressions and analyses of covariance.
Results
Across all study sites, higher HGS was associated with lower body fat, higher muscle mass and higher fat-free mass (p<0.001, 3.9%–10.0% explained variance), both in boys and girls. No consistent association was found between HGS and cardiovascular risk markers.
Conclusions
HGS assessment is popular due to its simplicity, feasibility, practical utility and high reliability of measurements. This is one of the first HGS studies with children from sub-Saharan Africa. There is a great need for further studies to examine whether our findings can be replicated, to develop reference values for African children, to establish links to other health outcomes, and to explore whether HGS is associated with later development of cardiovascular risk markers.
Trial registration number
ISRCTN29534081.
Keywords: community child health, public health, sports medicine
Strengths and limitations of this study.
This is one of the first hand grip strength (HGS) studies with children from sub-Saharan Africa.
The same methods were used across three different study sites (Côte d’Ivoire, South Africa, Tanzania).
There is still no consensus on HGS measurement protocols.
The children from the three study sites differed with regard to age, height and weight, and the samples were not representative for any of the countries involved.
Future studies should use longitudinal designs to explore whether grip strength in childhood is associated with later development of cardiovascular risk factors.
Introduction
Muscular strength represents a specific component of health-related fitness and is defined as the ability to develop maximal muscle force.1 Muscle strength plays an important role in child development as it is the basis for locomotive movement and, therefore, can facilitate play and social interaction with other children.2
Hand grip strength (HGS) is used as a simple indicator to assess the maximum voluntary force of the hand,3 but HGS is also associated with arm, trunk and leg strength.4 Research further shows that HGS is a good indicator for musculoskeletal fitness in children.5 Accordingly, assessment of HGS is recommended as part of school-based fitness testing and as a screening tool for adequate levels of muscle strength and bone health.6
HGS is strongly dependent on age, sex and body mass.7 The association with age is curvilinear. HGS increases through childhood and adolescence and peaks around the age of 40 years.3 8 Moreover, boys have higher HGS than girls, especially after puberty.3 7 Following puberty, there is an exponential progression in muscle strength among boys, which has been ascribed to the increase of testosterone and which in turn favours the growth of lean muscle mass.9 In girls, an increase of total body fat was observed after puberty.10 Research has also shown that HGS depends on body mass, and that HGS divided by body weight is more closely associated with health outcomes than absolute HGS values.11
Meanwhile, normative HGS reference values have been developed for children and adolescents in several countries.8 12 For instance, based on normalised HGS measurements from 1326 sixth-grade students (10–12 years), Peterson et al13 developed thresholds for high metabolic risk and intermediate metabolic risk adolescents living in the USA. However, it is doubtful whether such HGS norms can be generalised across countries.3 For instance, a recent meta-analysis showed that HGS scores are significantly higher in high-income compared with low-to-middle-income countries (LMICs).14
Furthermore, skeletal muscle has an important role for health and disease because it is the primary protein store within the body and the primary tissue for glucose disposal.15 In line with this notion, HGS has been associated with a variety of health outcomes among adults, including nutritional status,16 chronic physical conditions such as cancer and cardiovascular (CV) diseases, as well as CV and all-cause mortality.15 17 These relationships have also been observed in people living in LMICs.18 Interestingly, HGS seems to be a better predictor of mortality than muscle mass,19 however, the underlying mechanisms are not yet well understood.17 20 The association might be mediated via CV risk factors such as hypertension, diabetes, metabolic syndrome, inflammatory markers or risk of arrhythmia.11 21 22 In line with this, a meta-analysis showed that CV risk factors indeed attenuated the relationship between HGS and mortality, but they did not fully explain the observed relationship.17
Prior research has corroborated that HGS is a relevant health outcome among children and adolescents. For instance, a study with 1421 children (M=11.6 years) from the USA pointed towards a significant inverse relationship between HGS and blood pressure, cholesterol levels and triglycerides.23 Similarly, a study with 2818 Norwegian children (9–15 years) reported that, after adjusting for age, sex and puberty, higher HGS was associated with lower waist circumference, higher high density lipoprotein (HDL) cholesterol, lower triglycerides concentration and lower systolic blood pressure.24 These relationships were confirmed in Colombian children (M=11.5 years) living in low socioeconomic background settings.25 Finally, a prospective cohort study with more than a million Swedish participants showed that high grip strength in adolescence is associated with lower premature death later in life (median follow-up period of 24 years).26
In summary, these studies highlight that HGS has the potential to be used not only as an indicator of muscular strength, but also as a marker of cardiometabolic risk. However, most of today’s data are derived from Western high-income countries, whereas research in sub-Saharan Africa, where rapid social, cultural, economic and urban developments are currently occurring, is lacking, particularly among children. Therefore, the purpose of this paper was to examine whether HGS is associated with body composition (body fat, muscle mass, fat free mass) and markers of CV risk (blood pressure, cholesterol, triglycerides, blood glucose (glycated haemoglobin, HbA1c)) in primary schoolchildren from three African countries (Côte d’Ivoire, South Africa and Tanzania).
Methods
Study design and setting
Data presented in this paper come from the baseline data assessment of the KaziAfya cluster randomised controlled trial, which was conducted in public schools in Taabo (Côte d’Ivoire), Gqeberha (South Africa) and Ifakara (Tanzania). The goal of this trial was to implement and test two school-based health interventions (physical activity promotion, multimicronutrient supplementation) over a period of two school years to improve children’s health status. All study sites are located in rural and peri-urban settings. The Ivorian public primary schools were selected from Taabo city and village, located in the rural South-central Agnéby-Tiassa region (150 km Northwest from Abidjan). Taabo’s economy relies on agriculture (90% of the employees), and has two companies in the agricultural sector and a power station (hydroelectric dam), which produces 2% of the country’s energy. Our project schools in South Africa are located in periurban marginalised communities in the Eastern Cape (Gqeberha region). Only schools with poor ratings with reference to national poverty tables, income levels, dependency ratios and literacy rates were involved. Our project schools in South-central Tanzania are situated in a rural town (Ifakara) in the Kilombero District, Morogoro Region (413 km from Dar es Salaam). The main economic activity of the local population is rice farming, but small businesses and animal husbandry are also conducted. As described in the study protocol, education authorities were contacted first, before contact was made with principals of schools that met inclusion criteria. Detailed information was given to school principals about the objectives, procedures and potential risks and benefits of the study. Based on this information, school principals could state their interest in being part of the project. Schools were eligible if they were public schools, had facilities to implement physical education lessons (free space: lawn, sand or concrete), and did not participate in any other research project or clinical trial.27
Participants and procedures
Children were eligible if they attended grade 1–4, were no older than 12 years, did not participate in any other research projects, and did not suffer from clinical conditions that prevent participation in physical activity, as determined by qualified medical personnel. Written informed consent was obtained from the legal guardians before study enrolment, after having provided detailed written and oral information about the aims, procedures, risks and benefits of the study. The responsible ethics committees in Côte d’Ivoire, South Africa, Tanzania and Switzerland and the local school authorities approved the study. Children who suffered from severe medical conditions and/or malnourishment (as diagnosed by a nurse, following national guidelines) were referred to local clinics. The data assessment took place between October and December 2018 in Côte d’Ivoire, between January and April 2019 in South Africa, and between July and August 2019 in Tanzania.
Measures
Data assessments took place at children’s schools before the start of the intervention. Saehan hydraulic hand dynamometers (MSD Europe BVBA; Tisselt, Belgium) were used to assess HGS. The children were instructed to sit with spine erect, relaxed, and with an arm position at a 90° angle. Before the first data assessment, a field investigator briefly demonstrated how to hold the hand dynamometer. Children were instructed to grip the hand dynamometer as hard as possible. Each child performed six trials (three with the left, and three with the right hand), which were recorded to the nearest 1 kg. After each trial and after a 30 s resting period, the hand was changed. An overall HGS score was constructed by calculating the mean across all six trials, which was then divided by the child’s body weight. Previous research with children showed that HGS is closely associated with total muscle strength,28 and that HGS measures generally have a good reliability.29 Body composition was assessed via bioelectrical impedance analysis (BIA) using a wireless body composition monitor (Tanita MC-580; Tanita, Tokyo, Japan). Children wearing only light clothing were asked to stand barefoot on the metal plates of the device, being guided by the research assistant to ensure optimal contact according to the manufacturer’s instructions. The MC-580 was also used to assess body weight to the nearest 0.1 kg. Body height was taken to the nearest 0.1 cm with each child standing with his/her back erect and shoulders against a stadiometer. Blood pressure was assessed with a validated oscillometric digital blood pressure monitor (Omron M3; Hoofddorp, Netherlands). Three measurements were performed, and the mean of the last two measurements were employed as indicators of systolic and diastolic blood pressure. Capillary blood sampling was used to assess blood markers for CV risk, using the Afinion 2 analyser (Abbott Technologies; Abbott Park, USA). Total cholesterol, HDL cholesterol, low density lipoprotein (LDL) cholesterol, triglycerides and HbA1c were assessed using fasting capillary blood sampling.30 Evidence of the clinical utility and accuracy of this finger prick technology has been described previously.31
Statistical analyses
Descriptive statistics for all study variables are reported separately for each study site (table 1). Normality was tested via the Kolmogorov-Smirnov test. Univariate analyses of covariance (ANCOVAs) with Bonferroni post hoc tests were calculated to examine differences between study sites. Mixed linear regression analyses with random intercepts for school classes to account for the nested nature of the data (learners assessed in classes) were performed separately for each study site to determine whether HGS is associated with body composition and single CV risk markers (table 2). All regression analyses were controlled for sex and height (table 2). Weight and age were not considered as covariates to avoid over-adjustment and collinearity issues (eg, weight is already considered in the body weight-adjusted HGS measure, age is highly correlated with height (r=0.71–0.77, p<0.001). Objectively assessed physical activity, cardiorespiratory fitness (VO2max), dietary diversity, and socioeconomic status were considered as additional covariates (online supplemental table S1). To compare children with high vs low HGS scores, ANCOVAs (controlling for sex and height) with Bonferroni post hoc tests were calculated to compare HGS quartiles (table 3). Analyses controlled for further covariates are presented as online supplemental table S2. All analyses were carried out with SPSS (V.26, IBM). The level of statistical significance was set at p<0.05 across all analyses.
Table 1.
Sample characteristics and descriptive statistics, separately for each study site
| Categorical variables | Côte d’Ivoire (n=467) |
South Africa (n=864) |
Tanzania (n=695) |
|||||||
| n | % | n | % | n | % | χ2 | ϕ | |||
| Sex | ||||||||||
| Male | 210 | 45.0 | 429 | 49.7 | 334 | 48.1 | 2.67 | 0.036 | ||
| Female | 257 | 55.0 | 435 | 50.3 | 361 | 51.9 | ||||
| Uncontrolled | Controlled for sex, height and weight | |||||||||
| Metric variables | M | SD | M | SD | M | SD | F | η2 | F | η2 |
| Age (in years) | 7.86ab | 1.69 | 8.24ac | 1.42 | 9.34bc | 1.74 | 113.15*** | 0.118 | 60.12*** | 0.067 |
| Height (in cm) | 123.53a | 9.44 | 124.01b | 8.95 | 128.67ab | 10.28 | 49.83*** | 0.056 | 20.21***† | 0.020 |
| Weight (in kg) | 23.09ab | 4.43 | 24.54ac | 5.49 | 26.77bc | 5.86 | 50.07*** | 0.056 | 29.91***‡ | 0.029 |
| BMI (in kg/m2) | 15.00ab | 1.29 | 15.79 a | 2.04 | 16.01b | 1.90 | 24.89*** | 0.029 | 32.79***§ | 0.042 |
| Grip strength | ||||||||||
| Absolute grip strength (in kg) | 8.47ab | 2.63 | 11.23ac | 4.38 | 12.43bc | 4.40 | 82.74*** | 0.089 | 56.19*** | 0.063 |
| Body weight adjusted grip strength* | 0.36ab | 0.09 | 0.46 a | 0.17 | 0.46b | 0.11 | 52.92*** | 0.059 | 48.13*** | 0.065 |
| Body composition | ||||||||||
| Body fat (in %) | 19.50ab | 2.96 | 22.13ac | 4.37 | 20.23bc | 3.95 | 68.94*** | 0.076 | 113.16*** | 0.118 |
| Muscle mass (in %) | 76.01ab | 2.73 | 73.50ac | 4.04 | 75.38bc | 3.68 | 74.57*** | 0.081 | 115.17*** | 0.120 |
| Fat-free mass (in %) | 80.51ab | 2.95 | 77.88ac | 4.38 | 79.78bc | 3.96 | 68.94*** | 0.075 | 112.50*** | 0.118 |
| Cardiovascular risk factors | ||||||||||
| Systolic blood pressure (in mm Hg) | 99.47ab | 10.44 | 101.36ac | 11.10 | 104.66bc | 11.07 | 20.35*** | 0.024 | 6.49** | 0.008 |
| Diastolic blood pressure (in mm Hg) | 64.95ab | 9.46 | 62.88ac | 8.50 | 67.34bc | 8.32 | 38.44*** | 0.044 | 32.66*** | 0.037 |
| Total cholesterol (in mmol/L) | 3.57 a | 0.67 | 3.63b | 0.60 | 3.78ab | 0.67 | 14.43*** | 0.017 | 11.16*** | 0.013 |
| HDL cholesterol (in mmol/L) | 1.99ab | 0.52 | 2.06ac | 0.50 | 2.15bc | 0.53 | 35.98*** | 0.041 | 29.32*** | 0.034 |
| LDL cholesterol (in mmol/L) | 1.05ab | 0.36 | 1.24ac | 0.29 | 1.28bc | 0.41 | 12.84*** | 0.015 | 13.05*** | 0.015 |
| Triglycerides (in mmol/L) | 1.16ab | 0.35 | 0.74 a | 0.22 | 0.77b | 0.33 | 241.99*** | 0.223 | 252.92*** | 0.231 |
| Glycated haemoglobin (in %) | 4.94ab | 0.38 | 5.42ac | 0.25 | 5.22bc | 1.73 | 266.20*** | 0.240 | 266.02*** | 0.240 |
**p<0.01, ***p<0.001.
*Body weight adjusted grip strength is calculated with the following formula: Absolute grip strength/body weight.
†ANCOVA controlled for sex and weight.
‡ANCOVA controlled for sex and height
§ANCOVA controlled for sex. Mean scores with the same superscript letters are significantly different (p<0.05), based on Bonferroni post hoc tests. Significant results are marked in bold font.
ANCOVA, analyses of covariance; BMI, body mass index; HDL, high density lipoprotein; LDL, low density lipoprotein.
Table 2.
Association between weight-adjusted HGS, body composition and cardiometabolic risk markers, separately for each study site
| Côte d’Ivoire (n=467) |
South Africa (n=864) |
Tanzania (n=695) |
|||||||
| B (SE) | 95% CI | p value | B (SE) | 95% CI | p value | B (SE) | 95% CI | p value | |
| Model 1: uncontrolled | |||||||||
| Body composition | |||||||||
| Body fat | −12.65 (1.48) | −15.55 to −9.74 | <0.001 | −7.69 (0.85) | −9.36 to −6.03 | <0.001 | −12.49 (1.19) | −14.83 to −10.16 | <0.001 |
| Muscle mass | 11.66 (1.36) | 8.99 to 14.34 | <0.001 | 7.03 (0.79) | 5.48 to 8.59 | <0.001 | 11.70 (1.11) | 9.53 to 13.87 | <0.001 |
| Fat free mass | 12.64 (1.47) | 9.75 to 15.53 | <0.001 | 7.69 (0.85) | 6.02 to 9.36 | <0.001 | 12.47 (1.19) | 10.14 to 14.81 | <0.001 |
| Cardiovascular risk markers | |||||||||
| Systolic blood pressure | 13.98 (5.91) | 2.37 to 25.59 | <0.001 | 1.36 (2.15) | −2.87 to 5.58 | 0.529 | 10.05 (3.83) | 2.54 to 17.56 | 0.009 |
| Diastolic blood pressure | 4.07 (5.09) | −5.93 to 14.06 | 0.425 | −1.25 (1.69) | −4.47 to 2.17 | 0.496 | 0.84 (2.79) | −4.63 to 6.32 | 0.762 |
| Total cholesterol | 0.66 (0.37) | −0.07 to 1.38 | 0.078 | 0.20 (0.12) | −0.04 to 0.44 | 0.098 | −0.27 (0.20) | −0.66 to 0.11 | 0.162 |
| HDL cholesterol | 0.33 (0.18) | −0.04 to 0.69 | 0.076 | 0.10 (0.06) | −0.01 to 0.22 | 0.075 | 0.19 (0.11) | −0.02 to 0.40 | 0.082 |
| LDL cholesterol | 0.48 (0.28) | −0.07 to 1.03 | 0.088 | 0.13 (0.10) | −0.07 to 0.34 | 0.189 | −0.51 (0.17) | −0.85 to −0.18 | 0.003 |
| Triglycerides | −0.32 (0.20) | −0.71 to 0.08 | 0.113 | −0.07 (0.04) | −0.16 to 0.01 | 0.091 | 0.12 (0.09) | −0.05 to 0.29 | 0.169 |
| Glycated haemoglobin (HbA1c) | −0.16 (0.21) | −0.56 to 0.24 | 0.433 | 0.06 (0.05) | −0.04 to 0.16 | 0.229 | −0.04 (0.10) | −0.24 to 0.17 | 0.712 |
| Model 2: controlled for sex and height | |||||||||
| Body composition | |||||||||
| Body fat | −8.30 (1.45) | −11.16 to −5.45 | <0.001 | −5.93 (0.77) | −7.45 to −4.42 | <0.001 | −7.02 (1.34) | −9.66 to −4.39 | <0.001 |
| Muscle mass | 7.68 (1.39) | 4.95 to 10.41 | <0.001 | 5.53 (0.73) | 4.10 to 6.96 | <0.001 | 6.55 (1.26) | 4.08 to 9.03 | <0.001 |
| Fat free mass | 8.29 (1.45) | 5.43 to 11.15 | <0.001 | 5.93 (0.77) | 4.41 to 7.45 | <0.001 | 7.02 (1.34) | 4.38 to 9.65 | <0.001 |
| Cardiovascular risk markers | |||||||||
| Systolic blood pressure | 1.94 (5.97) | −9.80 to 13.68 | 0.746 | −0.65 (2.02) | −4.62 to 3.32 | 0.747 | 4.88 (1.17) | −3.28 to 13.04 | 0.241 |
| Diastolic blood pressure | −0.31 (5.41) | −10.95 to 10.32 | 0.954 | −1.06 (1.67) | −4.34 to 2.23 | 0.523 | 0.06 (3.04) | −5.91 to 6.03 | 0.984 |
| Total cholesterol | 0.83 (0.39) | 0.06 to 1.59 | 0.035 | 0.21 (0.12) | −0.04 to 0.45 | 0.094 | −0.15 (0.23) | −0.59 to 0.30 | 0.519 |
| HDL cholesterol | 0.27 (0.20) | −0.13 to 0.67 | 0.178 | 0.06 (0.06) | −0.06 to 0.17 | 0.350 | 0.19 (0.12) | −0.05 to 0.43 | 0.125 |
| LDL cholesterol | 0.07 (0.30) | 0.15 to 1.32 | 0.014 | 0.19 (0.11) | −0.02 to 0.39 | 0.079 | −0.35 (0.20) | −0.73 to 0.04 | 0.079 |
| Triglycerides | −0.39 (0.22) | −0.81 to 0.04 | 0.075 | −0.07 (0.04) | −0.16 to 0.02 | 0.119 | 0.04 (0.10) | −0.16 to 0.23 | 0.699 |
| Glycated haemoglobin (HbA1c) | −0.23 (0.22) | −0.66 to 0.20 | 0.297 | 0.04 (0.05) | −0.06 to 0.14 | 0.463 | −0.05 (0.11) | −0.26 to 0.17 | 0.669 |
Notes. Significant results are marked in bold font.
HDL, high density lipoprotein; HGS, hand grip strength; LDL, low density lipoprotein.
Table 3.
Differences between HGS quartiles in body composition and cardiometabolic risk markers, separately for each study site
| Côte d’Ivoire (n=467) | ||||||||||
| Quartile 1 (n=121) |
Quartile 2 (n=112) |
Quartile 3 (n=121) |
Quartile 4 (n=113) |
ANCOVA | ||||||
| M | SD | M | SD | M | SD | M | SD | F | η2 | |
| BF | 21.14abc | 2.86 | 19.75ade | 2.85 | 18.63bdf | 2.47 | 18.42cef | 2.82 | 13.33*** | 0.080 |
| MM | 74.49abc | 2.65 | 75.79ade | 2.65 | 76.82bd | 2.24 | 76.99ce | 2.62 | 12.88*** | 0.077 |
| FFM | 78.88abc | 2.85 | 80.24ade | 2.84 | 81.36bd | 2.47 | 81.61ce | 2.83 | 13.43*** | 0.080 |
| SBP | 97.89 | 11.81 | 100.87 | 10.20 | 99.77 | 9.64 | 99.44 | 9.82 | 0.25 | 0.002 |
| DBP | 64.90 | 9.64 | 65.36 | 9.95 | 64.83 | 9.11 | 64.72 | 9.26 | 0.37 | 0.002 |
| TC | 3.59 | 0.72 | 3.47 | 0.61 | 3.56 | 0.69 | 3.64 | 0.67 | 1.32 | 0.009 |
| HDL-C | 1.04 | 0.35 | 1.01 | 0.37 | 1.06 | 0.37 | 1.10 | 0.37 | 1.34 | 0.009 |
| LDL-C | 2.00 | 0.55 | 1.93 | 0.48 | 1.98 | 0.53 | 2.04 | 0.50 | 0.89 | 0.006 |
| TRIG | 1.21 | 0.37 | 1.18 | 0.35 | 1.17 | 0.37 | 1.10 | 0.32 | 1.89 | 0.012 |
| HbA1c | 4.97 | 0.38 | 4.98 | 0.37 | 4.90 | 0.37 | 4.92 | 0.40 | 1.41 | 0.009 |
| South Africa ( n =864) | ||||||||||
|
Quartile 1
(n=213) |
Quartile 2
(n=218) |
Quartile 3
(n=216) |
Quartile 4
(n=217) |
ANCOVA | ||||||
| M | SD | M | SD | M | SD | M | SD | F | η 2 | |
| BF | 24.13ab | 4.88 | 23.13 cd | 4.47 | 21.35ace | 3.72 | 19.93bde | 2.96 | 31.69*** | 0.100 |
| MM | 71.64ab | 4.50 | 72.58 cd | 4.14 | 74.24ace | 3.44 | 75.52bde | 2.73 | 31.58*** | 0.099 |
| FFM | 75.88ab | 4.89 | 76.88 cd | 4.48 | 78.66ace | 3.73 | 80.08bde | 2.97 | 31.58*** | 0.099 |
| SBP | 99.79 | 11.99 | 102.06 | 10.37 | 101.57 | 11.46 | 101.98 | 10.43 | 0.60 | 0.002 |
| DBP | 62.32 | 8.79 | 63.63 | 8.64 | 62.64 | 8.15 | 62.93 | 8.40 | 0.90 | 0.003 |
| TC | 3.61 | 0.63 | 3.57 | 0.61 | 3.64 | 0.53 | 3.70 | 0.61 | 2.01 | 0.007 |
| HDL-C | 1.22 | 0.29 | 1.21 | 0.28 | 1.24 | 0.31 | 1.27 | 0.29 | 1.20 | 0.004 |
| LDL-C | 2.03 | 0.52 | 2.02 | 0.51 | 2.07 | 0.47 | 2.10 | 0.51 | 1.81 | 0.006 |
| TRIG | 0.78 a | 0.25 | 0.75 | 0.22 | 0.70 a | 0.20 | 0.73 | 0.22 | 4.58** | 0.016 |
| HbA1c | 5.49 | 0.25 | 5.43 | 0.26 | 5.44 | 0.24 | 0.42 | 0.26 | 0.06 | 0.002 |
| Tanzania ( n =695) | ||||||||||
|
Quartile 1
( n =175) |
Quartile 2
( n =172) |
Quartile 3
( n =175) |
Quartile 4
( n =173) |
ANCOVA | ||||||
| M | SD | M | SD | M | SD | M | SD | F | η 2 | |
| BF | 21.91ab | 4.15 | 21.01 cd | 3.57 | 19.69ace | 3.57 | 18.29bde | 3.55 | 9.49*** | 0.040 |
| MM | 73.78ab | 3.86 | 74.67 cd | 3.32 | 75.91ace | 3.28 | 77.16bde | 3.31 | 9.40*** | 0.039 |
| FFM | 78.09ab | 4.16 | 79.01 cd | 3.56 | 80.30ace | 3.57 | 81.71bde | 3.56 | 9.34*** | 0.039 |
| SBP | 103.36 | 10.38 | 104.28 | 10.38 | 104.85 | 11.75 | 106.16 | 11.59 | 0.44 | 0.002 |
| DBP | 67.20 | 8.05 | 67.07 | 8.49 | 67.61 | 8.49 | 67.47 | 7.84 | 0.09 | 0.000 |
| TC | 3.75 | 0.65 | 3.86 | 0.64 | 3.77 | 0.64 | 3.71 | 0.56 | 1.44 | 0.006 |
| HDL-C | 1.24 | 0.32 | 1.30 | 0.37 | 1.28 | 0.34 | 1.30 | 0.35 | 1.19 | 0.005 |
| LDL-C | 2.17 | 0.55 | 2.22 | 0.50 | 2.13 | 0.57 | 2.07 | 0.49 | 0.86 | 0.004 |
| TRIG | 0.72 | 0.23 | 0.79 | 0.31 | 0.79 | 0.36 | 0.76 | 0.31 | 1.02 | 0.004 |
| HbA1c | 5.17 | 0.31 | 5.15 | 0.32 | 5.14 | 0.32 | 5.16 | 0.33 | 0.20 | 0.001 |
ANCOVAs controlled for sex and height. Mean scores with the same superscript letters are significantly different (p<0.05), based on Bonferroni post hoc tests. Significant results are marked in bold font.
***p<0.01. ***p<0.001.
ANCOVA, analyses of covariance; BF, body fat; DBP, diastolic blood pressure; FFM, fat free mass; HbA1c, glycated haemoglobin; HDL-C, high density lipoprotein-cholesterol; HGS, hand grip strength; LDL-C, low density lipoprotein-cholesterol; MM, muscle mass; SBP, systolic blood pressure; TC, total cholesterol; TRIG, triglycerides.
bmjopen-2021-052326supp002.pdf (351.9KB, pdf)
Patient and public involvement statement
Patients or the public were not involved in the design, conduct, reporting or dissemination plans of our study.
Results
Sample description
As shown in table 1, in Côte d’Ivoire, 467 children presented with complete data (210 boys, 257 girls) across all study variables. In South Africa, 864 children were included (429 boys, 435 girls), whereas in Tanzania, the final sample consisted of 695 children (334 boys, 361 girls). A participant flow chart is provided in figure 1. Because the blood tests and fitness tests took place on different days, because of the limited time allocated by schools for data collection, and due to a beginning national teacher strike in Côte d’Ivoire, a considerable number of students of the original sample had missing values and could not be included in the analyses.
Figure 1.
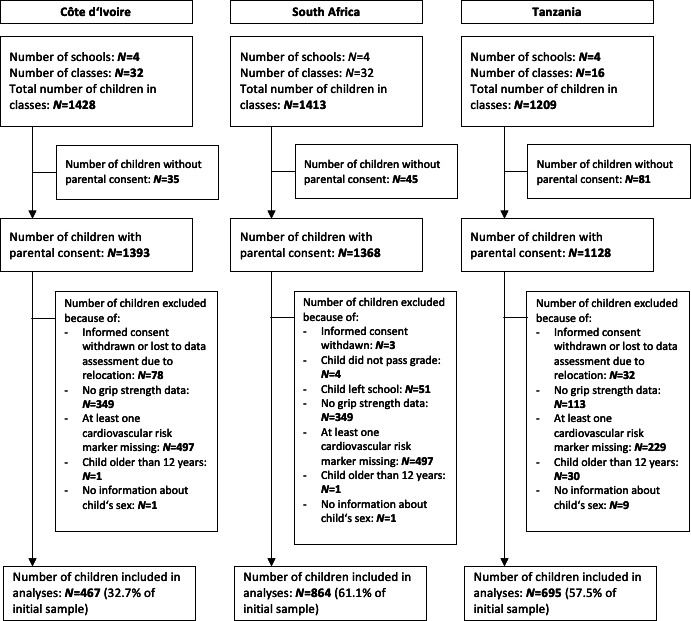
Participant flow chart.
Descriptive statistics and between-country differences
Table 1 displays the descriptive statistics, separately for each study site. Although none of the metric variables were normally distributed, no evidence for severe non-normality was found (skewness and kurtosis values of ≥|2| and ≥|7|, respectively).32 Therefore, no log-transformation of the outcomes was needed. High internal consistency across the six HGS measurements was confirmed in each study site (Cronbach’s alpha: 0.95–0.98). As shown in table 1, significant differences between study sites were found in most of the variables, before and after controlling for confounders. Children from the Tanzanian study site were oldest (M=9.34±1.74 years), followed by peers from the South African (M=8.24±1.42 years) and Ivorian (M=7.86±2–63 years) study sites. In line with this, children from Tanzania were tallest, heaviest and had the highest body mass index (BMI) scores. They also achieved the highest absolute and weight-adjusted HGS scores. Furthermore, children from Tanzania had the highest scores for systolic/diastolic blood pressure, total cholesterol, as well as HDL and LDL cholesterol. By contrast, children from the Ivorian study site had higher triglyceride levels, whereas children from the South African study site had the highest HbA1c concentrations. Differences in HGS, body composition and CV risk persisted after controlling for sex, height and weight.
HGS, body composition and CV risk markers
Table 2 shows the results of the mixed linear regression models, separately for each study site. The results consistently show that HGS is positively associated with relative muscle mass and fat-free mass, whereas HGS is negatively associated with relative body fat. These associations persisted after controlling for sex and height. The associations also persisted after controlling for further confounders (see online supplemental table S1).
Regarding the association between HGS and CV risk markers, only a few significant results were found, after adjusting for sex and height. More specifically, in children from the Ivorian study site, those with higher HGS had higher total and LDL cholesterol levels. However, no such relationships were found among children recruited from the South African and Tanzanian study sites.
Differences between HGS quartiles
Table 3 shows the means and standard deviation for the different HGS quartiles. Consistently across all study sites, significant between-quartile differences were found for relative body fat, muscle mass and fat-free mass. Differences remained after controlling for sex and height (table 3) and further confounders (online supplemental table S2). Bonferroni post hoc tests pointed towards a clear gradient, indicating that students in the higher HGS quartiles had lower body fat levels, higher muscle mass and higher fat-free mass. Using the example of muscle mass, figure 2 shows that this gradient occurred in both girls and boys.
Figure 2.
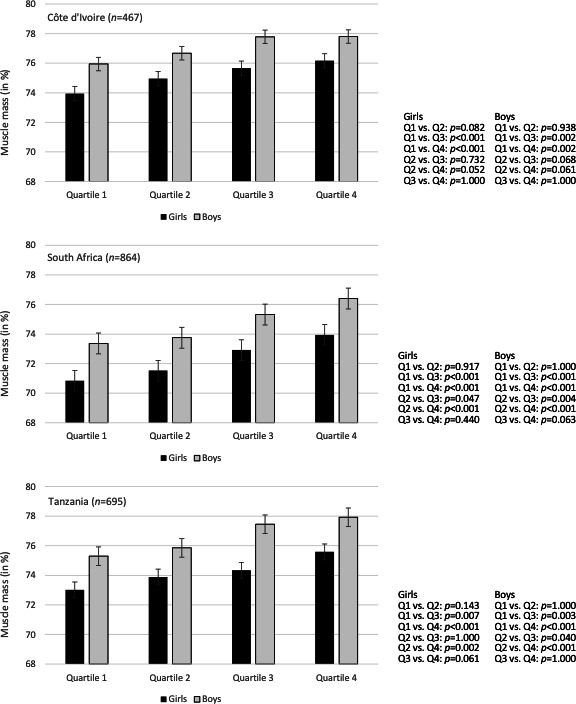
Differences in muscle mass between HGS quartiles, separately for girls and boys and for each study site. HGS, hand grip strength.
Discussion
The key findings of this study are that in primary school children from Côte d’Ivoire, South Africa and Tanzania, higher HGS is associated with lower body fat, higher muscle mass and higher fat-free mass. A clear gradient appeared in both boys and girls. The level of explained variance (3.9%–10.0%) points towards between-quartile differences of moderate magnitude. Unlike previous findings, no consistent association was found between HGS and further (single) CV risk markers (blood pressure, cholesterol, triglycerides, HbA1c). To the best of our knowledge, this is the first study carried out with children in sub-Sahara Africa and testing the relationship between HGS, body composition and CV risk markers. It is also one of the few studies carried out with younger schoolchildren.
This study corroborates the notion that grip strength serves as a dynamic indicator of muscle mass and healthy body composition.3 4 33 This also supports public health recommendations that children should regularly engage in muscle-strengthening activities.34 Schools can play an important role in this process as they can reach all children, independent of their sex, ethnicity and socioeconomic background via school physical education. On the other hand, the association between muscle mass and HGS was of limited (moderate) magnitude. This indicates that other factors have an impact on children’s HGS. Possible influences are overall dietary quality,35 disease-related factors33 and socioeconomic status.36 However, in this study, the association between HGS and muscle mass persisted after controlling for physical activity, cardiorespiratory fitness, dietary diversity and socioeconomic status.
This study also confirms prior research3 7 8 showing that increasing age is positively associated with both absolute HGS (in this sample: r=0.50–0.70, p<0.001, data not shown) and body weight-adjusted HGS (r=0.17–0.46, p<0.001, data not shown). While chronological and biological age can differ,8 similarly strong associations were found between children’s height and absolute HGS (in this sample: r=0.54–0.74, p<0.001, data not shown) and body weight-adjusted HGS (r=0.11–0.36, p<0.01, data not shown). Our study also aligns with previous investigations showing that boys have higher HGS than girls.3 7 9 10 In the present sample, boys had higher absolute HGS (3.0%–4.7% of explained variance, data not shown) and body weight-adjusted HGS (3.9%–6.5% of explained variance, data not shown) than girls.
Regarding the relationship between HGS and CV risk markers, our findings are at odds with most previous studies with adult11 21 22 and child/adolescent populations.23–26 Whereas prior research with children and adolescents showed that higher HGS are associated with more favourable blood pressure, more favourable cholesterol profiles, lower triglyceride concentrations and lower clustered CV risk, it is important to note that not all studies found such relationships. For instance, HGS was not associated with CV risk markers in a sample of 1642 Australian children and adolescents (9–15 years).37 The fact that in our study no clear association occurred in any of the study sites indicates that our results have a certain generalisability; however, we can only speculate about the underlying reasons. One assumption relates to the (low) age of the children and the fact that, on average, risk marker scores were relatively low in the present sample.38 It is possible that the relationship between HGS and CV risk markers becomes more pronounced as muscle strength increases with age due to changes in muscle mass,28 and as the prevalence of CV risk factors increases during later childhood and adolescence. In younger children, HGS may be more closely associated with other (eg, subjective or mental) health outcomes.39 This aspect deserves more attention in future investigations, especially as few studies have so far examined the relationship between HGS and subjective/mental health in children/adolescents. Among adults, the relevance of low HGS as a risk marker for CV health seems well established. In line with this, a UK Biobank-based study with 403 199 adults showed that obesity and lower grip strength are independent predictors of higher mortality risk. However, all-cause mortality risk was lower for obese but stronger individuals compared with non-obese, but weaker individuals,34 which suggests that ‘improving muscle strength may be a more important public health priority than reducing adiposity in decreasing mortality risks, although excessive adiposity itself is a strong risk factor of mortality’ (Kim et al, p. 780). Finally, the relationship between HGS and health outcomes may be different in children from LMICs.
Strengths and limitations
The fact that there is still no consensus on HGS measurement protocols complicates between-study comparisons.33 For instance, research showed that methodological aspects (eg, dynamometer handle position) can have a significant influence on the HGS performance of children.40 Therefore, the fact that we applied the same methods across three different study sites is an advantage, as it allows direct comparison of the findings. By contrast, the fact that children from the three study sites differed with regard to age, height and weight can be seen as a limitation. To address this issue, we focused on body weight-adjusted HGS, and considered sex and height (as a proxy for biological age) as covariates. Nevertheless, some questions remain unanswered. For instance, it is not entirely clear why—after controlling for sex, height and weight—children from Côte d’Ivoire had lower weight-adjusted HGS scores than peers from South Africa and Tanzania. We further acknowledge that due to the cross-sectional nature of our study, no conclusions are possible regarding cause and effect. Researchers have pointed to the issue of reversed causality and the fact that poor HGS could be considered as a marker of poor overall health.17 For future studies, the important question is whether grip strength in childhood is associated longitudinally with later development of CV risk factors. We also acknowledge that differences between study sites should not be (mis)interpreted as between-country differences, since the study sites were not representative for any of the countries involved. In all three study sites, children were recruited from rural and periurban areas and thus represent rather poor segments of the population, which limits the generalisability of our findings.
Conclusions
HGS assessment is popular due to its simplicity, feasibility, practical utility and high reliability of measurements. Assessments are quickly obtainable by a range of different health professionals. They can also be easily implemented as part of school-based fitness testing and as a screening tool for adequate levels of muscle strength and bone health.
Our study highlights that higher body weight-adjusted HGS is associated with healthy body composition (lower body fat, higher fat-free mass) and higher muscle mass. To the best of our knowledge, this is the first HGS study with children from sub-Saharan Africa. Hence, there is a great and continued need for further studies to examine whether our findings can be replicated (eg, with older primary school students), to establish links to other health outcomes (eg, nutritional status, mental health), to explore longitudinal relationships, and to develop reference values for African children and adolescents. It will also be important to understand whether HGS is a predictor of the level of CV/metabolic risks in specific populations in different countries of sub-Saharan Africa, and to consider how CV/metabolic risk can be improved in these populations in the longer term.
bmjopen-2021-052326supp001.pdf (758KB, pdf)
Supplementary Material
Acknowledgments
We thank Larissa Adams, Nandi Joubert, Madeleine Nienaber, Danielle Smith, Zaahira Ismail, Salehe Makuka, Haji Fuko, Emmanuel Mrimi, Irene Ngoja, Anna Nyoni and Jerôme N’Dri for their contribution to data collection. We also thank Jan Degen and all involved Master’s students from the University of Basel, Switzerland (Lisa von Polanen, Nora Degonda, Ilir Freitag, Selma Catakovic) and the University of Vienna, Austria (Christina Polak, Dominique Greger) for their support in the data collection and processing. Finally, we thank the school authorities, school principals, teachers, medical doctors, nurses, teacher coaches, students and parents/legal guardians for their willingness to support our study.
Footnotes
Contributors: MG, KZL, UP and JU were responsible for the conceptualisation of the study and for initial funding acquisition. MG serves as principal investigator of the study, BB, HM and CW are the principal investigators in the three partner countries. CL is responsible for the overall administration of the study. SGT, MFF and SG are the local project coordinators. RdR, DD, KZL, FOO, NP-H, UP and PS served as project advisors and provide resources. SA, JB, BK, BCG, SGT, JTC, MFF, GJM, EGM, SG, GJM, CL, IM and SN contributed to the data assessment and curation. MG performed the statistical analysis, wrote the first draft of the manuscript and acts as guarantor. All authors contributed to manuscript revision, read and approved the submitted version.
Funding: The study is funded by Fondation Botnar (Basel, Switzerland; grant number: 6071). SN was funded by the Department of Research Development, Nelson Mandela University and the German Academic Exchange Service (DAAD)-National Research Foundation, South African (DAAD-NRF); Grand UID 117629.
Competing interests: None declared.
Provenance and peer review: Not commissioned; externally peer reviewed.
Supplemental material: This content has been supplied by the author(s). It has not been vetted by BMJ Publishing Group Limited (BMJ) and may not have been peer-reviewed. Any opinions or recommendations discussed are solely those of the author(s) and are not endorsed by BMJ. BMJ disclaims all liability and responsibility arising from any reliance placed on the content. Where the content includes any translated material, BMJ does not warrant the accuracy and reliability of the translations (including but not limited to local regulations, clinical guidelines, terminology, drug names and drug dosages), and is not responsible for any error and/or omissions arising from translation and adaptation or otherwise.
Data availability statement
Data are available on reasonable request. The raw datasets are available from the corresponding author on reasonable request.
Ethics statements
Patient consent for publication
Not applicable.
Ethics approval
The study protocol was approved by the Institutional Review Board (IRB) of the Centre Suisse de Recherches Scientifiques en Côte d’Ivoire (CSRS; Abidjan, Côte d’Ivoire) and the Comité National d’Ethique des Sciences de la Vie et de la Santé (CNESVS; reference number: 100-18/MSHP/CVESVS-km). In South Africa, approval was granted by the research ethics committee of the Nelson Mandela University in Gqeberha (reference number: H18-HEA-HMS-006) and the Eastern Cape Departments of Education and Health. In Tanzania, the study protocol was approved by the responsible ethics committee at the Ifakara Health Institute (IHI-IRB; reference number: # IHI/IRB/No 39-2018), the National Institute for Medical Research (NIMR; reference number: NIMR/HQ/R.8a/Vol. IX/3137) and the Tanzania Food and Drugs Authority (TFDA; reference number: TMDA0019/CTR/0016/05). Children who suffered from severe medical conditions and/or malnourishment (as diagnosed by a nurse, following national guidelines) were referred to local clinics. Ethical approval was also obtained from the ‘Ethikkommission Nordwest- und Zentralschweiz’ in Switzerland (EKNZ; reference number: Req-2018-00608).
References
- 1.American College of Sports Medicine . ACSM’s health-related physical fitness assessment manual. Philadelphia: Lippincott Williams & Wilkins, 2013. [Google Scholar]
- 2.Fredriksen PM, Mamen A, Hjelle OP, et al. Handgrip strength in 6–12-year-old children: the health oriented Pedagogical project (HOPP). Scand J Public Health 2018;46:54–60. 10.1177/1403494818769851 [DOI] [PubMed] [Google Scholar]
- 3.Wong SL. Grip strength reference values for Canadians aged 6 to 79: Canadian health measure survey, 2007 to 2013. Health Reports 2016;27:3–10. [PubMed] [Google Scholar]
- 4.Wang M, Leger AB, Dumas GA. Prediction of back strength using anthropometric and strength measurements in healthy females. Clinical Biomechanics 2005;20:685–92. 10.1016/j.clinbiomech.2005.03.003 [DOI] [PubMed] [Google Scholar]
- 5.Ortega FB, Cadenas-Sánchez C, Sánchez-Delgado G, et al. Systematic review and proposal of a field-based physical fitness-test battery in preschool children: the PREFIT battery. Sports Med 2015;45:533–55. 10.1007/s40279-014-0281-8 [DOI] [PubMed] [Google Scholar]
- 6.Ruiz JR, Castro-Pinero J, Espana-Romero V, et al. Field-based fitness assessment in young people: the alpha health-related fitness test battery for children and adolescents. Br J Sports Med 2011;45:518–24. 10.1136/bjsm.2010.075341 [DOI] [PubMed] [Google Scholar]
- 7.Ploegmakers JJW, Hepping AM, Geertzen JHB, et al. Grip strength is strongly associated with height, weight and gender in childhood: a cross sectional study of 2241 children and adolescents providing reference values. J Physiother 2013;59:255–61. 10.1016/S1836-9553(13)70202-9 [DOI] [PubMed] [Google Scholar]
- 8.Gómez-Campos R, Andruske CL, Arruda Mde, de Arruda M, et al. Normative data for handgrip strength in children and adolescents in the Maule region, Chile: evaluation based on chronological and biological age. PLoS One 2018;13:e0201033. 10.1371/journal.pone.0201033 [DOI] [PMC free article] [PubMed] [Google Scholar]
- 9.Round JM, Jones, DA, Honour JW, et al. Hormonal factors in the development of differences in strength between boys and girls during adolescence: a longitudinal study. Ann Hum Biol 1999;26:49–62. 10.1080/030144699282976 [DOI] [PubMed] [Google Scholar]
- 10.Doré E, Martin R, Ratel S, et al. Gender differences in peak muscle performance during growth. Int J Sports Med 2005;26:274–80. 10.1055/s-2004-821001 [DOI] [PubMed] [Google Scholar]
- 11.Chun S-W, Kim W, Choi KH. Comparison between grip strength and grip strength divided by body weight in their relationship with metabolic syndrome and quality of life in the elderly. PLoS One 2019;14:e0222040. 10.1371/journal.pone.0222040 [DOI] [PMC free article] [PubMed] [Google Scholar]
- 12.Häger-Ross C, Rösblad B. Norms for grip strength in children aged 4-16 years. Acta Paediatr 2002;91:617–25. 10.1111/j.1651-2227.2002.tb03290.x [DOI] [PubMed] [Google Scholar]
- 13.Peterson MD, Zhang P, Saltarelli WA, et al. Low muscle strength thresholds for the detection of cardiometabolic risk in adolescents. Am J Prev Med 2016;50:593–9. 10.1016/j.amepre.2015.09.019 [DOI] [PubMed] [Google Scholar]
- 14.Dodds RM, Syddall HE, Cooper R, et al. Global variation in grip strength: a systematic review and meta-analysis of normative data. Age Ageing 2016;45:209–16. 10.1093/ageing/afv192 [DOI] [PMC free article] [PubMed] [Google Scholar]
- 15.Ho FKW, Celis-Morales CA, Petermann-Rocha F, et al. The association of grip strength with health outcomes does not differ if grip strength is used in absolute or relative terms: a prospective cohort study. Age Ageing 2019;48:684–91. 10.1093/ageing/afz068 [DOI] [PubMed] [Google Scholar]
- 16.Norman K, Stobäus N, Gonzalez MC, et al. Hand grip strength: outcome predictor and marker of nutritional status. Clinical Nutrition 2011;30:135–42. 10.1016/j.clnu.2010.09.010 [DOI] [PubMed] [Google Scholar]
- 17.Wu Y, Wang W, Liu T, et al. Association of grip strength with risk of all-cause mortality, cardiovascular diseases, and cancer in community-dwelling populations: a meta-analysis of prospective cohort studies. J Am Med Dir Assoc 2017;18:551.e17–551.e35. 10.1016/j.jamda.2017.03.011 [DOI] [PubMed] [Google Scholar]
- 18.Vancampfort D, Stubbs B, Firth J, et al. Handgrip strength, chronic physical conditions and physical multimorbidity in middle-aged and older adults in six low- and middle income countries. Eur J Intern Med 2019;61:96–102. 10.1016/j.ejim.2018.11.007 [DOI] [PubMed] [Google Scholar]
- 19.Newman AB, Kupelian V, Visser M, et al. Strength, but not muscle mass, is associated with mortality in the health, aging and body composition study cohort. The Journals of Gerontology Series A: Biological Sciences and Medical Sciences 2006;61:72–7. 10.1093/gerona/61.1.72 [DOI] [PubMed] [Google Scholar]
- 20.Gubelmann C, Vollenweider P, Marques-Vidal P. Association of grip strength with cardiovascular risk markers. Eur J Prev Cardiol 2017;24:514–21. 10.1177/2047487316680695 [DOI] [PubMed] [Google Scholar]
- 21.Mainous AG, Tanner RJ, Anton SD, et al. Grip strength as a marker of hypertension and diabetes in healthy weight adults. Am J Prev Med 2015;49:850–8. 10.1016/j.amepre.2015.05.025 [DOI] [PMC free article] [PubMed] [Google Scholar]
- 22.Andersen K, Rasmussen F, Held C, et al. Exercise capacity and muscle strength and risk of vascular disease and arrhythmia in 1.1 million young Swedish men: cohort study. BMJ 2015;351:h4543. 10.1136/bmj.h4543 [DOI] [PMC free article] [PubMed] [Google Scholar]
- 23.Peterson MD, Saltarelli WA, Visich PS, et al. Strength capacity and cardiometabolic risk clustering in adolescents. Pediatrics 2014;133:e896–903. 10.1542/peds.2013-3169 [DOI] [PMC free article] [PubMed] [Google Scholar]
- 24.Steene-Johannessen J, Anderssen SA, Kolle E, et al. Low muscle fitness is associated with metabolic risk in youth. Med Sci Sports Exerc 2009;41:1361–7. 10.1249/MSS.0b013e31819aaae5 [DOI] [PubMed] [Google Scholar]
- 25.Cohen DD, Gómez-Arbeláez D, Camacho PA, et al. Low muscle strength is associated with metabolic risk factors in Colombian children: the ACFIES study. PLoS One 2014;9:e93150. 10.1371/journal.pone.0093150 [DOI] [PMC free article] [PubMed] [Google Scholar]
- 26.Ortega FB, Silventoinen K, Tynelius P, et al. Muscular strength in male adolescents and premature death: cohort study of one million participants. BMJ 2012;345:e7279. 10.1136/bmj.e7279 [DOI] [PMC free article] [PubMed] [Google Scholar]
- 27.Gerber M, Ayekoé SA, Beckmann J, et al. Effects of school-based physical activity and multi-micronutrient supplementation intervention on growth, health and well-being of schoolchildren in three African countries: the KaziAfya cluster randomised controlled trial protocol with a 2 × 2 factorial design. Trials 2020;21. 10.1186/s13063-019-3883-5 [DOI] [PMC free article] [PubMed] [Google Scholar]
- 28.Wind AE, Takken T, Helders PJM, et al. Is grip strength a predictor for total muscle strength in healthy children, adolescents, and young adults? Eur J Pediatr 2010;169:281–7. 10.1007/s00431-009-1010-4 [DOI] [PubMed] [Google Scholar]
- 29.Ruiz JR, Castro-Piñero J, España-Romero V, et al. Field-based fitness assessment in young people: the alpha health-related fitness test battery for children and adolescents. Br J Sports Med 2011;45:518–24. 10.1136/bjsm.2010.075341 [DOI] [PubMed] [Google Scholar]
- 30.WHO . Who guidelines on drawing blood: best practices in phlebotomy. Geneva, 2010. [PubMed] [Google Scholar]
- 31.Parikh P, Mochari H, Mosca L. Clinical utility of a fingerstick technology to identify individuals with abnormal blood lipids and high-sensitivity C-reactive protein levels. Am J Health Promot 2009;23:279–82. 10.4278/ajhp.071221140 [DOI] [PMC free article] [PubMed] [Google Scholar]
- 32.West SG, Finch JF, Curran PJ. Structural equation models with nonnormal variables: Problems and remedies. In: Hoyle RH, ed. Structural equation modeling. concepts, issues, and applications. Thousand Oakes: Sage, 1995: 56–75. [Google Scholar]
- 33.Norman K, Stobäus N, Gonzalez MC, Cristina Gonzalez M, et al. Hand grip strength: outcome predictor and marker of nutritional status. Clinical Nutrition 2011;30:135–42. 10.1016/j.clnu.2010.09.010 [DOI] [PubMed] [Google Scholar]
- 34.Kim Y, Wijndaele K, Lee D-C, et al. Independent and joint associations of grip strength and adiposity with all-cause and cardiovascular disease mortality in 403,199 adults: the UK Biobank study. Am J Clin Nutr 2017;106:773–82. 10.3945/ajcn.117.156851 [DOI] [PMC free article] [PubMed] [Google Scholar]
- 35.Kim H, Kwon O. Higher diet quality is associated with lower odds of low hand grip strength in the Korean elderly population. Nutrients 2019;11:1487. 10.3390/nu11071487 [DOI] [PMC free article] [PubMed] [Google Scholar]
- 36.Thorpe, Jr. RJ, Simonsick E, Zonderman A, et al. Association between race, poverty status and grip strength in middle to old age adults. Ethn Dis 2016;26:493–500. 10.18865/ed.26.4.493 [DOI] [PMC free article] [PubMed] [Google Scholar]
- 37.Magnussen CG, Schmidt MD, Dwyer T, et al. Muscular fitness and clustered cardiovascular disease risk in Australian youth. Eur J Appl Physiol 2012;112:3167–71. 10.1007/s00421-011-2286-4 [DOI] [PubMed] [Google Scholar]
- 38.Stavnsbo M, Resaland GK, Anderssen SA, et al. Reference values for cardiometabolic risk scores in children and adolescents: suggesting a common standard. Atherosclerosis 2018;278:299–306. 10.1016/j.atherosclerosis.2018.10.003 [DOI] [PubMed] [Google Scholar]
- 39.Ashdown-Franks G, Stubbs B, Koyanagi A, et al. Handgrip strength and depression among 34,129 adults aged 50 years and older in six low- and middle-income countries. J Affect Disord 2019;243:448–54. 10.1016/j.jad.2018.09.036 [DOI] [PubMed] [Google Scholar]
- 40.Gąsior JS, Pawłowski M, Williams CA, et al. Assessment of maximal isometric hand grip strength in school-aged children. Open Med 2018;13:22–8. 10.1515/med-2018-0004 [DOI] [PMC free article] [PubMed] [Google Scholar]
Associated Data
This section collects any data citations, data availability statements, or supplementary materials included in this article.
Supplementary Materials
bmjopen-2021-052326supp002.pdf (351.9KB, pdf)
bmjopen-2021-052326supp001.pdf (758KB, pdf)
Data Availability Statement
Data are available on reasonable request. The raw datasets are available from the corresponding author on reasonable request.