Abstract
CO, one of the most important trace gases, regulates tropospheric methane, hydroxyl radical, and ozone contents. Ten to 25% of the estimated global CO flux may be consumed by soils annually. Depth profiles for 14CO oxidation and CO concentration indicated that CO oxidation occurred primarily in surface soils and that photooxidation of soil organic matter did not necessarily contribute significantly to CO fluxes. Kinetic analyses revealed that the apparent Km was about 18 nM (17 ppm) and the Vmax was 6.9 μmol g (fresh weight)−1 h−1; the apparent Km was similar to the apparent Km for atmospheric methane consumption, but the Vmax was more than 100 times higher. Atmospheric CO oxidation responded sensitively to soil water regimes; decreases in water content in initially saturated soils resulted in increased uptake, and optimum uptake occurred at water contents of 30 to 60%. However, extended drying led to decreased uptake and net CO production. Rewetting could restore CO uptake, albeit with a pronounced hysteresis. The responses to changing temperatures indicated that the optimum temperature for net uptake was between 20 and 25°C and that there was a transition to net production at temperatures above 30°C. The responses to methyl fluoride and acetylene indicated that populations other than ammonia oxidizers and methanotrophs must be involved in forest soils. The response to acetylene was notable, since the strong initial inhibition was reversed after 12 h of incubation; in contrast, methyl fluoride did not have an inhibitory effect. Ammonium did not inhibit CO uptake; the level of nitrite inhibition was initially substantial, but nitrite inhibition was reversible over time. Nitrite inhibition appeared to occur through indirect effects based on abiological formation of NO.
Tropospheric methane concentrations exceed tropospheric carbon monoxide concentrations (100 to 300 ppb) by up to 17-fold (16, 51). However, CO emission (about 2,500 Tg year−1 [16, 35]) exceeds methane emission by about fivefold. The discrepancy in the values is due to the high rate of reaction between CO and hydroxyl radical (OH·), the major tropospheric oxidant (16, 50). As a result of its reactivity and flux, CO is a critical component of atmospheric chemical systems and directly and indirectly affects numerous trace gases (16, 21, 34, 35, 50, 51).
Compared with methane biogeochemistry, relatively little is known about CO biogeochemistry (11). The anthropogenic sources and atmospheric fates of CO have been the subjects which have received the greatest attention since CO contributes to ground level ozone (51) and since projected indirect greenhouse warming due to increasing CO concentrations is equivalent to the direct effects of increasing levels of nitrous oxide (18). Nonetheless, a series of early studies and more recent work indicated that consumption of atmospheric CO by soils has a significant impact on the global CO budget (2, 11, 16), although the amount consumed (190 to 630 Tg year−1) is controversial (29, 40). However, neither the microbiology of CO consumption nor control of microbial activity is well understood. The relevant microbial populations remain unknown (11), but they may include populations of methanotrophs, ammonia oxidizers, and CO-oxidizing heterotrophs (e.g., carboxydotrophs). The key determinants of CO oxidation rates include temperature and water content (12, 14, 19, 22, 38, 47), but a variety of other parameters (e.g., salts, nitrogen sources, and organic substrates) may also affect activity, as is the case for methane oxidation.
In this study the distribution of CO oxidizers and CO oxidation was examined by using rate estimates and small-scale CO depth profiles. The soil water regimes studied involved both wetting and drying regimes in order to simulate conditions typically encountered in situ. Responses to temperature included assays of active and microwave-inactivated soils so that CO oxidation and abiological CO production could be studied separately. The relevant functional groups were analyzed by examining responses to potential inhibitors and to various inorganic and organic substrates.
MATERIALS AND METHODS
Sampling sites in a mixed hardwood-conifer forest at the Darling Marine Center (DMC) have been described previously (1, 30, 31). The soils at these sites have been classified as Typic Haplorthods that have organic (O) horizons that vary in thickness (5 to >10 cm); there is an abrupt transition to a relatively shallow mineral (A) horizon. The O and A horizon pH values range from 3.8 to 4.7; the average organic contents of the O and A horizons are about 45 and 5%, respectively (1). The water contents vary seasonally from saturation in the spring to <10% during dry periods in the summer and early fall. The temperatures vary similarly; minimum temperatures of <0°C occur in the winter, and maximum temperatures of approximately 20°C occur in the summer.
Soils were collected by using aluminum core tubes with an inside diameter of 7.5 cm. Cores were extruded from the tubes and then sectioned as necessary at intervals of 2 cm or more after the litter layer was removed. A horizon soils were sieved (2-mm screen) to remove small stones and stems. Soils were used at the ambient water contents, or in some cases the water contents were adjusted as necessary by air drying or by wetting with deionized water. Typically, 2.5 to 10 g (fresh weight) of soil was transferred into a 110-cm3 jar; soils were amended as necessary with aqueous solutions of salts or other substrates. The jars were sealed with silicon stoppers and incubated at the ambient laboratory temperature (20 to 22°C) unless otherwise specified. Headspace samples were removed at intervals and used either for a radioassay or a gas chromatographic analysis as described below.
Depth profiles for CO in the soil atmosphere were determined as described below by using soils at an unmanaged pine forest and a cultivated field at the University of Georgia Agriculture Experiment Station, Griffin, Ga., during November 1997. At the time of sampling, the cultivated field had been harvested, and the surface was largely bare. The soils at the sites used have not been classified by using contemporary U.S. Department of Agriculture categories but have been described as ultisols of the Lloyd series. At the field and forest sites the soil temperatures varied seasonally between <10 and >40°C and between <10 and 32°C, respectively, and the water contents varied between 6 and 15% and between 6 and 96%, respectively.
Depth profiles.
The patterns of CO oxidation with depth in the DMC soils were determined by adding 3.7 kBq of 14CO (final total CO concentration, <1 ppm) to the headspaces of jars containing 10 g (fresh weight) of soil obtained from selected depths. 14CO was prepared by using a [14C]formate stock solution (3). Subsamples (1 cm3) were obtained at intervals from the jar headspaces with a needle and syringe and used for 14CO2 production assays. 14CO2 was absorbed with 2 ml of 0.1 N KOH in a sealed scintillation vial. Levels of radioactivity were determined by liquid scintillation counting with an LKB Rackbeta model 1219 counter after 10 ml of Scintiverse II scintillation fluid (Fisher Scientific, Inc.) was added. A parallel set of soil samples was assayed to determine rates of atmospheric methane utilization by previously described methods (1).
In situ CO concentration depth profiles for the pine forest and cultivated soils were determined by using a 1-cm3 syringe fitted with a 50-mm-long 26-gauge side port needle positioned with a micromanipulator at 2.5- to 5-mm intervals. The first samples of the pine forest and cultivated soils were obtained at the O horizon and the soil surface, respectively. A 1-cm3 sample was obtained slowly (sampling time, about 60 s); the syringe was then raised, and its contents were rapidly analyzed in the field by using gas chromatography as described below. Subsequent samples were collected by repositioning the syringe at the same entry point in the soil but at greater depths. Profiles at both sites were obtained initially with ambient illumination. Immediately after this, the soil surface was darkened for 30 min by using a tarp. A second set of profiles was then obtained in near darkness (the photosynthetically active radiation was less than 10 microeinsteins cm−2 s−1) with the tarp in place.
CO uptake kinetics.
Vmax and apparent Km values were determined by using 3-g (fresh weight) samples of DMC O horizon soils (water content, 38%) incubated in jars with various headspace CO concentrations up to 25 ppm. At each concentration, the uptake rates were determined by performing short-term headspace assays (see below). The net uptake rates were calculated by using a linear regression for high CO concentrations or the method of Conrad and Seiler (12) for low concentrations; the rates were plotted as a function of concentration, and kinetic parameters were estimated by nonlinear curving fitting by using Kaleidagraph software and the Michaelis-Menten model.
Responses to variations in water content.
Subsamples of a large pooled sample of DMC O or A horizon soil were incubated in sealed jars as described above at the ambient laboratory temperature with atmospheric CO. After the net atmospheric CO oxidation rate was determined at the ambient field water content, the jars were opened, and the subsamples were mixed with the parent sample, which was then air dried briefly at the ambient laboratory temperature. A portion of the material was removed and used for a gravimetric analysis of the water content. New subsamples were transferred to the jars, and the net rate of CO oxidation (or production) was determined again. This cycle was repeated until the desired minimum water content was reached. The soil water content was then increased by adding deionized water stepwise, and the oxidation rates were determined again.
Responses to variations in temperature.
Parallel sets of DMC O horizon soils and sieved A horizon soils were incubated in triplicate with the ambient atmospheric CO concentrations in sealed jars as described above at temperatures ranging from 0 to 40°C. Net rates of CO oxidation (or production) were determined by performing short-term (<20-min) time course assays with jar headspace contents. Blanks (no soil) revealed that CO off-gassing from jars and stoppers was negligible. In addition, CO production rates were determined as a function of incubation temperature for soils that had been microwaved three times for 60 s each time with a nitrogen headspace to inhibit microbial CO consumption.
Responses to inhibitors and nitrogenous substrates.
The effects of methyl fluoride and acetylene on 14CO oxidation by DMC O horizon soils were assayed by adding inhibitors individually to jar headspaces at a final concentration of 1%. The incubation times for the first trial were short (about 30 min). In a second trial acetylene was added at a concentration of 1%, and oxidation was monitored for an extended period (24 h). Headspace 14CO2 concentrations were determined at intervals by performing a radioassay as described above. Methyl fluoride and acetylene inhibit both ammonia oxidizers and methanotrophs at the concentration used (27).
The effects of ammonium and nitrite were assayed after 1 μmol of N g (fresh weight)−1 was added to soil samples in 110-cm3 jars (10 and 2.5 g [fresh weight] for the ammonium and nitrite assays, respectively). Ammonium was added as a chloride salt, while nitrite was added as a sodium salt; in both cases 100 μl g (fresh weight) of soil−1 was added. The jars were sealed after the soil was mixed and the salts were added gently. For assays involving ammonium, 14CO was added to jar headspaces and time courses of 14CO2 production were determined as described previously. Effects of ammonium were also determined by monitoring the headspace concentrations of stable CO in a separate experiment.
The responses to nitrite were determined by using time courses of stable CO alone. CO oxidation in jars that were sealed immediately after nitrite was added was monitored, and soils were also incubated in jars for 1 h without stoppers after nitrite was added to allow gas exchange between the soils and the ambient laboratory atmosphere. Subsequently, the jars were sealed and the rates of CO oxidation were determined as described above. Two sets of triplicate soils were used for the nitrite amendment experiments and for unamended controls. Rates of CO oxidation were determined for both sets before nitrite was added as well as after nitrite was added.
CO analysis.
The samples for CO analysis were routinely assayed by using a reduced gas detector (model RGA3; Trace Analytical). The detection limit for CO was <5 ppb with precision of 1% or better. Signals were detected and analyzed by using MacIntegrator software and acquisition hardware operating at 18 MHz. The instrument response was standardized by using a National Oceanic and Atmospheric Administration-CMDL primary certified standard (91.9 ppb) and secondary standards (267.6 ppb; Maine Oxy, Inc.). Headspace samples and other samples were assayed immediately after they were collected. The incubation times used for the various assays described above were too short for interference from CO off-gassing by stoppers, syringes, or incubation vessels.
During assays involving nitrite addition, an unexpected peak appeared immediately after the typical hydrogen and CO peaks. Although it has not been reported previously that the reduced gas detector can detect nitric oxide (NO), the unknown peak was identified as NO based on the following observations: (i) no response was detected for nitrous oxide at percent concentrations; (ii) the unknown peak appeared only after nitrite was added to soils, not after nitrate or ammonium was added, and the rate of appearance was rapid; (iii) the peak was produced with both autoclaved and fresh soils; (iv) the peak was produced immediately after nitrite was mixed with acidic ferrous sulfate under anoxic conditions (this system is known to produce NO but not NO2); and (v) an identical retention time and identical peak symmetry were observed for a 1-ppm NO standard (Scott-Marin, Inc.). The lower limit for detection of NO with the CO analyzer was about 1 ppm; the maximum values observed during incubation of soil with nitrite were approximately 10 ppm.
RESULTS
Depth profiles.
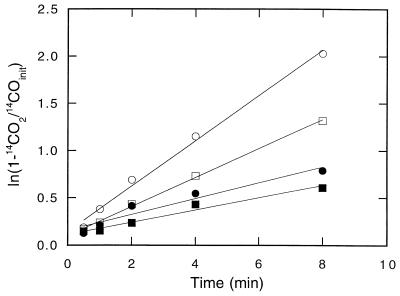
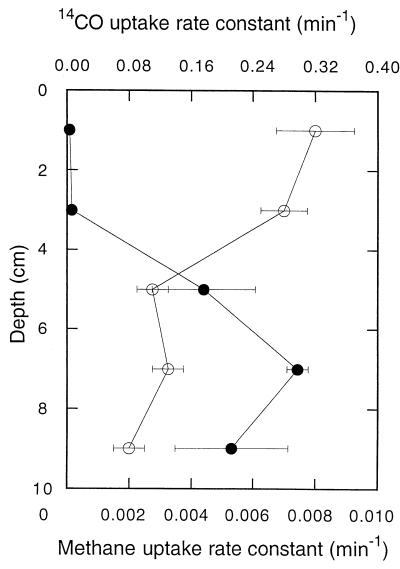
14CO was oxidized rapidly at all depths in DMC forest soils (Fig. 1). 14CO2 was the primary product of 14CO consumption, accounting for approximately 90% of the radiolabel added. The remainder of the 14CO2 was apparently incorporated into biomass since additional 14CO2 did not accumulate during extended incubation or after stable CO was added. 14CO2 accumulation from 14CO fit a simple exponential pattern (e.g., 1 − e−kt, where k is a first-order rate constant and t is time) from which 14CO oxidation rate constants were estimated by linear regression analysis. The oxidation rate constants were greatest in the upper 4 cm (O horizon) of a soil profile and decreased approximately twofold with depth in the A horizon (Fig. 2). In contrast, the methane consumption rate constants were negligible in the O horizon, reached a maximum in the uppermost A horizon, and then decreased with depth (Fig. 2). At all depths, the methane uptake rate constants were considerably lower than the 14CO oxidation rate constants.
FIG. 1.
Time course of 14CO2 production from 14CO in sealed jars containing 10 g (fresh weight) of soil from depths of 0 to 2 cm (○), 2 to 4 cm (□), 4 to 6 cm (●), and 6 to 8 cm (■). The soil core used was obtained from the DMC forest. See Fig. 7 through 9 for untransformed time courses.
FIG. 2.
Depth profiles for 14CO oxidation (○) and atmospheric methane consumption (●) rate constants in DMC forest soils. All rate constants are means based on triplicate determinations; the error bars indicate ±1 standard error.
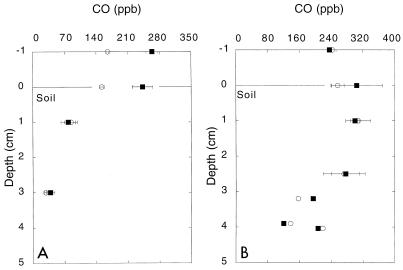
The depth profiles obtained for CO in pine forest and cultivated soils (Fig. 3) revealed patterns which were consistent with net atmospheric CO oxidation and production, respectively. In the cultivated soil, CO was depleted rapidly in the upper 1 cm of the horizon, and the minimum value at a depth of 3 cm was approximately fivefold less than ambient atmospheric values. In the pine forest soil, the CO concentrations remained elevated and greater than the atmospheric levels through the O horizon but declined to values less than the atmospheric values in the A horizon. Chamber-based measurements of CO exchange across the soil surfaces (data not shown) yielded rates of 3.1 and −3.6 mg of CO m−2 day−1 for the cultivated and pine sites, respectively; these values are consistent with the depth profiles. The profiles at both sites were not affected by a 30-min period of darkening.
FIG. 3.
Depth profiles for CO concentrations in the atmospheres of a cultivated soil (A) and a pine forest soil (B) with ambient illumination (○) and after 30 min of shading (photosynthetically active radiation, <20 microeinsteins) (■). The results are means ± standard errors based on triplicate determinations.
CO oxidation kinetics.
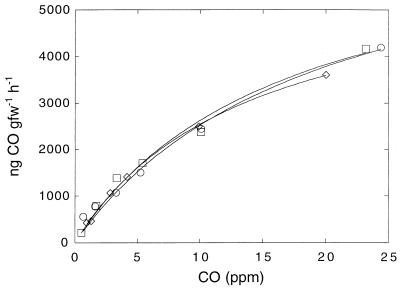
The CO oxidation rates for DMC O horizon forest soils at headspace concentrations ranging from 0.2 to 25 ppm conformed to a Michaelis-Menten kinetic model (Fig. 4). The apparent Km, 16.9 ± 1.7 ppm (18 nM), as well above atmospheric levels (0.1 to 0.3 ppm). The threshold values for CO consumption appeared to be near zero and were apparently determined primarily by rates of abiological CO production. The estimated Vmax, 6.9 ± 0.4 μg g (fresh weight)−1 h−1, was more than 50-fold higher than the rates observed with ambient CO levels.
FIG. 4.
CO oxidation by O horizon soils as a function of initial headspace CO concentration. Different symbols indicate the results obtained for different replicates. gfw, gram (fresh weight).
Responses to water content.
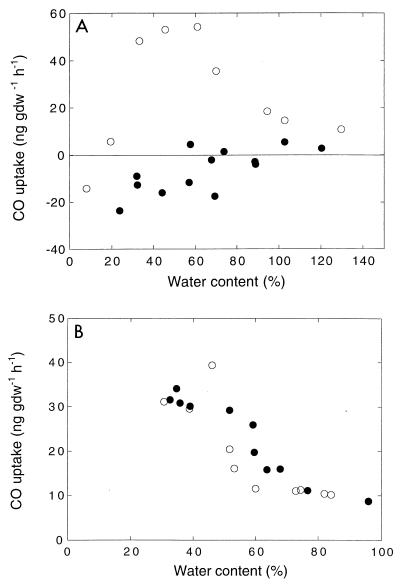
The rate of CO oxidation by DMC O horizon forest soils was optimum at moisture contents of about 30 to 60% (Fig. 5A). As the water content decreased, the oxidation rate decreased sharply, and there was a shift to CO production at water contents of <20%. Recovery from extended or severe drying exhibited a hysteresis with CO production over a water content range from 20 to 80%. In contrast, no hysteresis was observed for more limited drying-wetting cycles (Fig. 5B) that were typical of the conditions in situ. The responses of A horizon soils were similar, but the oxidation rates were lower at all of the water contents examined (data not shown).
FIG. 5.
Response of O horizon soils to changing water content. (A) Results obtained after extended drying (○) and then rewetting (●). (B) Results obtained for drying (○) and rewetting (●) cycles with typical seasonal ranges for water content. gfw, gram (fresh weight).
Response to temperature.
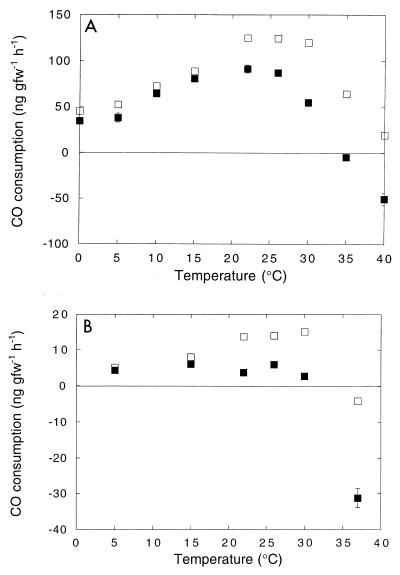
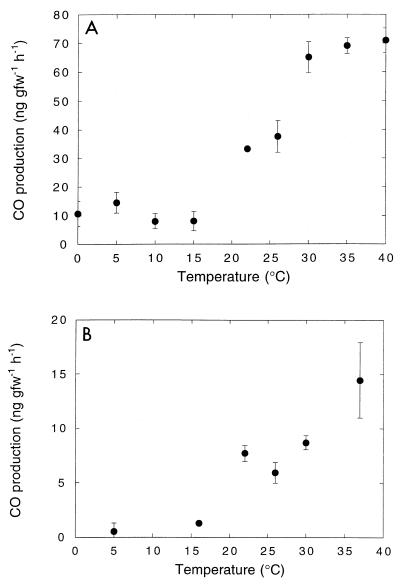
The net CO oxidation rates (gross oxidation minus CO production) in DMC O horizon soils (depth, 0 to 4 cm) increased about twofold as the temperature increased from 0 to 20°C; the rates decreased at higher temperatures, and net CO production occurred at >35°C (Fig. 6A). Gross CO oxidation (corrected for CO production) exhibited a stronger temperature response, and there was a broad optimum at 20 to 30°C. The activation energies (0 to 26°C) for gross and net CO oxidation were −31.8 and −33.2 kJ mol−1 K−1, respectively. The response of A horizon soils (6 to 10 cm) was more muted, and there was little change in gross or net CO oxidation at temperatures between 5 and 30°C (Fig. 6B). Net CO production occurred at temperatures above 35°C. The net and gross CO oxidation rates for A horizon soils were substantially less than the values for O horizon soils at all temperatures. In contrast, CO was produced in microwaved O and A horizon soils at all temperatures, and production was markedly greater in O soils (Fig. 7). In both cases there was little response to temperatures between 0 and 15°C, and there was an abrupt increase in production at temperatures between 15 and 40°C. The activation energies (15 to 40°C) for O and A horizon CO production were −62.3 and −82.3 kJ mol−1 K−1, respectively.
FIG. 6.
(A) Temperature response of O horizon soils. (B) Temperature response of A horizon soils. Symbols: ■, net CO consumption; □, gross CO consumption. The net consumption values are means ± standard errors based on triplicate determinations. gfw, gram (fresh weight).
FIG. 7.
(A) Abiological CO production as a function of temperature in O horizon soils. (B) Abiological CO production as a function of temperature in A horizon soils. The results are means ± standard errors based on triplicate determinations. gfw, gram (fresh weight).
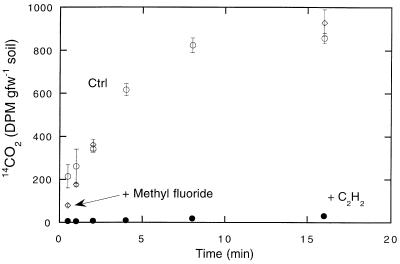
C2H2 and methyl fluoride inhibition.
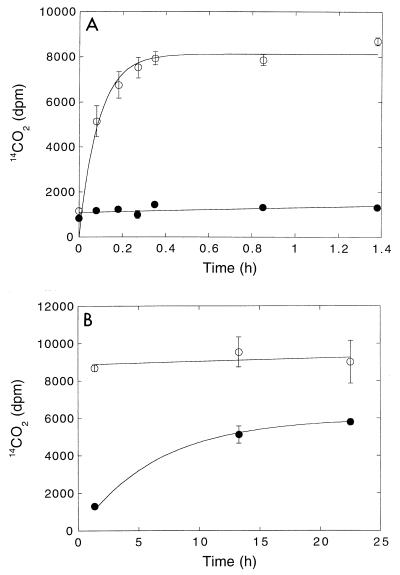
Methyl fluoride (headspace concentration, 1%) did not inhibit 14CO oxidation by DMC O horizon soils during short incubations (<20 min) (Fig. 8). In contrast, the inhibition by 1% acetylene was substantial (>90%) (Fig. 8 and 9A). However, during longer incubations (>1.5 h), acetylene inhibition was markedly diminished, even though the acetylene concentrations remained high. After 24 h, apparent inhibition by acetylene had decreased to 36%.
FIG. 8.
Effect of 1% methyl fluoride (◊) or acetylene (●) on CO consumption by DMC O horizon forest soils. ○, controls. The results are means ± standard errors based on triplicate determinations. gfw, gram (fresh weight).
FIG. 9.
(A) Short-term inhibition of CO consumption by 1% acetylene. (B) Long-term partial recovery from inhibition. Symbols: ●, preparations containing 1% acetylene; ○, controls. The results are means ± standard errors based on triplicate determinations.
Ammonium and nitrite inhibition.
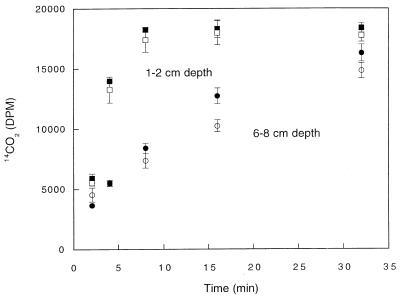
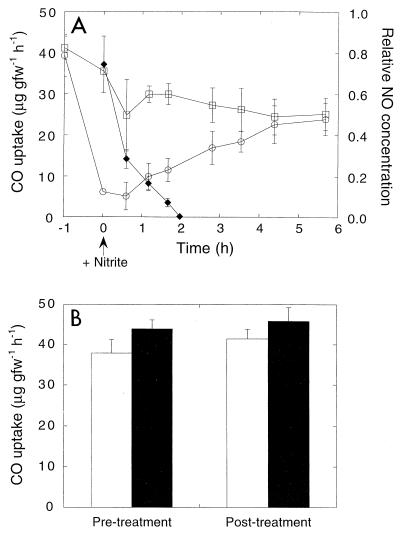
14CO oxidation by DMC O and A horizon soils was not sensitive to the addition of ammonium (Fig. 10). The rates of oxidation were greater for O horizon soils than for A horizon soils, as observed previously (Fig. 2). In contrast, CO oxidation was rapidly and strongly but reversibly inhibited by nitrite (Fig. 11A). Addition of nitrite appeared to result in rapid presumably abiological production of NO (see above). As headspace NO concentrations decreased, inhibition was reversed, and the levels of activity in nitrite-treated soils were comparable to the levels in unamended controls (Fig. 11A). In addition, the rates of CO oxidation in soils that were continuously vented for 1 h after nitrite was added were equivalent to the rates of controls (Fig. 11B). Venting for 1 h after nitrite was added reduced the levels of NO to levels that were not detectable with the CO analyzer (<1 ppm). Nitrous oxide added at a headspace concentration of 1% had no effect (data not shown).
FIG. 10.
Effect of ammonium on CO consumption by O horizon soils (depth, 0 to 2 cm) and A horizon soils (depth, 6 to 8 cm). Open symbols, controls; solid symbols, preparations containing ammonium. The results are means ± standard errors based on triplicate determinations.
FIG. 11.
(A) CO consumption by unamended organic layer soils (□) and soils treated with nitrite (1 μmol g [fresh weight]−1) (○). ⧫, relative NO concentrations. (B) CO consumption by organic layer soils before and after treatment with nitrite. The soils were treated as described above, except that they were vented to eliminate accumulation of NO. Open bars, nitrite-treated soils; solid bars, controls. The results are means ± standard errors based on triplicate determinations. gfw, gram (fresh weight).
DISCUSSION
Atmospheric CO oxidation by soils occurs in a wide variety of systems and has been considered an important component of the global atmospheric CO budget (2, 11, 16). Nonetheless, control of CO oxidation has been addressed in relatively few studies. In a model analysis of global soil CO oxidation, Potter et al. (40) pointed out the need for additional information for a number of key parameters, including the depth distribution of activity and responses to water content and temperature. The need for such information is illustrated by the substantial discrepancy between the model predictions for global soil CO oxidation (15 to 50 Tg of CO year−1) (40) and widely cited extrapolations obtained from a small number of field studies (190 to 630 Tg year−1) (2, 16).
Results presented here indicate that atmospheric CO oxidation in Maine forest soils occurs primarily in the O horizon (Fig. 2, 6, and 10), where the availability of organic matter, the rates of abiological CO production (Fig. 7), and the levels of atmospheric CO are maximal. Organic matter may be particularly important since many CO-oxidizing bacteria can use a wide variety of organic substrates as sole carbon and energy sources (22, 25, 36, 37) and do not depend on low levels of CO alone. Moxley and Smith (39) have described a positive relationship between in vitro CO oxidation rates and organic matter concentrations ranging from about 1 to 7% for a variety of soils. A significant although reduced potential for oxidation also occurs in the underlying mineral or A horizon. However, under in situ conditions CO diffusing from the atmosphere would be largely depleted before it reached this layer. Nonetheless, populations of A horizon CO oxidizers may be maintained by a combination of subsurface CO production, which appears to occur at modest rates even at relatively low temperatures (Fig. 7B), and supplies of organic substrates.
In contrast, atmospheric methane consumption in Maine forest soils occurs almost exclusively in the A horizon at depths significantly removed from the surface (Fig. 2) (1). Organic matter probably plays only a minor role as a determinant of atmospheric methane consumption, since most methanotrophs use only methane or perhaps methane and methanol as carbon sources (5, 8, 11). A number of parameters have been proposed as factors that affect methane consumption; these parameters include ammonium, water potential, and pH (9, 11, 23, 28). Apparently none of them is a major factor that affects CO oxidation.
The 14CO oxidation rate constants for Maine forest soils significantly exceed the rate constants for atmospheric methane consumption (Fig. 2). This also appears to be the case for global estimates of soil CO oxidation (about 6.8 to 22.7 Tmol year−1) and methane consumption (about 3.1 Tmol year−1), although the former is more uncertain than the latter (29). The CO and methane oxidation rate constants reported here differ substantially more than the global rate estimates differ. However, the 14CO oxidation rate constants determined in this study and elsewhere (19) estimate only gross levels of CO oxidation and do not account for in situ CO production. The latter can markedly reduce gross rates relative to net rates, which are included in global estimates.
In accord with the data obtained for Maine forest soils, the CO depth profiles obtained for cultivated Georgia soils indicated that atmospheric CO oxidation occurs primarily in the surface layers. The profiles obtained for a pine forest soil differed significantly and revealed that net CO emission occurs due to CO production in the O horizon. Profiles whose resolutions are similar have not been described previously, but it is evident that for both CO production and CO consumption, only a few centimeters of soil include the relevant zones of activity. A more detailed understanding of these zones could improve the utility of modeling approaches for estimating global soil CO budgets and help to resolve discrepancies between data obtained with models and empirical data (40, 44).
Abiological CO production, which probably accounts for the pine forest CO profiles, is a well-known phenomenon that occurs in litter and organic and mineral soils (13, 14, 39, 44) (Fig. 7). This production has been attributed in part to photochemical organic matter oxidation (12). However, profiles obtained under light and dark conditions for both pine forest and cultivated soils suggest that other processes may be more important (see below). Regardless, pine forest CO profiles and flux measurements indicate that temperate forests may occasionally emit CO. Similar results have been obtained during extended seasonal observations of the site used, as well as the Maine forest site (data not shown). In contrast, previous reports based on European forest data have emphasized net CO oxidation (12, 38, 44). While the reasons for the geographic differences are not known, the results suggest that previous global extrapolations based on European forest data may have overestimated CO oxidation.
Apparent Km values for Maine forest soil CO oxidation (16.9 ± 1.7 ppm) are consistent with values obtained for other systems (15, 19), which range from 5 to 51 ppm. Similar values have been reported for atmospheric methane consumption (6, 8, 11, 17). Previously published Vmax values for CO oxidation (0.2 to 10 μg g [dry weight]−1 h−1 are somewhat less than the Vmax value for the Maine soil (11.1 ± 0.6 μg g [dry weight]−1 h−1), but the database is insufficient to support generalizations at this point. Although the Vmax for Maine forest soil CO oxidation greatly exceeds (by >100-fold) the Vmax for methane consumption (about 10 to 20 ng g [dry weight]−1 h−1) (8), the net in situ CO oxidation rates (maximum, 6 mg of CO m−2 day−1) (29a) exceed the net in situ rates of methane consumption (1 to 3 mg of methane m−2 day−1) (29a) by only severalfold. Moreover, lower incorporation efficiencies for CO than for methane (about 10 and 40%, respectively) (45) result in comparable assimilation rates on a moles-of-carbon basis. When all of the rates are expressed in molar units, the discrepancy between the in situ uptake and Vmax values for the two processes can be accounted for in large part by higher methane concentrations (1.8 versus ∼0.2 ppm). CO production in soils also contributes to a lower rate of consumption of CO from the atmosphere. The substantially higher Vmax for CO oxidation than for methane consumption despite comparable levels of carbon assimilation implies that CO oxidizers depend on substrates other than CO for some fraction or even a large fraction of their biomass, as discussed above.
Soil water content plays similar regulatory roles for CO oxidation and methane consumption, although the two processes occur in different horizons (Fig. 2). Water contents greater than the optimum water contents (30 to 60%) (Fig. 5) result in reversible declines in activity due to decreases in gas transport. At water contents ranging from about 30 to >120%, CO oxidizers do not appear to be affected by water stress or low rates of gas exchange. However, water stress appears to contribute to a hysteresis when the water content is increased to optimal values after it has been at relatively low values (Fig. 5). This hysteresis is qualitatively similar to (if less dramatic than) the hysteresis observed for methane consumption (46). These results suggest that soils exhibit a variety of responses to changing water regimes, but with substantial drying or increased precipitation the rates of net CO oxidation most likely decrease.
The temperature responses of CO dynamics are also complex, involving both biological oxidation and abiological production (Fig. 6 and 7) (14). In accord with previous reports (14), in this study the CO oxidation rates (gross and net) increased modestly at temperatures between 0 and 30°C in O horizon soils and increased less in the A horizon soils (Fig. 6). The lower oxidation rates at all temperatures in the A horizon soils are consistent with the 14CO oxidation depth profiles (Fig. 2), indicating that the O horizon is the dominant site of activity in situ. At temperatures greater than 30°C, abiological CO production became increasingly important, and net CO emission dominated activity at temperatures above 35°C in both O and A horizon soils. The substantially greater CO production in O horizon soils undoubtedly reflected the higher organic matter concentrations. However, the comparable activation energies in the two horizons indicate that the impact of any differences in organic matter quality may be small. Although the role of organic matter in CO production has received some attention (13, 14), additional studies of the qualitative and quantitative roles of specific organic matter fractions (e.g., polysaccharides, proteins, humic compounds) would be useful for developing more refined predictive models for net global CO emission. Nonetheless, the limited temperature sensitivity of both CO oxidation and CO production suggests that with the exception of changes in seasonal extremes, predicted future warming is likely to have only minimal direct effects on the activity in temperate soils. Of course, the coupling between temperature and hydrologic regimes could lead to significant but unpredictable changes.
While the microbes responsible for DMC forest soil CO exchange remain largely unknown (3, 4), several lines of evidence have eliminated the possibility that either methanotrophs or ammonia oxidizers play a significant role; each of these groups can oxidize CO and have been implicated in cultivated soils (5, 7, 24). First, methyl fluoride and acetylene inhibit members of both groups, but methyl fluoride has no effect on 14CO oxidation in soils that exhibit limited (O horizon) or significant (A horizon) methanotrophic activity (Fig. 8). Second, acetylene strongly inhibits 14CO oxidation (Fig. 9A), but it does so only temporarily, a pattern not consistent with activity of either methanotrophs or ammonia oxidizers. A similar response to acetylene has been observed for CO oxidation by bacteria associated with aquatic plant roots (41), but the reversal of acetylene inhibition remains unexplained. Third, the maximum rates of CO oxidation occur in O horizon soils, where methanotrophic activity is minimal (Fig. 2). Finally, substantially greater Vmax values for CO oxidation than for methane consumption (see above) are inconsistent with methanotrophic CO oxidation.
On the basis of pure-culture kinetics, especially high apparent Km values, Conrad et al. (15) argued that known carboxydotrophs cannot account for activity in situ. While the arguments of these authors have merit, recent observations of methanotrophs have suggested that behavior determined under typical laboratory culture conditions does not reliably predict capabilities under in situ conditions (8). In particular, the apparent Km of methanotrophs decreases during substrate-limited growth (8, 20). Carboxydotrophs may behave similarly. In addition, ongoing studies suggest that a carboxydotrophlike activity can be enriched in forest soils with moderately elevated CO concentrations (29a). However, since Bartholomew and Alexander (3) have also implicated several actinomycetes in CO oxidation, it is evident that in situ activity may involve a relatively diverse assemblage of microbes and not a single, highly defined functional group, as is typically the case for methane consumption.
The responses to ammonium (Fig. 10) and nitrite (Fig. 11) also suggest that methanotrophs do not actively oxidize CO in Maine forest soils. Both of these substrates strongly inhibit methane consumption (10, 23, 31–33, 49), but they have no effect (ammonium) or only a temporary effect (nitrite) on CO oxidation. The absence of short-term ammonium inhibition indicates that CO oxidation may be much less sensitive to nitrogen eutrophication and disturbances in nitrogen cycling than methane consumption is. Indeed, agricultural land use may even stimulate CO oxidation in some instances (42, 43), in marked contrast to the almost universally observed inhibition of methane consumption under these conditions (11, 26, 28, 48).
Although nitrite is far less important ecologically than ammonium, the responses to nitrite are nonetheless intriguing. The results described here suggest that nitrite itself is not inhibitory (Fig. 11B). Instead, short-term nitrite inhibition appears to result from the formation and temporary accumulation of NO (Fig. 11A). Once NO is oxidized or otherwise depleted, CO oxidation resumes. These observations indicate that NO and CO dynamics may be linked in soils, perhaps through oxidation by the same organisms, through mutual inhibition of oxidation, or through another as-yet-unknown mechanism. Since soils play important roles in the global budgets of both NO and CO (2, 29, 52) and since CO chemistry and NO chemistry are linked to tropospheric ozone formation (51), interactions between CO metabolism and NO metabolism should be emphasized in future research efforts.
ACKNOWLEDGMENTS
This work was supported in part by NSF grant DEB-9728363.
I thank K. Hardy for excellent technical support in the lab and field and K. Ingram and G. Grenade for access to and assistance with field sites in Griffin, Ga.
Footnotes
Contribution 343 from the Darling Marine Center.
REFERENCES
- 1.Adamsen A P S, King G M. Methane consumption in temperate and subarctic forest soils: rates, vertical zonation, and response to water and nitrogen. Appl Environ Microbiol. 1993;59:485–490. doi: 10.1128/aem.59.2.485-490.1993. [DOI] [PMC free article] [PubMed] [Google Scholar]
- 2.Badr O, Probert S D. Sinks and environmental impacts for atmospheric carbon monoxide. Appl Energ. 1995;50:339–372. [Google Scholar]
- 3.Bartholomew G W, Alexander M. Microbial metabolism of carbon monoxide in culture and in soil. Appl Environ Microbiol. 1979;37:932–937. doi: 10.1128/aem.37.5.932-937.1979. [DOI] [PMC free article] [PubMed] [Google Scholar]
- 4.Bartholomew G W, Alexander M. Microorganisms responsible for the oxidation of carbon monoxide in soil. Environ Sci Technol. 1982;16:300–301. doi: 10.1021/es00099a013. [DOI] [PubMed] [Google Scholar]
- 5.Bédard C, Knowles R. Physiology, biochemistry, and specific inhibitors of CH4, NH4+, and CO oxidation by methanotrophs and nitrifiers. Microbiol Rev. 1989;53:68–84. doi: 10.1128/mr.53.1.68-84.1989. [DOI] [PMC free article] [PubMed] [Google Scholar]
- 6.Bender M, Conrad R. Kinetics of CH4 oxidation in oxic soils exposed to ambient air or high CH4 mixing ratios. FEMS Microbiol Ecol. 1992;101:260–270. [Google Scholar]
- 7.Bender M, Conrad R. Microbial oxidation of methane, ammonium and carbon monoxide, and turnover of nitrous oxide and nitric oxide in soils. Biogeochemistry. 1994;27:97–112. [Google Scholar]
- 8.Benstead J, King G M, Williams H G. Methanol promotes atmospheric methane oxidation by methanotrophic cultures and soils. Appl Environ Microbiol. 1998;64:1091–1098. doi: 10.1128/aem.64.3.1091-1098.1998. [DOI] [PMC free article] [PubMed] [Google Scholar]
- 9.Castro M S, Steudler P A, Mellilo J M, Aber J D, Bowden R D. Factors controlling atmospheric methane consumption by temperate forest soils. Glob Biogeochem Cyc. 1995;9:1–10. [Google Scholar]
- 10.Castro M S, Peterjohn W T, Mellilo J M, Steudler P A, Gholz H L, Lewis D. Effects of nitrogen fertilization on the fluxes of N2O, CH4, and CO2 from soils in a Florida slash pine plantation. Can J For Res. 1994;24:9–13. [Google Scholar]
- 11.Conrad R. Soil microorganisms as controllers of atmospheric trace gases (H2, CO, CH4, OCS, N2O, and NO) Microbiol Rev. 1996;60:609–640. doi: 10.1128/mr.60.4.609-640.1996. [DOI] [PMC free article] [PubMed] [Google Scholar]
- 12.Conrad R, Seiler W G. Role of microorganisms in the consumption and production of atmospheric carbon monoxide by soil. Appl Environ Microbiol. 1980;40:437–445. doi: 10.1128/aem.40.3.437-445.1980. [DOI] [PMC free article] [PubMed] [Google Scholar]
- 13.Conrad R, Seiler W G. Characteristics of abiological CO formation from soil organic matter, humic acids and phenolic compounds. Environ Sci Technol. 1985;19:1165–1169. doi: 10.1021/es00142a004. [DOI] [PubMed] [Google Scholar]
- 14.Conrad R, Seiler W G. Influence of temperature, moisture, and organic carbon on the flux of H2 and CO between soil and atmosphere: field studies in subtropical regions. J Geophys Res. 1985;90(D):5699–5709. [Google Scholar]
- 15.Conrad R, Meyer O, Seiler W G. Role of carboxydobacteria in consumption of atmospheric carbon monoxide by soil. Appl Environ Microbiol. 1981;42:211–215. doi: 10.1128/aem.42.2.211-215.1981. [DOI] [PMC free article] [PubMed] [Google Scholar]
- 16.Crutzen P J, Gidel L T. A two-dimensional photochemical model of the atmosphere. 2. The tropospheric budgets of the anthropogenic chlorocarbons, CO, CH4, CH3Cl and the effect of various NOx sources on tropospheric ozone. J Geophys Res. 1983;88(C):6641–6661. [Google Scholar]
- 17.Czepiel P M, Crill P M, Harriss R C. Environmental factors influencing the variability of methane oxidation in temperate zone soils. J Geophys Res. 1995;100:9359–9364. [Google Scholar]
- 18.Daniel J S, Solomon S. On the climate forcing of carbon monoxide. J Geophys Res. 1998;103(D):13249–13260. [Google Scholar]
- 19.Duggin J A, Cataldo D A. The rapid oxidation of atmospheric CO to CO2 by soils. Soil Biol Biochem. 1985;17:469–474. [Google Scholar]
- 20.Dunfield P F, Liesack W, Henckel T, Knowles R, Conrad R. High-affinity methane oxidation by a soil enrichment culture containing a type II methanotroph. Appl Environ Microbiol. 1999;65:1009–1014. doi: 10.1128/aem.65.3.1009-1014.1999. [DOI] [PMC free article] [PubMed] [Google Scholar]
- 21.Guthrie P D. The CH4-CO-OH conundrum: a simple analytical approach. Glob Biogeochem Cyc. 1989;3:287–298. [Google Scholar]
- 22.Heichel G H. Removal of carbon monoxide by field and forest soils. J Environ Qual. 1973;2:419–423. [Google Scholar]
- 23.Hütsch B, Webster C P, Powlson D S. Methane oxidation in soil as affected by land use, soil pH and N fertilization. Soil Biol Biochem. 1994;26:1613–1622. [Google Scholar]
- 24.Jones R D, Morita R Y. Carbon monoxide oxidation by chemolithotrophic ammonium oxidizers. Can J Microbiol. 1983;29:1545–1551. [Google Scholar]
- 25.Kiessling M, Meyer O. Profitable oxidation of carbon monoxide or hydrogen during heterotrophic growth of Pseudomonas carboxydoflava. FEMS Microbiol Lett. 1982;13:333–338. [Google Scholar]
- 26.King G M. Ecological aspects of methane oxidation, a key determinant of global methane dynamics. Adv Microb Ecol. 1992;12:431–468. [Google Scholar]
- 27.King G M. In situ analyses of methane oxidation associated with the roots and rhizomes of a bur reed, Sparganium eurycarpum, in a Maine wetland. Appl Environ Microbiol. 1996;62:4548–4555. doi: 10.1128/aem.62.12.4548-4555.1996. [DOI] [PMC free article] [PubMed] [Google Scholar]
- 28.King G M. Responses of atmospheric methane consumption by soils to global climate change. Glob Change Biol. 1997;3:351–362. [Google Scholar]
- 29.King G M. Characteristics and significance of atmospheric carbon monoxide consumption by soils. Chemosphere Glob Change Sci. 1999;1:53–63. [Google Scholar]
- 29a.King, G. M. Unpublished data.
- 30.King G M, Adamsen A P S. Response to temperature of methane oxidation in a forest soil and in a culture of the methanotroph Methylomonas rubra. Appl Environ Microbiol. 1992;58:2758–2763. doi: 10.1128/aem.58.9.2758-2763.1992. [DOI] [PMC free article] [PubMed] [Google Scholar]
- 31.King G M, Schnell S. Enhanced ammonium inhibition of methane consumption in forest soils by increasing atmospheric methane. Nature (London) 1994;370:282–284. doi: 10.1128/aem.60.10.3514-3521.1994. [DOI] [PMC free article] [PubMed] [Google Scholar]
- 32.King G M, Schnell S. Ammonium and nitrite inhibition of methane oxidation by Methylobacter albus BG8 and Methylosinus trichosporium OB3b at low methane concentrations. Appl Environ Microbiol. 1994;60:3508–3513. doi: 10.1128/aem.60.10.3508-3513.1994. [DOI] [PMC free article] [PubMed] [Google Scholar]
- 33.King G M, Schnell S. Effects of ammonium and non-ammonium salt additions on methane oxidation by Methylosinus trichosporium OB3b and Maine forest soils. Appl Environ Microbiol. 1998;64:253–257. doi: 10.1128/aem.64.1.253-257.1998. [DOI] [PMC free article] [PubMed] [Google Scholar]
- 34.Law K S, Pyle J A. Modeling trace gas budgets in the troposphere. 2. CH4 and CO. J Geophys Res. 1993;98:18401–18412. [Google Scholar]
- 35.Logan J A, Prather M J, Wofsy S C, McElroy M B. Tropospheric chemistry: a global perspective. J Geophys Res. 1981;86(D):7210–7254. [Google Scholar]
- 36.Meyer O, Schlegel H G. Biology of aerobic carbon monoxide-oxidizing bacteria. Annu Rev Microbiol. 1983;37:277–310. doi: 10.1146/annurev.mi.37.100183.001425. [DOI] [PubMed] [Google Scholar]
- 37.Morsdorf G, Frunzke K, Gadkari D, Meyer O. Microbial growth on carbon monoxide. Biodegradation. 1992;3:61–82. [Google Scholar]
- 38.Moxley J M, Smith K A. Factors affecting utilization of atmospheric CO by soils. Soil Biol Biochem. 1998;30:65–79. [Google Scholar]
- 39.Moxley J M, Smith K A. Carbon monoxide production and emission by some Scottish soils. Tellus Ser B Chem Phys Meteorol. 1998;50:151–162. [Google Scholar]
- 40.Potter C S, Klooster S A, Chatfield R B. Consumption and production of carbon monoxide in soils: a global model analysis of spatial and seasonal variation. Chemosphere. 1996;33:1175–1193. [Google Scholar]
- 41.Rich J J, King G M. Carbon monoxide oxidation by bacteria associated with the roots of freshwater macrophytes. Appl Environ Microbiol. 1998;64:4939–4943. doi: 10.1128/aem.64.12.4939-4943.1998. [DOI] [PMC free article] [PubMed] [Google Scholar]
- 42.Sanhueza E, Cárdenas L, Donoso L, Santana M. Effect of plowing on CO2, CO, CH4, N2O, and NO fluxes from tropical savanna soils. J Geophys Res. 1994;99(D):16429–16443. [Google Scholar]
- 43.Sanhueza E, Donoso L, Scharffe D, Crutzen P J. Carbon monoxide fluxes from natural, managed, or cultivated savanna grasslands. J Geophys Res. 1994;99(D):16421–16427. [Google Scholar]
- 44.Sanhueza E, Dong Y, Scharffe D, Lobert J M, Crutzen P J. Carbon monoxide uptake by temperate forest soils: the effects of leaves and humus layers. Tellus Ser B Chem Phys Meteorol. 1998;50:51–58. [Google Scholar]
- 45.Schnell S, King G M. Stability of methane oxidation capacity to variations in methane and nutrient concentrations. FEMS Microbiol Ecol. 1995;17:285–294. [Google Scholar]
- 46.Schnell S, King G M. Responses of methanotrophic activity in soils and cultures to water stress. Appl Environ Microbiol. 1996;62:3203–3209. doi: 10.1128/aem.62.9.3203-3209.1996. [DOI] [PMC free article] [PubMed] [Google Scholar]
- 47.Spratt H G, Jr, Hubbard J S. Carbon monoxide metabolism in roadside soils. Appl Environ Microbiol. 1981;41:1192–1201. doi: 10.1128/aem.41.5.1192-1201.1981. [DOI] [PMC free article] [PubMed] [Google Scholar]
- 48.Steudler P A, Mellilo J M, Feigl B J, Neill C, Piccolo M C, Cerri C C. Consequence of forest-to-pasture conversion of CH4 fluxes in the Brazilian Amazon basin. J Geophys Res. 1996;101:18547–18554. [Google Scholar]
- 49.Steudler P A, Bowden R D, Mellilo J M, Aber J D. Influence of nitrogen fertilization on methane uptake in temperate forest soils. Nature (London) 1989;341:314–316. [Google Scholar]
- 50.Thompson A M, Cicerone R J. Possible perturbations to atmospheric CO, CH4, and OH. J Geophys Res. 1986;91(D):10853–10864. [Google Scholar]
- 51.Watson R T, Rodhe H, Oeschger H, Siegenthaler U. Greenhouse gases and aerosols. In: Houghton J T, Jenkins G J, Ephraums J J, editors. Climate change: the IPCC scientific assessment. Cambridge, United Kingdom: Cambridge University Press; 1990. pp. 1–40. [Google Scholar]
- 52.Williams E J, Hutchinson G L, Fehsenfeld F C. NOx and N2O emissions from soil. Glob Biogeochem Cyc. 1992;6:351–388. [Google Scholar]


