

Abstract
Maintenance and homeostasis of the stem cell niche (SCN) in the Arabidopsis root is essential for growth and development of all root cell types. The SCN is organized around a quiescent center (QC) maintaining the stemness of cells in direct contact. The key transcription factors (TFs) WUSCHEL‐RELATED HOMEOBOX 5 (WOX5) and PLETHORAs (PLTs) are expressed in the SCN where they maintain the QC and regulate distal columella stem cell (CSC) fate. Here, we describe the concerted mutual regulation of the key TFs WOX5 and PLTs on a transcriptional and protein interaction level. Additionally, by applying a novel SCN staining method, we demonstrate that both WOX5 and PLTs regulate root SCN homeostasis as they control QC quiescence and CSC fate interdependently. Moreover, we uncover that some PLTs, especially PLT3, contain intrinsically disordered prion‐like domains (PrDs) that are necessary for complex formation with WOX5 and its recruitment to subnuclear microdomains/nuclear bodies (NBs) in the CSCs. We propose that this partitioning of PLT‐WOX5 complexes to NBs, possibly by phase separation, is important for CSC fate determination.
Keywords: differentiation, nuclear bodies, prion‐like domains, root stem cells, transcription factor complexes
Subject Categories: Chromatin, Transcription & Genomics; Plant Biology; Stem Cells & Regenerative Medicine
Stem cell maintenance in the Arabidopsis root is controlled by transcription factor complexes containing PLETHORAs and WOX5. Their localization in nuclear bodies (NBs), dependent on the differentiation status, controls cell fate determination.

Introduction
The root system of higher plants is essential for plant life, as it provides anchorage in the soil and access to nutrients and water. It arises from a population of long‐lasting stem cells residing in a structure called root apical meristem (RAM) at the tip of the root. Within the Arabidopsis thaliana RAM, the stem cell niche (SCN) consists of on average four to eight slowly dividing cells, the QC cells, which act as a long‐term reservoir and signaling center by maintaining the surrounding shorter‐lived, proliferating stem cells (also called initials) in a non‐cell autonomous manner (van den Berg et al, 1997; Lu et al, 2021). These stem cells continuously divide asymmetrically, thereby generating new stem cells that are still in contact with the QC. The hereby‐produced daughter cells frequently undergo cell divisions and are shifted further away from the QC to finally differentiate into distinct cell fates. By this mechanism, the position of the stem cells in the root remains the same throughout development and their precise orientation of division leads to the formation of concentrically organized clonal cell lineages representing a spatio‐temporal developmental gradient (Dolan et al, 1993; van den Berg et al, 1997; Benfey & Scheres, 2000). From the inside to the outside, the following root cell tissues develop: vasculature, pericycle, endodermis, cortex, and epidermis plus columella and lateral root cap at the distal root tip (Fig 1A).
Figure 1. WOX5 positively regulates PLT3 expression.

-
ASchematic representation of the Arabidopsis root meristem. The QC cells (red) maintain the surrounding stem cells (initials) outlined in black together building the root stem cell niche (SCN). The different cell types are color coded. QC = quiescent center (red); CSC = columella stem cells (yellow); CC = columella cells (green); LRC = lateral root cap (light purple); ep = epidermis (purple); c = cortex (light turquoise); en = endodermis (dark turquoise); bright turquoise = cortex/endodermis initials; dark purple = epidermis/lateral root cap initials; dark orange = stele initials; stele = light orange; grey dots = starch granules.
-
B, CRepresentative images of pPLT3::erCFP (cyan) expressing and PI‐stained (red) Arabidopsis roots in Col or wox5 background, respectively.
-
DMean fluorescence intensities of the pPLT3::erCFP roots summarized in box and scatter plots. The mean fluorescence intensity of the CFP signal in Col roots was to set to 100%.
-
E, FRepresentative images of pPLT3::PLT3‐YFP (yellow) expressing and FM4‐64‐stained (red) Arabidopsis roots in Col or wox5 mutant background, respectively.
-
GMean fluorescence intensities of the pPLT3::PLT3‐YFP expressing roots summarized in box and scatter plots. The mean fluorescence intensity of the YFP signal in Col roots was to set to 100%.
Data information: (D, G) Box = 25–75% of percentile, whisker = 1.5 interquartile range, − = median, □ = mean value, X = minimum/maximum. The data were statistically analyzed by one‐way ANOVA and Holm–Sidak post‐hoc multiple comparisons test. Asterisks indicate statistically significant differences (α = 0.01). Number of analyzed roots (n) (biological replicates) is indicated for each genotype and results from two technical replicates. (B, C, E, F) Scale bars represent 10 µm. SCN = stem cell niche; PI = propidium iodide; YFP = yellow fluorescent protein; CFP = cyan fluorescent protein.
The necessary longevity and continuous activity of the RAM can only be achieved if its stem cell pool is constantly replenished, since cells are frequently leaving the meristematic region due to continuous cell divisions. Therefore, complex regulatory mechanisms involving phytohormones and key TFs regulate stem cell maintenance and the necessary supply of differentiating descendants (Drisch & Stahl, 2015). Here, the APETALA2‐type PLT TF family and the homeodomain TF WOX5 play important roles (Aida et al, 2004; Sarkar et al, 2007). WOX5 is expressed mainly in the QC, but maintains the surrounding stem cells non‐cell‐autonomously by repressing their differentiation (Sarkar et al, 2007; Pi et al, 2015). Loss of WOX5 causes the differentiation of the CSCs, also called distal stem cells, into starch‐accumulating columella cells (CCs), while increased WOX5 expression causes CSC over‐proliferation. Hence, WOX5 abundance is critical and necessary to suppress premature CSC differentiation (Sarkar et al, 2007; Pi et al, 2015). WOX5 also represses QC divisions, maintaining the quiescence of the QC by repressing CYCLIN D (CYCD) activity within the QC (Forzani et al, 2014).
The auxin‐induced PLTs form a clade of six TFs and act as master regulators of root development, as multiple plt mutants fail to develop functional RAMs (Aida et al, 2004; Galinha et al, 2007; Mähönen et al, 2014). PLT1, 2, 3, and 4 are expressed mainly in and around the QC and form an instructive gradient, which is required for maintaining the balance of stem cell fate and differentiation. This PLT gradient is also necessary for separating auxin responses in the SCN, for the correct positioning of the QC, and the expression of QC markers (Aida et al, 2004; Galinha et al, 2007; Mähönen et al, 2014). Genetically, WOX5 and PLT1 were shown to play an interconnected role in auxin‐regulated CSC fate, whereas PLT1 and PLT3 were found to directly positively regulate WOX5 expression (Ding & Friml, 2010; Shimotohno et al, 2018).
Although PLTs and WOX5 are known for controlling stem cell regulation and maintenance in the Arabidopsis RAM and genetic evidence for cross regulation exists, the underlying molecular mechanisms are until now largely elusive. Here, we show for the first time that the mutual regulation of expression, but importantly also the ability of PLTs to directly interact with and recruit WOX5 to NBs in CSCs controls stem cell homeostasis in the Arabidopsis RAM. NBs are membrane‐less, self‐assembling protein/RNA containing compartments thought to regulate a variety of physiological responses to differential environmental cues like light, temperature, or osmotic changes (Mao et al, 2011; Jung et al, 2020; Meyer, 2020). Therefore, we propose a model in which differential PLT/WOX5 complexes depending on their subnuclear localization in NBs or in the nucleoplasm regulate stem cell fate in the RAM, possibly by phase separation.
Results
WOX and PLTs regulate each other’s expression in the root SCN
WOX5 and PLTs are essential players in distal stem cell maintenance (Aida et al, 2004; Galinha et al, 2007; Sarkar et al, 2007; Pi et al, 2015). This, as well as their overlapping expression and protein localization domains in the root SCN raised the question if they could act together in distal stem cell regulation, where, in comparison to all the other PLTs, particularly PLT3 is highly expressed (Fig 1B) (Galinha et al, 2007). Furthermore, PLT3 was recently predicted as one of the central nodes regulating other QC‐enriched TFs in the underlying gene regulatory network (GRN) within the Arabidopsis root SCN. In contrast, PLT1 and PLT2 were predicted as minor nodes only and PLT4 (BBM) was not predicted as a node (de Luis Balaguer et al, 2017).
First, we tested if WOX5 influences PLT3 expression. Both a transcriptional and translational PLT3 fluorescent reporter line showed a reduced expression in the QC and CSC in a wox5 mutant background to around 57–70% compared to the Col‐0 (Col) wild‐type roots (Fig 1B–G, Appendix Table S3). Next, we addressed, if PLT3 expression is regulated directly or indirectly upon WOX5 induction by using the published Arabidopsis lines 35S::WOX5‐GR (Sarkar et al, 2007) and 35S::WOX5‐GFP‐GR (Berckmans et al, 2020) in quantitative PCR experiments (qPCR) (Appendix Fig S1A, Appendix Table S1) and crosses with pPLT3::erCFP (Galinha et al, 2007) (Appendix Fig S1B–E, Appendix Table S2), respectively. In both independent experiments, we found no change of PLT3 expression 4 h after WOX5 induction. After 21 h of WOX5 induction, we found PLT3 expression significantly upregulated up to two‐fold and therefore, we conclude that PLT3 expression is not directly regulated by WOX5 (Appendix Fig S1B–E, Appendix Table S2). This extends the previously reported regulation of PLT1 expression by WOX5 (Ding & Friml, 2010) and shows that WOX5 positively regulates expression of several PLTs, albeit in an indirect manner. To test if WOX5 expression also depends on PLTs, we produced a transcriptional reporter, which expresses a nuclear‐localized mVenus under control of the WOX5 promoter. In agreement with previous reports, expression of WOX5 in our transcriptional reporter line is confined to the QC and is only weakly expressed in the stele initials (Sarkar et al, 2007; Pi et al, 2015) (Fig 2A).
Figure 2. PLTs constrain the WOX5 expression domain.

-
A–FRepresentative FM4‐64‐stained Arabidopsis roots (grey) expressing pWOX5::mVenus‐NLS (green) in Col, plt2, plt3, and plt2, plt3 double mutant background in longitudinal (A‐D), or transversal (E‐F) optical sections. (E′, F′) Analysis of representative images in (E) and (F) in Imaris to detect and count individual expressing nuclei. (E″, F″) Overlay of 10 roots (biological replicates) showing the area of detected fluorescence (high levels in red, low levels in blue) in Col and plt2, plt3 double mutant roots.
-
GNumber of nuclei (biological replicates) expressing pWOX5::mVenus‐NLS in Col and plt2, plt3 double mutant roots summarized in box and scatter plots.
-
HArea of WOX5 expression in µm2 in Col and plt2, plt3 double mutant roots summarized in box and scatter plots.
Data information: (G, H) Box = 25‐75% of percentile, whisker = 1.5 interquartile range, − = median, □ = mean value, X = minimum/maximum. (G, H) Kruskal–Wallis ANOVA with subsequent Dunn’s test (G) or one‐way ANOVA and post‐hoc Holm–Sidak multiple comparisons test was used to test for statistical significance (H). Asterisks indicate statistically significant differences (α = 0.01). Number of analyzed roots (n) (biological replicates) is indicated for each genotype and results from three technical replicates per genotype. Scale bars represent 10 µm; NLS = nuclear localization signal.
PLTs are known for their redundant function in SCN maintenance, that can be very strong especially when PLT1 is mutated in combination with other PLTs (Aida et al, 2004; Galinha et al, 2007). Because we aimed to look at the rather subtle QC and distal SCN phenotypes, we therefore included only plt2 mutants for our analyses. In plt2 and plt3 single mutants, we observed additional mVenus‐expressing cells in the QC region, which may derive from aberrant periclinal cell divisions of the QC (Fig 2B and C, Appendix Table S4). This effect is even stronger in the plt2, plt3 double mutant roots, where extra cells are found in all observed roots and often even form an additional cell layer of WOX5 expressing cells (Fig 2D).
Previously, it was reported that the Arabidopsis wild‐type QC is composed of four to eight cells with a low division rate (Truernit et al, 2008; Cruz‐Ramírez et al, 2013; Stahl et al, 2013; Lu et al, 2021). We quantified the number of WOX5 expressing cells and the area of WOX5 expression per root by acquiring transverse optical sections through the roots. We observed four to ten WOX5 expressing cells in the Col wild type (Fig 2E and G, Appendix Table S4), whereas we found eight to 14 WOX5 expressing cells and a laterally expanded WOX5 expression domain in the plt2, plt3 double mutants (Fig 2F–H, Appendix Table S4). Taken together, our data show that WOX5 positively regulates PLT expression, here shown for PLT3, whereas PLT2 and PLT3 redundantly restrict WOX5 expression to a limited number of cells at QC position, possibly by negative feedback regulation. These observations are in agreement with a previous report, where a role for PLT1 and PLT2 in confining WOX5 expression was reported (Sarkar et al, 2007).
A novel SCN staining method for simultaneous QC division and CSC differentiation analyses
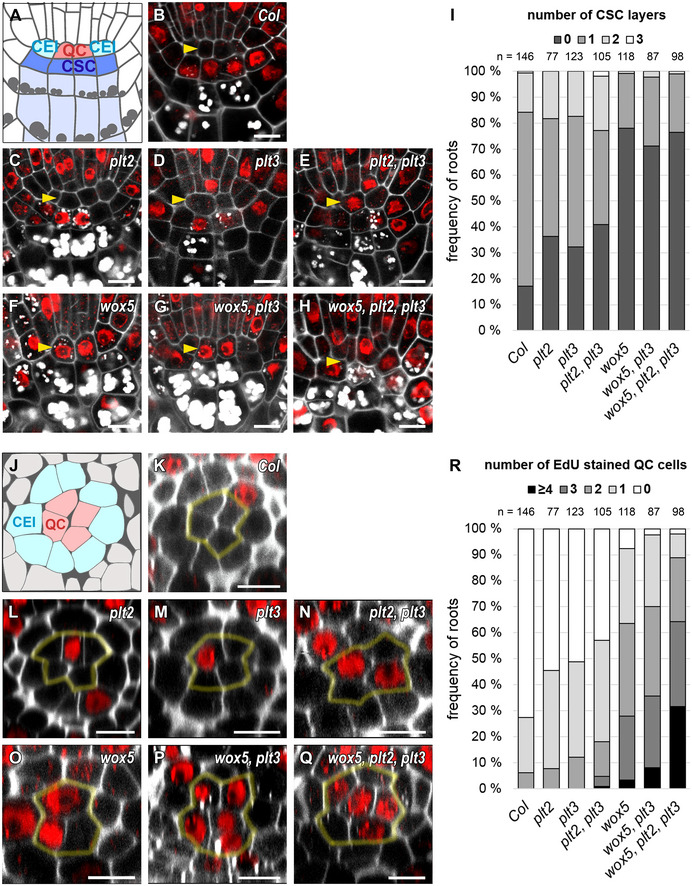
QC cells rarely divide as they provide a long‐term reservoir to maintain the surrounding stem cells (Cruz‐Ramírez et al, 2013; Vilarrasa‐Blasi et al, 2014). As WOX5 and PLTs control QC cell divisions and CSC maintenance (Aida et al, 2004; Galinha et al, 2007; Sarkar et al, 2007; Forzani et al, 2014; Mähönen et al, 2014; Pi et al, 2015), we asked if these two aspects are interdependent. Therefore, we analyzed the cell division rates in the QC and the CSC phenotypes in wild‐type and mutant roots. To assess these two phenotypes and to probe for their interdependency, we needed to measure the number of dividing QC cells and CSC layers within the same root simultaneously. To enable this, we established a novel staining method, named SCN staining, by combining the 5‐ethynyl‐2′‐deoxyuridine (EdU) and modified pseudo Schiff base propidium iodide (mPS‐PI) stainings to simultaneously visualize cell divisions, starch granule distribution as well as cell walls within the same root (Truernit et al, 2008; Schiessl et al, 2012 §; Cruz‐Ramírez et al, 2013). Applying this new staining combination, potential correlations between QC‐divisions and CSC cell fates can be uncovered. The EdU‐staining is used to analyze QC‐divisions by staining nuclei that have gone through the S‐phase, detecting cells directly before, during, and after cell division (Cruz‐Ramírez et al, 2013). However, cell layers and different cell types are hard to distinguish using only EdU staining due to the lack of cell wall staining. Therefore, we additionally applied the mPS‐PI‐method to stain cell walls and starch which is commonly used for CC and CSC cell fate determination (Truernit et al, 2008; Stahl et al, 2009, 2013). CCs are differentiated, starch granule‐containing cells in the distal part of the root mediating gravity perception. They derive from the CSCs that form one or, directly after cell division, two cell layers distal to the QC. The CSCs lack big starch granules and can thereby easily be distinguished from the differentiated CCs by mPS‐PI staining (Truernit et al, 2008; Stahl et al, 2009, 2013) (see Fig 3A, B and I, Appendix Table S5).
Figure 3. plt and wox5 mutants show more CSC differentiation and QC divisions.
-
ASchematic representation of a longitudinal section of an Arabidopsis RM. QC cells are marked in red, CSCs are marked in dark blue, CCs in light blue. Combined mPSPI (grey) and EdU (red) staining for 24 h (SCN staining) to analyze the CSC (A‐I) and QC division phenotype (J‐R) within the same roots are shown.
-
B–HRepresentative images of the SCN staining in Col, and the indicated single, double, and triple mutant roots. QC positions are marked by yellow arrowheads.
-
IAnalyses of the SCN staining for CSC phenotypes. Frequencies of roots showing 0, 1, 2, or 3 CSC layers are plotted as bar graphs.
-
JSchematic representation of a transversal section of an Arabidopsis RM. QC cells are marked in red, CEI initials are marked in turquoise.
-
K–QRepresentative images of transversal sections with QC cells outlined in yellow.
-
RAnalyses of the SCN staining for QC division phenotypes. Frequencies of roots showing 0, 1, 2, 3 or ≥ 4 dividing QC cells are plotted as bar graphs.
Data information: Number of analyzed roots (n) (biological replicates) is indicated for each genotype and results from 2‐5 technical replicates per genotype. QC = quiescent center, CSC = columella stem cell, CEI = cortex endodermis initial, SCN = stem cell niche, mPSPI = modified pseudo‐Schiff propidium iodide, EdU = 5‐ethynyl‐2′‐deoxyuridine, scale bars represent 5 µm.
Source data are available online for this figure.
QC division rate and CSC differentiation correlate in the root SCN
WOX5 was shown to be necessary for CSC maintenance, as loss of WOX5 causes their differentiation, while inducible overexpression of WOX5 leads to enhanced proliferation (Sarkar et al, 2007; Pi et al, 2015; Berckmans et al, 2020; Savina et al, 2020). In agreement with this, we found that the wox5 mutants lack a starch‐free cell layer in 78% of analyzed roots, indicating differentiation of the CSCs, compared to 17% in Col (Fig 3A, B, F and I, Appendix Table S5). In the plt2 and plt3 single mutants, the frequency of roots lacking a CSC layer increases to above 30% (36 and 32%, respectively), and in the plt2, plt3 double mutant to 41% (see Fig 3C–E and I, Appendix Table S5). After overexpression of PLT3‐mV by estradiol induction in wild‐type Col‐0 background, we observed the opposite effect, an increase from 29 to 50% of two CSC layers (see Appendix Fig S2A–F). Therefore, we argue, that the observed CSC phenotypes are due to PLT3 function and are not caused by potential early embryonic defects described previously for multiple plt mutants (Aida et al, 2004).
Interestingly, the wox5, plt3 double mutant as well as the wox5, plt2, plt3 triple mutant show a frequency of differentiated CSCs comparable to the wox5 single mutant (71 and 77%, respectively) (Fig 3G–I, Appendix Table S5). This data suggests that PLTs and WOX5 may act together in the same pathway to maintain CSC homeostasis, as there is no additive effect observable in the multiple mutant roots.
To analyze QC division phenotypes in detail, we quantified the number of EdU‐stained cells in QC position in transversal optical sections. QC cells were identified by their position within the root SCN, as they are located directly distal to the stele initials and surrounded by the CEIs in a circular arrangement (Fig 3A and J). In Col, 27% of the analyzed roots show at least one cell division in the QC within the 24 h staining window (Fig 3J, K and R, Appendix Table S5), which is consistent with already published frequencies (Cruz‐Ramírez et al, 2013). This frequency almost doubles to 45–50% in the plt2 and plt3 single mutants and is even higher in the plt2, plt3 double mutant (57%) (Fig 3L–N and R, Appendix Table S5). Additionally, the plt double mutant roots often show disordered QC regions with a disruption of the circular arrangement of cells surrounding the QC (Fig 3N) which could be a result of uncontrolled divisions. wox5 mutants show a disordered SCN accompanied by a high overall QC cell division frequency of at least one dividing QC cell in 92% of roots (Fig 3O and R) and on average more dividing QC cells per root (Appendix Table S5). The number of dividing QC cells per root increases further in the wox5, plt3 double mutant and is even higher in the wox5, plt2, plt3 triple mutant; here, in one third of the roots all QC cells undergo cell division (Fig 3P–R, Appendix Table S5). Taken together, this data implies an additive effect of PLT2, PLT3, and WOX5 regarding the QC‐division phenotype, suggesting that WOX5 and PLTs act in parallel pathways to maintain the quiescence of the QC.
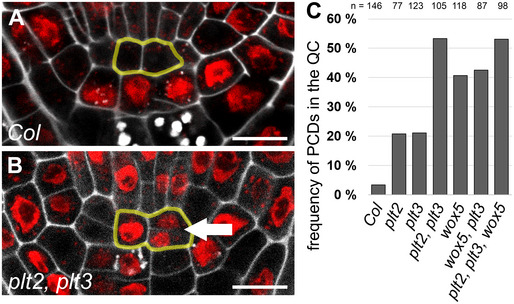
Additionally, we quantified roots showing at least one aberrant periclinal cell division in the QC in longitudinal optical sections (Fig EV1). Whereas the occurrence of these aberrant periclinal divisions in Col wild‐type roots is very rare (3%) (Fig EV1A), it increases in the plt‐single mutants to 21% and in wox5 and wox5, plt3 mutants to around 40% (Fig EV1B and C). We found the most severe phenotypes in the plt2, plt3 double and wox5, plt2, plt3 triple mutants with an occurrence of periclinal QC‐cell divisions in 53% of the observed roots, indicating a synergistic regulatory role of PLTs in periclinal QC cell divisions (Fig EV1B and C, Appendix Table S6).
Figure EV1. plt and wox5 mutants show more periclinal cell divisions in the QC.
-
ARepresentative figure of an Arabidopsis wild‐type root SCN staining. QC cells are outlined in yellow. Scale bars represent 10 µm.
-
BRepresentative figure of an Arabidopsis plt2, plt3 double mutant root SCN staining showing a periclinal cell division (PCD) in the QC (arrow). QC cells are outlined in yellow. Scale bars represent 10 µm.
-
CAnalysis of the PCD phenotype. The frequency of roots (in percent) showing at least one PCD in the QC is plotted as a bar graph. Number of analyzed roots (n) (biological replicates) is indicated for each genotype and results from 2 to 5 technical replicates. PCD = periclinal cell division.
2D plots of SCN staining facilitate assessment of root phenotypes
To visualize correlations of QC division and CSC differentiation, we combined the acquired data in 2D‐plots in which the frequencies of the two phenotypes are color‐coded (Fig 4). This visualization reveals a regular pattern for Col wild‐type roots, which peaks at one CSC layer and no QC divisions (Fig 4A). The pattern of the plt single mutants is more irregular with a shift to less CSC layers (indicating more differentiation) and more EdU‐stained QC cells (indicating more QC divisions) compared to the wild‐type Col roots (Fig 4B and C). The plt2, plt3 double mutants have an additional maximum at a position showing no CSC layer and one divided QC cell, resulting in two phenotypic populations, one at a wild‐type‐like position, the other showing a strong mutant phenotype (Fig 4D). The 2D‐pattern for the wox5 mutant shifts to less CSC‐layers and more QC‐divisions with a maximum at no CSC‐layers and two QC‐divisions (Fig 4E). The QC phenotype is more severe in the wox5, plt3 double mutant towards more cell divisions and is even stronger in the wox5, plt2, plt3 triple mutant which peaks at zero CSC layers and three QC‐divisions (Fig 4F and G). In summary, our data acquired by applying the novel SCN staining demonstrates that higher CSC differentiation correlates with a higher division rate in the QC, possibly to replenish missing stem cells by increased QC divisions.
Figure 4. QC divisions correlate negatively with the number of CSC layers.

-
A–GThe combined results of the SCN staining in Fig 3 are shown as 2D plots to visualize the correlation of the CSC layer and QC division phenotypes. Number of CSC layers are shown on the y axis and the QC division phenotype is shown on the x‐axis. The darker the color, the more roots show the respective phenotype (see color gradient top right indicating the frequencies in percent). Col wild‐type roots show one layer of CSCs and no EdU stained cells (no QC division) after 24 h EdU staining. Number of analyzed roots (n) (biological replicates) is indicated for each genotype and results from 2 to 5 technical replicates per genotype.
Source data are available online for this figure.
PLT3, but not WOX5, localizes to nuclear bodies (NBs)
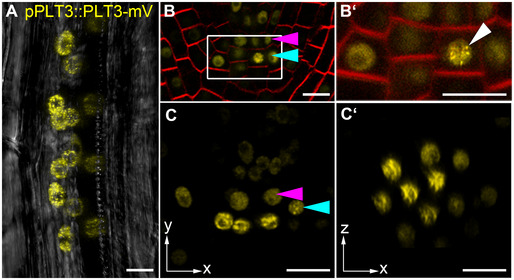
WOX5 and PLT3 are expressed and localize to overlapping domains in the SCN of the Arabidopsis root and based on our results regulate SCN maintenance together. To test for functionality of our generated reporter lines, we used the mVenus (mV) tagged WOX5 and PLT3 versions driven by their own endogenous promoters for rescue experiments in the respective mutant phenotypes in Arabidopsis. We observed a rescue of the wox5 mutant expressing pWOX5::WOX5‐mV (Fig EV2A–C, J and K, Appendix Table S7) and a rescue of the plt3 mutant expressing pPLT3::PLT3‐mV to almost wild‐type Col phenotypes (Fig EV2E, G, J and K, Appendix Table S7), indicating that the labelling with mVenus did not or only very little influence WOX5 or PLT3 functionality. To our surprise, we observed PLT3 localization in bright subnuclear structures, hereafter called NBs, in the PLT3‐mV reporter line. Most frequently, we found PLT3 NBs in young, developing lateral root primordia (LRP) (Fig 5A, Movie EV1) already at stages where PLT1 and PLT2 are not yet expressed (Du & Scheres, 2017). Importantly, we also observed PLT3 NBs in CSCs of some established primary roots, but never in QC cells (Fig 5B and C′). To further examine the PLT3 NBs in a context, where no other PLTs are expressed, we used an estradiol‐inducible system to control expression of FP‐tagged PLT3 and WOX5 transiently in Nicotiana benthamiana (N. benthamiana) leaf epidermal cells (Stahl et al, 2013). In agreement with our observations in Arabidopsis, we found that PLT3 mainly localizes to NBs and to a lesser extend to the nucleoplasm (Fig 6B). We quantified NB formation of PLTs in this transient system using estradiol inducible versions of PLT1‐4 tagged with mVenus by acquiring z‐stacks through the expressing nuclei exactly 5 h after induction. Here, we found that PLT3 forms at least three times more NBs compared to PLT1, PLT2 and PLT4 (see Appendix Fig S3A–E, Appendix Table S8).
Figure EV2. Mutant rescue experiments.

SCN stainings were performed in Arabidopsis thaliana seedlings in the indicated single and double mutant backgrounds expressing either WOX5‐mV, PLT3‐mV or PLT3ΔPrD‐mV driven by their endogenous promoters as well as in Col wild type.
-
A–IThe combined results of the SCN staining are shown as 2D plots. Number of CSC layers is shown on the y axis and the QC division phenotype is shown on the x‐axis. The darker the color, the more roots show the respective phenotype (see color gradient on the right indicating the frequencies).
-
J, KAnalyses of the SCN staining for CSC layer (J) or QC division (K) phenotypes. The frequencies of roots showing 0–3 CSC layers, or 0–4 dividing QC cells are plotted as bar graphs. Number of analyzed roots (n) (biological replicates) is indicated for each genotype and results from 2 to 4 technical replicates. EdU = 5‐ethynyl‐2′‐deoxyuridine; CSC = columella stem cell; QC = quiescent center; W5 = WOX5, P3 = PLT3.
Figure 5. PLT3 localizes to NBs in Arabidopsis thaliana LRPs and CSCs.
-
A–C′PLT3‐mV expression driven by the PLT3 endogenous promoter in LRP (A) and primary root SCN (B‐C′) in plt3 mutant Arabidopsis roots. (A) Representative image of PLT3‐mV expression (yellow) in an LRP showing the subnuclear localization to NBs. Transmitted light image in grey. (B, B′) SCN of an PLT3‐mV expressing FM4‐64‐stained (red) Arabidopsis primary root. The magnification of the CSC layer (B′) shows the subnuclear localization of PLT3 to NBs in a CSC. White arrowhead points at a NB. (C, C’) SCN of an PLT3‐mV expressing Arabidopsis primary root. NBs are visible in the CSC layer in (C, also in the transversal view of the CSC layer C′). Arrowheads in B and C point at the QC (magenta) and CSC (cyan) positions. mV = mVenus; LRP = lateral root primordium; SCN = stem cell niche; NBs = nuclear bodies; CSC = columella stem cell. Scale bars represent 10 µm.
Figure 6. PLT3 PrD domains influence its subnuclear localization.

-
ASchematic representation of PLT3 protein domains. The areas in red are predicted prion‐like domains (PrDs) and were deleted in PLT3ΔPrD‐mV. The areas highlighted in yellow contain polyQ‐stretches and were deleted in PLT3ΔQ‐mV.
-
B–DRepresentative images of PLT3‐mV (B), PLT3ΔQ‐mV (C) and PLT3ΔPrD‐mV (D) in transiently expressing N. benthamiana leaf epidermal cells.
-
E, FPLT3‐mV (E) and PLT3ΔPrD‐mV (F) expression driven by the PLT3 endogenous promoter in lateral root primordia of plt2, plt3 double mutant Arabidopsis roots.
-
G‐I″Co‐expression of PLT3‐mV (G), PLTΔQ‐mV (H) and PLT3ΔPrD‐mV (I) with WOX5‐mCh (G′, H′, I′) in transiently expressing N. benthamiana leaf epidermal cells.
-
J–J‴Expression of PLT3‐mV (J) in transiently expressing N. benthamiana leaf epidermal cells in combination with RNA staining with EU (18 h), visualized by click‐reaction with Alexa Fluor® 555 (J′) and a DNA staining with DAPI (J″).
Data information: mV = mVenus; PrD = prion‐like domain; AP2 = APETALA2 domain; NLS = nuclear localization signal; EU = 5‐ethynyl‐2′‐uridine. Scale bars in (B–J‴) represent 5 µm.
In co‐expression experiments in N. benthamiana, we found that PLT3 recruits WOX5 to the same NBs, whereas on its own WOX5 remains homogenously localized within the nucleoplasm (Fig 6G–G″, Fig EV3A).
Figure EV3. Subnuclear localization and PrD prediction of WOX5, PLT1, PLT2, PLT3, and PLT4.

-
A, D, G, J, MRepresentative images of (sub‐)nuclear localization of WOX5‐mV (A), PLT1‐mV(D), PLT2‐mV (G), PLT3‐mV (J) and PLT4‐mV (m) in transiently expressing N. benthamina epidermal cells. Scale bars represent 5 µm.
-
B, E, H, K, NSchematic representation of WOX5 (B), PLT1 (E) PLT2 (H), PLT3 (K), and PLT4 (N) protein domains. The areas in red are predicted prion‐like domains (PrDs), analyzed using the PLAAC prediction tool. Yellow areas are polyQ stretches (defined as more than three Qs in a row) in the PLT3 and PLT4 amino acid sequence.
-
C, F, I, L, OProtein sequences of WOX5 (C) PLT1 (F), PLT2 (I), PLT3 (L), and PLT4 (O). The red highlighted sequences are the predicted prion‐like domains (PrDs). mV = mVenus fluorescent protein; PrD = prion‐like domain; EAR = Ethylene‐responsive binding factor‐associated repression domain; WUS = WUSCHEL box; AP2 = APETALA2 domain; NLS = nuclear localization signal.
Source data are available online for this figure.
Prion‐like domains (PrDs) are responsible for NB localization of PLT3
Next, we examined the protein domains putatively responsible for the localization of PLT3 to NBs and found that the PLT3 amino acid (aa) sequence contains two glutamine (Q)‐rich regions in the C‐terminal part of the protein (see Figs 6A and EV3K and L). Proteins containing polyQ stretches form aggregates or inclusions, a process often linked to pathological conditions in humans, such as Huntington’s disease (Scarafone et al, 2012). However, polyQ proteins can also convey diverse cellular functions like promotion of nuclear assemblies (e.g., the transcription initiation complex), formation of protein‐protein complexes, recruitment of other polyQ‐containing proteins (Mikecz, 2009; Atanesyan et al, 2012), and enhancement of the transcriptional activation potential of TFs (Gerber et al, 1994; Schwechheimer et al, 1998; Atanesyan et al, 2012). PolyQ domains were also found to be enriched in plant TFs (Kottenhagen et al, 2012).
Next, we tested if the polyQ‐stretches in PLT3 are responsible for the subnuclear localization and the recruitment of WOX5 to NBs. To this end, we deleted the polyQ domains of PLT3 and expressed the resulting PLT3ΔQ fused to mVenus transiently in N. benthamiana. We found that the subnuclear localization and the recruitment of WOX5 did not change compared to the full‐length PLT3 (see Fig 6B, C and H–H″). Therefore, we conclude that the polyQ domains in PLT3 are not, or at least not alone, responsible for the subnuclear localization and translocation to NBs.
Apart from proteins with polyQ domains, many proteins that form concentration‐dependent aggregates contain larger, intrinsically disordered regions (IDRs) with a low complexity similar to yeast prions (Cuevas‐Velazquez & Dinneny, 2018). Prion‐like proteins in Arabidopsis were first discovered by analyzing protein sequences of 31 different organisms, identifying Q‐ and N‐rich regions in the proteins to be sufficient to cause protein aggregation (Michelitsch & Weissman, 2000). Recently, the existence of more than 500 proteins with prion‐like behavior in Arabidopsis was reported (Chakrabortee et al, 2016) and the presence of prion‐like domains (PrDs) in protein sequences is predictable with web‐based tools (Lancaster et al, 2014). Therefore, we analyzed the PLTs and WOX5 sequences using the PLAAC PrD prediction tool and found that PLT3 has three predicted PrDs in its aa sequence, two of them located at the C terminus, containing the above described two polyQ‐stretches (see Figs 6A and EV3K and L). PLT1, PLT2, and PLT4 also show predicted PrD domains, but PLT1 and PLT2 contain no and PLT4 shorter polyQ stretches within them (Fig EV3D–I and M–O). WOX5 does not show any predicted PrD domains, nor any polyQ stretches (Fig EV3A–C). To test the importance of the PrD domains in PLT3, we replaced the first PrD by a 27 aa linker (AAGAAGGAGGGAAAAAGGAGAAAAAGA) and deleted the C‐terminally located PrDs. The resulting PLT3‐version (PLT3ΔPrD) was fused to the mVenus FP and inducibly expressed in N. benthamiana epidermal cells. Here, we did not observe a localization of PLT3ΔPrD‐mVenus to NBs, but in contrast a homogenous distribution within the nucleus (Fig 6D). In addition, upon co‐expression of PLT3ΔPrD‐mVenus with WOX5‐mCherry, we observed that WOX5 was no longer recruited to NBs (Fig 6I–I″). In line with this, we observed PLT3 NBs in developing Arabidopsis LRP expressing pPLT3::PLT3‐mVenus, but no more NBs were found in a pPLT3::PLT3ΔPrD‐mVenus expressing line (Fig 6E and F). Based on these observations, we conclude that the PrD domains of PLT3 are responsible for its localization to NBs and the recruitment of WOX5 to NBs. This is further supported by our observation that PLT3, in contrast to PLT1, 2 and 4, is found most frequently in NBs in transiently expressing in N. benthamiana correlating with the presence of PrD domains containing long polyQ‐stretches in its aa sequence (Fig EV3D–O, Appendix Fig S3A–E).
PLT NBs recruit RNA
Proteins containing polyQ‐stretches or PrDs are often involved in RNA binding, RNA processing and/or RNA compartmentalization (Macknight et al, 1997; Schomburg et al, 2001; Alberti et al, 2009; Sonmez et al, 2011; Castilla‐Llorente & Ramos, 2014; Fang et al, 2019). To test if PLT3 is involved in these processes, we performed an RNA‐staining in N. benthamiana epidermal cells transiently expressing PLT3‐mVenus with 5‐ethynyl‐2′‐uridine (EU) (see Fig 6J–J‴). EU is incorporated into RNA during transcription, and we found that most of the stained RNA co‐localizes with the PLT3‐mVenus NBs except for the EU‐stained nucleolus (see Fig 6J–J‴). Based on these observations, we conclude that the PLT NBs act as important sites for the recruitment of RNA and other factors, including WOX5.
WOX5 and PLT proteins can interact with each other
Because the WOX5 and PLT protein expression domains overlap in the SCN and PLT1, PLT2, PLT3 and PLT4 contain PrD domains, we asked whether PLTs and WOX5 can interact in vivo, especially considering the observed recruitment of WOX5 to PLT3 NBs. For this, we used fluorescence lifetime imaging microscopy (FLIM) to measure Förster resonance energy transfer (FRET) to analyze the potential protein‐protein interaction of WOX5 and PLTs in vivo. To perform FLIM, we inducibly co‐expressed WOX5‐mVenus as donor together with individual PLTs‐mCherry as acceptors for FRET in N. benthamiana leaf epidermal cells. The fluorescence lifetime of the donor fluorophore mVenus fused to WOX5 alone is 3.03 ± 0.07 ns. A reduction of fluorescence lifetime is due to Förster resonance energy transfer (FRET) of the two fluorophores in very close proximity (≤ 10 nm) caused by the direct interaction of the two observed proteins. When free mCherry is co‐expressed as a negative control, the WOX5‐mVenus mean fluorescence lifetime is not significantly decreased (3.00 ± 0.06 ns) (Fig 7A, B and I). When WOX5‐mVenus is co‐expressed with PLT1‐mCherry the fluorescence lifetime significantly decreases to 2.79 ± 0.11 ns, with PLT2‐mCherry to 2.73 ± 0.12 ns, with PLT3‐mCherry to 2.75 ± 0.17 ns and with PLT4‐mCherry to 2.75 ± 0.24 ns, indicating FRET and hence direct protein‐protein interactions (Fig 7C–F and H). The observed interaction of WOX5 with PLT1‐4 lead us to propose that they regulate SCN maintenance by the formation of complexes, either all together or in diverse compositions depending on the cell identity or their function. Interestingly, we observed a stronger lifetime decrease of WOX5‐mVenus in the PLT3 NBs than in the nucleoplasm, indicating that the NBs function as main interaction sites of WOX5 with PLT3 (Fig 7J and K, Appendix Table S9).
Figure 7. WOX5 can interact with PLTs.

-
A–HFluorescence Lifetime Imaging (FLIM) results of transiently expressing N. benthamiana leaf epidermal cells. Representative FLIM images of WOX5‐mVenus (donor only) plus the indicated acceptors after a pixel‐wise mono‐exponential fit of the mVenus fluorescence signal. The fluorescence lifetime of WOX5‐mVenus in ns is color‐coded. Low lifetimes (blue) due to FRET indicate strong interaction of the two proteins and high lifetimes (red) indicate weaker or no interaction. Scale bars represent 5 µm.
-
IFluorescence lifetimes in ns are summarized in combined jitter and box plots. The dashed line represents the fluorescence lifetime mean value of the WOX5‐mV co‐expressed with free mCh as negative control. The one‐way ANOVA and Holm–Sidak post‐hoc multiple comparisons test was used to test for statistical significance. Samples with identical letters do not show significant differences (α = 0.01). Number of nuclei analyzed (n) (biological replicates) is indicated and results from 2 to 9 technical replicates. Box = 25–75% of percentile, whisker = 1.5 interquartile range, − = median, ▪ = mean value.
-
JRepresentative FLIM image of WOX5‐mVenus plus the indicated acceptor after a pixel‐wise mono‐exponential fit of the mVenus fluorescence signal. The fluorescence lifetime of WOX5‐mVenus in ns is color‐coded. Low lifetimes (blue) due to FRET indicate strong interaction of the two proteins and high lifetimes (red) indicate weaker or no interaction. Scale bars represent 5 µm.
-
KIndividual nuclei showing nuclear bodies during co‐expression of WOX5‐mV and PLT3‐mCh were analyzed for WOX5‐mV lifetime in the nuclear bodies or nucleoplasm separately (n = 7 (biological replicates), from four technical replicates. mCh = mCherry. mV = mVenus.
Source data are available online for this figure.
To address this, we measured the interaction between WOX5 and PLT3 in Arabidopsis roots via FLIM experiments in a translational line expressing WOX5‐mVenus and PLT3‐mCherry under control of their respective endogenous promoters. This resulted in the inevitable low protein concentration in comparison to the inducible system used in N. benthamiana. Probably due to this, we could not observe NBs in established root meristems of our Arabidopsis FLIM line (Fig EV4A–A″) and we could only measure a very small, albeit statistically significant, decrease in fluorescence lifetime from 2.97 ± 0.07 ns in the pWOX5::WOX5‐mVenus (donor only FRET control) expressing roots to 2.94 ± 0.08 ns when pPLT3:PLT3‐mCherry is co‐expressed in the SCN of LRP in Col‐0 background (Fig EV4B).
Figure EV4. PLT3‐WOX5 interaction in the Arabidopsis root.

-
A–A′Representative image of the SCN in a lateral root of an Arabidopsis reporter line expressing WOX5‐mV (A) and PLT3‐mCh (A′) in Col‐0 background driven by their respective endogenous promoters. The TFs localize to overlapping domains (A″). Blue arrowheads mark QC cells, green arrowheads mark CSCs. Scalebars represent 10 µm.
-
BFluorescence Lifetime Imaging (FLIM) results of experiments performed in the SCN of lateral Col‐0 roots expressing either only WOX5‐mV (donor‐only) or both WOX5‐mV and PLT3‐mCh driven by their respective endogenous promoters. Number of analyzed roots (n) (biological replicates) is indicated for each genotype and results from 4 technical replicates. Donor fluorescence lifetimes in ns are summarized in combined scatter and box plots. Box = 25–75% of percentile, whisker = 1.5 interquartile range, − = median, □ = mean value, X = minimum/maximum value. The Kruskal–Wallis ANOVA with subsequent Dunn’s test was used to test for statistical significance. Asterisk indicates statistical significance (α = 0.01). mV = mVenus; mCh = mCherry; SCN = stem cell niche.
Formation of PLT3 NBs is concentration‐dependent
In Arabidopsis seedlings, we only sometimes observed PLT3 NBs in the CSC layer of the root tip, but more frequently in young, developing LRP (Fig 5A), whereas in N. benthamiana we observed NBs in almost all cells. Therefore, we argue that the formation of the NBs is flexible because it is concentration‐dependent. In a transient N. benthamiana experiment, we could observe a correlation between the fluorescence intensity of nuclear PLT3‐mVenus and the size and number of the NBs (Fig EV5). NBs start to form after a certain intensity‐threshold (Fig EV5A–C and F), and their number decreases while their volume increases with overall rising fluorescence intensity (Fig EV5D, E and G). A similar concentration‐dependency has been previously described for proteins that undergo phase separation, in particular for liquid‐liquid phase separation (LLPS) (McSwiggen et al, 2019). This mechanism separates membrane‐free microdomains from the surrounding liquid and could potentially represent the underlying NB‐forming process of PLTs. This process is possibly PrD‐dependent as we observed less NB formation in the PrD‐deletion variant of PLT3 (Fig 6D and F).
Figure EV5. Concentration dependency of PLT3 nuclear body formation.

-
A–CRepresentative images of low (A), medium (B), and high (C) PLT3‐mVenus expressing nuclei in transiently expressing N. benthamiana leaf epidermal cells are shown. Scale bars represent 5 µm.
-
D–GAnalyses of intensities, numbers, and average volume of PLT3 NBs in individual nuclei, n = 37 (biological replicates).
PrD‐domains in PLT3 are required for interaction with WOX5 and are necessary for root SCN maintenance
Moreover, we asked if the PrD and polyQ domains in PLT3 are required for protein‐protein interaction with WOX5. To test this, we performed FLIM experiments with mCherry‐tagged full‐length PLT3, PLT3ΔQ, and PLT3ΔPrD as acceptors and WOX5‐mVenus as donor in N. benthamiana. Here, we observed that co‐expression of the PLT3ΔQ and PLT3ΔPrD deletion variants did not lead to a significantly reduced fluorescence lifetime, and therefore, no protein‐protein interaction takes place in comparison to the full‐length version (see Fig 7E and G–I). This implies that PrD domains, containing the polyQ domains in PLT3, are necessary for the NB localization, but also, notably, for protein complex‐formation with WOX5. Still, the exact effect of the polyQ domains on PLT‐WOX5 interaction remains to be determined as PLT1, PLT2 and PLT4 still show protein‐protein interaction with WOX5, even though they do not contain extended polyQ domains like in PLT3. We therefore cannot rule out that the deletion of the polyQ domain in PLT3 (PLT3ΔQ) could lead to a disturbed PrD domain resulting in a loss of interaction with WOX5.
Next, we asked if the PrD domains of PLT3 are also required for root SCN homeostasis. Therefore, we tested if the plt2, plt3 double mutant phenotypes can be rescued by expressing full‐length PLT3 or PLT3ΔPrD under control of the endogenous PLT3 promoter. We observed that full‐length PLT3 expression can rescue the plt2, plt3 double mutant phenotype of more QC divisions and less CSC layers to the expected levels of plt2 or plt3 single mutant phenotypes (Fig EV2D–F, H, J and K, Appendix Table S7). Importantly, PLT3ΔPrD could not rescue the plt2, plt3 double mutant phenotype, suggesting that the PrD domains in PLT3 are indeed functionally relevant for SCN regulation and maintenance (Fig EV2I–K, Appendix Table S7).
In summary, our findings show that QC quiescence and CSC maintenance are interdependently regulated by WOX5 and PLTs. We could show that mutual transcriptional regulation of PLTs and WOX5, but also their direct protein‐protein interaction is required for QC division and CSC fate regulation. Here, especially the observed subnuclear partitioning of PLT3 to NBs in the CSCs of mature RAMs which is dependent on the presence of PrDs is important as it could provide another layer of regulation to the complex and intertwined SCN maintenance of the Arabidopsis root.
Discussion
In summary, we found that in agreement with a previous report (Sarkar et al, 2007), high PLT expression in the QC‐region is promoted by WOX5, albeit in an indirect manner, possibly by other factors, such as the described WOX5‐induced TAA1‐mediated auxin biosynthesis (Savina et al, 2020; Pardal & Heidstra, 2021). This PLT expression confines WOX5 to a defined and restricted number of cells within the QC region. In line with this, loss of PLTs leads to an expanded expression domain of WOX5 and a reduced QC quiescence reflected in more QC divisions. Therefore, we could confirm that the control of QC quiescence and CSC maintenance is mediated by mutual transcriptional regulation of PLTs and WOX5 possibly by negative feedback loop regulation. As WOX5 expression is normally limited to the QC, the question arises if, in absence of PLTs, either the WOX5 expression domain expands to regions surrounding the QC or the QC region itself expands and therefore also the expression domain of WOX5. Interestingly, a previous report demonstrated that the expression of several QC markers is missing or highly reduced in plt mutants, suggesting that they fail to maintain an intact QC (Aida et al, 2004). Therefore, the expansion of the WOX5 expression domain in the plt mutants is likely uncorrelated to the QC identity of these cells.
The observed higher frequency of cell divisions in the QC region of wox5 mutants could be explained by the reduced expression of PLTs, which consequently negatively impacts QC quiescence but also by a PLT‐independent pathway where WOX5 itself may have a positive effect on QC quiescence. Previous findings also suggest that WOX5 maintains QC quiescence through the repression of CYCD activity (Forzani et al, 2014). Considering our observation that PLT2, PLT3, and WOX5 show additive effects regarding the QC division phenotype, we propose a model in which WOX5 and PLTs could act in parallel pathways to maintain QC quiescence. The noted correlation of reduced QC quiescence and higher CSC differentiation that we could now show for individual roots by our newly introduced SCN staining could be necessary to replenish missing stem cells by QC divisions. This possible explanation is in agreement with the proposed function of the QC as a long‐term stem cell reservoir, especially in case of stress or damage (Vilarrasa‐Blasi et al, 2014).
For CSC homeostasis, PLTs and WOX5 may act together in the same pathway, possibly by complex formation, as there is no observable additive effect in the multiple mutant roots which is in agreement with previous findings (Ding & Friml, 2010). We show that WOX5 can directly interact with PLT1, PLT2, PLT3 and PLT4, which indicates that they regulate CSC maintenance by the formation of complexes, either all together or in diverse homo‐ or heteromeric compositions depending on cell identity or function.
In transient N. benthamiana experiments, PLT3 forms NBs and recruits WOX5 into them. The stronger decrease of fluorescence lifetime in NBs compared to the nucleoplasm measured by FLIM implies that the PLT3 NBs function as major sites of protein‐protein interaction with WOX5, which could be due to a favored complex‐formation within the NBs or due to transport of preformed WOX5/PLT3 complexes from the cytosol to NBs. We could observe PLT3 NBs in cells of the CSC layer of some Arabidopsis primary root tips, but never in the QC region. Nevertheless, PLT3 NBs were found more frequently in several cells of developing LRPs. LRPs are in a younger and less‐determined stage than the primary root and the observed subnuclear localization to NBs could represent a marker for the occurring determination and future cell differentiation. This agrees with the observed localization of PLT3 to NBs in the CSCs in some of the primary roots. Here, PLT3 NBs could represent compartments for the recruitment of and interaction with WOX5 and possibly other factors involved in CSC fate determination and maintenance.
Furthermore, we found that the aa sequence of PLT3 comprises PrDs (including polyQs) that are necessary for the localization to NBs, complex formation with WOX5, and for SCN maintenance in the primary root meristem. Proteins containing polyQ‐stretches or PrDs are often involved in RNA binding, RNA processing, and/or RNA compartmentalization (Macknight et al, 1997; Schomburg et al, 2001; Alberti et al, 2009; Sonmez et al, 2011; Castilla‐Llorente & Ramos, 2014; Fang et al, 2019) and we could show that the PLT3 NBs indeed co‐localize with RNA. Just as PLT3, FLOWERING CONTROL LOCUS A (FCA) is a PrD‐containing protein (Chakrabortee et al, 2016) that localizes to subnuclear structures (Fang et al, 2019). The FCA bodies separate from the cytosol by LLPS to provide compartments for RNA 3′‐end processing factors (Fang et al, 2019). Similarly, PLT3 NBs could represent compartments for the recruitment of interacting factors and RNA for further processing, sequestration, or transportation. As PLT3 is a TF, the co‐localizing RNA could also represent newly transcribed RNA at the transcription sites where PLT3 binds to DNA, for example, to the WOX5 promoter region (Shimotohno et al, 2018). Another recently described PrD‐ and polyQ‐containing protein, EARLY FLOWERING3 (ELF3), forms NBs by LLPS in response to temperature thereby regulating flowering time in Arabidopsis (Jung et al, 2020).
The possible liquid‐like nature of the PLT3 NBs will be an interesting subject for further studies investigating its putative phase separation properties in response to external cues. In this study, we showed that the PLT3 NB formation is concentration‐dependent, which is indicative for LLPS. This concentration‐dependency of PLT3 NB formation could also explain the rare occurrence of PLT3 NBs at endogenous protein levels in the CSCs of the Arabidopsis RAM. Here, NB formation is possibly triggered only above a certain protein concentration threshold serving as a read‐out for future cell fate. In the established distal root meristem, this is not continuously needed and therefore the protein concentration is mainly maintained below this threshold, so that often no NBs are formed. Consequently, the observed PLT3‐FP fluorescence intensity in the CSCs can vary and is lower or higher at a given time (Figs 1E and 5B and C).
Therefore, we propose that the regulation of QC quiescence and CSC maintenance are not only mediated by the mutual transcriptional regulation of PLT and WOX5 (see Fig 8A), but also, importantly, by building protein complexes that are differentially localized to distinct nuclei within the SCN (see Fig 8B). The observed subnuclear localization of PLT3 to NBs could represent a marker for the determination to future cell differentiation in the CSC layer. Furthermore, the PrD domains in PLT3 may act as an initial starting point to compartmentalize and partition WOX5 that has moved from the QC towards the CSC layer into NBs, possibly by a concentration‐dependent LLPS process. The observed sites could represent transcriptionally active sites for the regulation of target genes involved in CSC fate determination or repress WOX5 expression.
Figure 8. Model of PLT and WOX5 transcriptional regulation, interaction and subnuclear localization during distal root stem cell maintenance.

- Transcriptional regulation of WOX5 (red) and PLT (green) expression by negative feedback regulation in the Arabidopsis RAM. WOX5 is expressed in the QC and indirectly promotes PLT expression (dashed arrow), whereas PLT expression is directly regulating WOX5 expression confining it to the QC position (solid barred lines).
- Both WOX5 (red) and PLT3 (green) are present homogenously within the nuclei of the QC cells. WOX5 can move to the CSCs and is recruited there by PLT3 to NBs (yellow), where interaction takes place and RNA is present (grey in magnification). This maintains the stem cell character of the CSCs (arrow) but already leads to a determination to subsequent CC fate. Gray dots represent starch granules.
The dynamic compartmentalization to subcellular or subnuclear microdomains of proteins with intrinsically disordered, PrD and/or polyQ domains was shown to have severe effects, for example, in human pathological disorders like Huntington’s disease (Scarafone et al, 2012). But also beneficial functions of prions that are responsible for some neurodegenerative diseases in mammals (Aguzzi et al, 2013; Kim et al, 2013) as a protein‐based memory is highly discussed, as their self‐replicating conformations could act as molecular memories to transmit heritable information (Bailey et al, 2004; Shorter & Lindquist, 2005). If this is also the case in plants remains to be determined. In general, the dynamic formation of subcellular structures could be necessary for a changing composition of assemblies in dependence of their functional status (Mikecz, 2009). The transition of these proteins between condensed and soluble forms requires high flexibility in their protein structure, which can be provided by flexible intrinsically disordered domains, such as polyQ‐stretches which are predominantly positioned at the surface of a protein, supporting the idea of their involvement in protein‐protein interactions (Totzeck et al, 2017).
In Arabidopsis, PrD and polyQ dependent compartmentalization could present a fast and reversible concentration‐dependent regulatory mechanism (Cuevas‐Velazquez & Dinneny, 2018), for example, in case of PLT3 and WOX5 to determine CSC cell fate but probably also in other developmental contexts such as lateral root development. It remains to be determined if LLPS is the underlying mechanism of the observed subnuclear compartmentalization of these key TFs involved in Arabidopsis root stem cell homeostasis and if also other processes necessary for determination of cell fates and stemness in Arabidopsis are regulated by this or similar dynamic processes.
Materials and Methods
Cloning
pWOX5::mVenus‐NLS, pWOX5::WOX5‐mVenus, pPLT3::PLT3‐mVenus, pPLT3::PLT3‐mCherry, pPLT3::PLT3ΔPrD‐mVenus, β‐estradiol inducible PLT3ΔPrD‐mVenus, and β‐estradiol inducible PLT3ΔPrD‐mCherry were created by using the GreenGate cloning method (Lampropoulos et al, 2013). The internal BsaI restriction sites in the WOX5 promoter and WOX5 CDS were removed by PCR amplification of the sequences upstream and downstream of the BsaI sites with primer pairs whereof one primer has an altered nucleotide sequence at this site (Appendix Table S10), followed by an overlap extension PCR to reconnect the gene fragments. The sequences upstream of the ATG start codon of WOX5 (4,654 bp) and PLT3 (4,494 bp) were used as promoter regions and were amplified by PCR and primers to add flanking BsaI restriction sites and matching overlaps for the GreenGate cloning system. Afterward, they were cloned into the GreenGate entry vector pGGA000 via BsaI restriction and ligation. The GreenGate promoter module carrying the β‐estradiol inducible cassette was provided by (Denninger et al, 2019). The CDS of WOX5, PLT2, PLT3, PLT3ΔPrD and PLT4 as well as the FPs mVenus and mCherry were amplified by PCR using adequate primer pairs to add flanking BsaI restriction sites and matching overlaps for cloning into the GreenGate entry vectors pGGC000 (for CDS) and pGGD000 (for FPs) via BsaI restriction and ligation. All created entry vectors were confirmed by sequencing. The expression cassettes were created with a GreenGate reaction using pGGZ001 as destination vector. The correct assembly of the modules was controlled by sequencing. All module combinations used to construct the expression vectors can be found in Appendix Table S11.
All other β‐estradiol inducible constructs for N. benthamiana expression (free mCherry, WOX5‐mVenus, WOX5‐mCherry, PLT1‐mVenus, PLT1‐mCherry, PLT2‐mCherry, PLT3‐mVenus, PLT3‐mCherry, PLT3ΔQ‐mVenus, PLT3ΔQ‐mCherry were created by Gateway cloning (Invitrogen™, Thermo Fisher Scientific Inc.). The CDS of WOX5, PLT1, PLT2, PLT3, PLT3ΔQ were amplified and cloned into pENTR/D‐TOPO®. The Entry‐vectors were confirmed by sequencing. The destination vector carrying the mVenus (pRD04) is based on pMDC7 (Curtis & Grossniklaus, 2003) which contains a β‐estradiol inducible system for expression in planta. The mVenus was introduced via restriction/ligation C‐terminally to the Gateway cloning site. The destination vector carrying the mCherry (pABindmCherry) was described before (Bleckmann et al, 2010). The expression vectors were created by LR‐reaction of destination and entry vectors. Gateway expression vectors were verified by test digestion.
For the creation of the domain‐deletion variants of PLT3 (PLT3ΔQ and PLT3ΔPrD), the CDS parts upstream and downstream of the desired sequence deletions were amplified with PCR and afterward reconnected with overlap‐PCR. The 27 aa linker (AAGAAGGAGGGAAAAAGGAGAAAAAGA) to replace the first PrD in PLT3ΔPrD was also introduced by overlap‐PCR. All primers used for cloning can be found in Appendix Table S10. For a list of the constructs produced in this study see Appendix Table S11.
Plant work
All Arabidopsis lines used in this study were in the Columbia (Col‐0) background. The single mutants wox5‐1 and plt3‐1 have been described before (Galinha et al, 2007) (Appendix Table S4). The plt2 (SALK_128164) and wox5‐1 (SALK038262) single mutants were provided by the Arabidopsis Biological Resource Center (ABRC, USA). The homozygous double and triple mutants were created by crossings (Appendix Table S12) and homozygous F3 es were confirmed by PCR with appropriate primer pairs (Appendix Table S13). The transgenic lines were created by floral dip as described before (Zhang et al, 2006) except for the published, transgenic Col‐0 lines with pPLT3::erCFP and pPLT3::PLT3‐YFP (Galinha et al, 2007) constructs. They were crossed into the wox5‐1 mutant background. Homozygous lines were confirmed by genotyping and hygromycin selection. All plants for crossing, floral dips, genotyping, and seed amplification were grown on soil in phytochambers under long day (16 h light/ 8 h dark) conditions at 21°C. For microscopy Arabidopsis seeds were fume‐sterilized (50 ml 13% sodiumhypochlorite (v/v) + 1 ml hydrochloric acid), imbedded in 0.2% (w/v) agarose, stratified at 4°C for 2 days and plated on GM agar plates (1/2 strength Murashige Skoog medium including Gamborg B5 vitamins, 1.2% (w/v) plant agar, 1% (w/v) sucrose, supplemented with 0.05% (w/v) MES hydrate). Arabidopsis seedlings were grown for 5 days under continuous light at 21°C and directly imaged afterward.
Cell wall and plasma membrane staining
For root imaging, the cell walls in Arabidopsis seedlings were stained by incubation in aqueous solutions of either 10 µM propidium iodide (PI) or 2.5 µM FM4‐64 dye (Invitrogen™, Thermo Fisher Scientific Inc.). The staining solution was used as mounting medium for microscopy.
Nicotiana benthamiana infiltration
For transient gene expression in N. benthamiana, the Agrobacterium strain GV3101::pMP50 was used as vector, carrying plasmids with the desired constructs and additionally either the helper plasmid p19 as silencing suppressor or the helper plasmid pSOUP that harbours a replicase needed for GreenGate vectors. Cultures were grown over night in 5 ml dYT‐medium at 28 C on a shaker. The cultures were centrifuged for 10 min at 3,345 g, the pellet was resuspended in infiltration medium (5% (w/v) sucrose, 0.01% (v/v) Silwet, 0.01% (w/v) MgSO4, 0.01% (w/v) glucose, 450 µM acetosyringone) to an optical density OD600 of 0.4 and cultures were incubated for 1 h at 4°C. The infiltration was done either with one single or with a combination of two different Agrobacteria cultures for co‐expression of two constructs. A syringe without needle was used for the infiltration on the adaxial side of the leaves of well‐watered N. benthamiana plants. For the expression of GreenGate constructs, an Agrobacterium strain carrying the p19 plasmid was co‐infiltrated. The expression was induced 2–5 days after infiltration by applying an aqueous β‐estradiol solution (20 µM β‐estradiol, 0.1% (v/v) Tween®‐20) to the adaxial leaf surface. Imaging or FLIM experiments were done 3–16 h after induction, depending on the expression level.
Quantification of nuclear bodies
NBs were quantified by expression of translational fusions of PLTs to mVenus in N. benthamiana after induction with β‐estradiol for exactly 5 h. All image acquisition settings (e.g., laser power, gain, filter, pixel size, averaging, scan speed) were kept the same for the analyses of the different PLTs for comparability. Optical z‐stacks containing the whole nuclei were acquired and the number of NBs per nucleus and the nuclear volumes quantified using Imaris (version 9.1.2, Bitplane, Oxford Instruments plc).
SCN staining
Arabidopsis seedlings were grown under continuous light for 5 days on GM agar plates without sucrose and then transferred on fresh plates containing additionally 7 µg/ml EdU to continue growing for 24 h. Afterward, we performed an mPS‐PI staining like described before (Truernit et al, 2008). Preliminary to the clearing step, the EdU‐staining was performed. The permeabilization of the cells and the subsequent staining of EdU‐containing DNA with Alexa Fluor® 488 was done as described in the Click‐it® EdU Imaging Kits from InvitrogenTM (Thermo Fisher Scientific Inc.) with adapted incubation times for Arabidopsis seedlings (permeabilization for 1–2 h and click‐reaction for 1 h). The click‐reaction cocktail was prepared freshly with self‐made solutions (Tris buffer with 50 mM Tris and 150 mM NaCl at pH 7.2–7.5; 4 mM CuSO4; 1.5 µM Alexa Fluor® 488 picolyl azide; 50 mM ascorbic acid). The Alexa Fluor® 488 picolyl azide (Thermo Fisher Scientific Inc.) was added from a 500 µM stock in DMSO. The ascorbic acid was added last from a freshly prepared aqueous 500 mM stock solution. After staining was done, the clearing step with chloralhydrate was performed like described before (Truernit et al, 2008). Images were acquired with a ZEISS LSM880 confocal microscope with imaging acquisition settings as stated below. z‐stacks through the QC‐region were recorded to obtain transversal views. To calculate the CSC phenotype, the number of CSC layers was counted in xy‐images of each root. For this, we defined an intact CSC layer as a stem‐cell layer below QC position without any differentiated cells (visible by no starch‐accumulation). Cells in the layer below QC position containing starch granules were scored as differentiated, and we therefore score the whole layer as differentiated, even if only some of these cells contain starch.
The QC‐division phenotype is the number of EdU‐Alexa Fluor® 488‐stained cells in the QC, which was counted in the cross‐sectional images up to a maximal number of 4 stained QC cells. In case of duplicated QC cells as in plt2, plt3 double mutants only one layer of QC cells, the one with the most QC divisions, was counted (usually the bottom layer).
The phenotype frequencies of CSC differentiation and QC divisions (Fig 3) where visualized in bar graphs with Excel (Microsoft Office 365 ProPlus, Microsoft Corporation). In order to correlate the two investigated phenotypes, we combined the CSC data and the QC‐division data in 2D‐plots. The combined QC/CSC‐phenotype of every root was entered in a matrix with QC‐divisions on the x‐ and CSC layers on the y‐axis. 2D plots were created with Origin 2018b and 2020b (OriginLab Corporation).
RNA staining
RNA‐staining in N. benthamiana epidermal cells was done on N. benthamiana leaves harboring a construct for a β‐Estradiol inducible PLT3‐mVenus expression. 5‐ethynyl‐2′‐uridine (EU) was infiltrated in N. benthamiana leaves the day before staining. The expression of PLT3‐mVenus was induced the next morning, 3 h before fixation of the plant tissue. For fixation and permeabilization of cells, pieces of the leaves were cut and treated with 4% (w/v) paraformaldehyde and 0.5% (v/v) TritonX‐100 in PBS under vacuum for 1 h. The click‐reaction of EU with Alexa Fluor® 555 picolyl azide was performed similarly to the EdU‐Alexa Fluor® 488‐staining described for the SCN staining in this article. A DAPI‐ counterstaining was carried out afterward by incubating the leaf pieces in 0.1 µg/ml DAPI for 30 min. PBS was used as mounting medium for imaging.
Microscopy
Imaging of Arabidopsis thaliana roots and Nicotiana benthamiana leaves was carried out with a ZEISS LSM780 or LSM880. Excitation and detection of fluorescent emission of fluorescent dyes was done as follows: DAPI was exited at 405 nm and emission was detected at 408–486 nm, Cerulean was excited at 458 nm and emission was detected at 460–510 nm; CFP was excited at 458 nm and emission was detected at 463–547 nm. mVenus was excited at 514 nm and emission was detected at 517–560 nm, or for co‐expression with red dyes excited at 488 nm and detected at 500–560 nm. YFP was excited at 514 nm and emission was detected at 518–548 nm. Alexa Fluor® 488 was excited at 488 nm and emission was detected at 490–560 nm. Alexa Fluor® 555 was excited at 561 nm and emission was detected at 565–640 nm. PI was excited at 561 nm and emission was detected at 590–710 nm. FM4‐64 was excited at 514 or 561 nm and emission was detected at 670‐760 nm. mCherry was excited at 561 nm and emission was detected at 590–640 nm. Imaging of more than one fluorophore was done in sequential mode to avoid cross talk. The movie of pPLT3::PLT3‐mVenus in a lateral root primordium was acquired with a MuViSPIM (Luxendo, Bruker) light sheet microscope equipped with a 40×/0.8 Nikon objective with a 1.5× tube lens on the detection axis to provide a 60× magnification.
Image deconvolution
The microscope images in Fig 5A and C–C′ were deconvolved with Huygens 16.10.0p3 64b (Scientific Volume Imaging B.V.).
Analyses of expression patterns and levels in Arabidopsis
For the comparison of relative fluorescence levels in the SCN of 5‐day‐old Arabidopsis seedlings expressing either transcriptionally FP tagged PLT3 (pPLT3::erCFP) or translationally FP tagged PLT3 (pPLT3::PLT3‐YFP) driven by the endogenous PLT3 promoter in either the Col wild type or the wox5‐1 mutant, images were acquired with constant settings per FP. A ZEISS LSM880 confocal microscope was used. The mean fluorescence levels were measured with Fiji (Schindelin et al, 2012) in equally sized rectangular ROIs including the QC and CSC positions in the SCN. The thereby generated values were normalized to the Col mean fluorescence intensity and visualized in box and scatter plots created with Origin 2018b (OriginLab Corporation).
Images of the root tips of 5 day old Arabidopsis seedlings expressing mVenus‐NLS driven by the endogenous WOX5 promoter in Col and plt2 or plt3‐1 single mutants and the plt2,plt3 double mutant were acquired. Additionally, z‐stacks through the QC region of the roots were recorded to get a transversal view of the QC. The visualization and counting of nuclei with WOX5 expression (Fig 2) was done with Imaris (version 9.1.2, Bitplane, Oxford Instruments plc). Box and scatter plots showing the number of expressing nuclei were created with Origin 2018b and 2020b (OriginLab Corporation). For the heat‐map images, 10 acquired images were overlaid with Fiji (Schindelin et al, 2012) and the resulting fluorescence distribution was displayed with a 16‐colors lookup table. To calculate the area of lateral WOX5 expression in the QC region, a freehand‐ROI surrounding the expressing cells was created in every image with Fiji (Schindelin et al, 2012). The ROI‐areas were visualized in box and scatter plots, and all statistical analyses were carried by using Origin 2018b and 2020b (OriginLab Corporation).
Measurement of PLT3 expression upon WOX5 induction
For qPCR analyses of PLT3 expression after WOX5 induction, Arabidopsis thaliana p35S:WOX5‐GR seeds were sterilized, stratified, and sown on GM plates without sucrose as described above onto a 20 µm nylon mesh for easy and fast transfer. The seedlings were grown under continuous light conditions at 21°C and 60% humidity for 5 days. For cycloheximide (CHX) and CHX + dexamethasone (DEX) treatments, the seedlings were transferred to GM plates without sucrose containing 10 µM CHX (Sigma) for 15 min and then transferred to GM plates without sucrose containing 10 µM CHX or 10 µM CHX and 20 µM DEX (Sigma), respectively. For DEX induction tests, seedlings were transferred to GM plates without sucrose containing 20 µM DEX. As a control, seedlings were transferred to GM plates without sucrose containing 10 µM DMSO. To ensure uptake of CHX and/or DEX, seedlings were additionally sprayed with a solution containing 0.1% Tween‐20 and 10 µM CHX or 20 µM DEX or both. Isolation of RNA from roots was performed with the “RNeasy Plant Mini Kit” (Qiagen). For cDNA synthesis, 1 µg total root RNA per sample was reverse‐transcribed using SuperScript III first strand synthesis kit (Invitrogen) according to the manufacturer’s protocol. Quantitative real‐time PCR (qPCR) was performed using Luna® Universal qPCR Master Mix (NEB) according to manufacturer’s instructions on a Stratagene Mx3005P (Agilent technologies). Data normalization was performed as described before and ACTIN used as reference gene (Livak & Schmittgen, 2001). qPCR primers are listed in Appendix Table S13.
F1 generation seeds of a crossing of Arabidopsis lines carrying 35S::WOX5‐GFP‐GR or pPLT3::erCFP in Col‐0 background were grown as described above at 21°C and continuous light for 5 days. For DEX induction, seedlings were treated with 20 µM DEX. Images were taken 4 or 21 h after treatment, respectively. To visualize the cell walls, seedlings were mounted in 25 µM propidium iodide staining solution prior to imaging. Imaging was carried out with a ZEISS LSM780, with two different tracks: Track 1 was used for simultaneous detection of GFP and PI with a 488/561 nm beam splitter, track 2 was used for CFP detection with a 458 nm beam splitter. GFP was excited at 488 nm and was detected at 500–535 nm and PI was excited at 561 nm and was detected at 597–663 nm. CFP was excited at 458 nm and was detected at 464–509 nm and tracks were acquired framewise to avoid crosstalk. Laser power and detector gain were kept the same during the experiment and the same acquisition settings were used for all images. For quantification of fluorescence intensities, three different ROIs were chosen with a size of 200 × 150 or 70 × 180 pixels, respectively, and were arranged at the same location within the root during the experiment. For each ROI, the ratio of CFP to GFP fluorescence intensity was calculated and normalized to the control group of the same ROI.
FLIM measurements
FLIM was performed either in N. benthamiana leaf epidermal cells expressing the desired gene combinations or in roots of 6‐10 dag old Col‐0 Arabidopsis seedlings expressing WOX5‐mVenus and PLT3‐mCherry with their endogenous promoters. The FLIM measurements of the SCNs in Arabidopsis were performed in LRPs due to higher fluorescence levels and less movement during measurements compared to the main RAM. mVenus‐tagged proteins were always used as donor and mCherry‐tagged proteins as acceptor for FRET. A ZEISS LSM 780 was used for the experiments equipped with a time correlated single‐photon counting device (Hydra Harp 400, PicoQuant GmbH). The mVenus donor was excited with a linearly polarized diode laser (LDH‐D‐C‐485) at 485 nm and a pulse frequency of 32 MHz. The excitation power was adjusted to 0.1–0.5 µW at the objective (C‐Apochromat 40×/1.2 W Corr M27, ZEISS) for experiments in N. benthamiana and 1.5–2 µW for experiments in Arabidopsis. The higher laser power in Arabidopsis was needed due to lower fluorescence levels. τ‐SPAD single photon counting modules with 2 channel detection units (PicoQuant GmbH) and a bandpass filter (534/30) were used to detect parallel and perpendicular polarized emission of the mVenus fluorescence. Images were acquired with a frame size of 256 × 256 pixel, a pixel dwell time of 12.6 µs and a zoom factor of 8. 40–60 frames were recorded in the N. benthamiana experiments, 80 frames in the experiments performed in Arabidopsis.
Fluorescent lifetimes were obtained by further analyses of the acquired data with SymPhoTime64 (PicoQuant GmbH). The instrument response function (IRF) of the microscope hardware is needed for fluorescence lifetime calculation to correct the system‐specific internal time lag between laser pulse and data acquisition. The IRF was recorded preliminary to each experiment by time‐correlated single photon counting (TCSPC) of an aqueous solution of erythrosine B in saturated potassium iodide. For data analysis of N. benthamiana experiments, an intensity threshold of 100–200 photons per pixel was applied to remove background fluorescence and a monoexponential fit was used. Due to low fluorescence intensities in Arabidopsis experiments, no threshold was applied to obtain the maximal possible photon number. In this case, a two‐exponential fit was used to separate the mVenus fluorescence signal from the background fluorescence created by the plant tissue. This results in two lifetimes whereof one matches with the mVenus fluorescence lifetime of about 3 ns and the other representing the very short background lifetime of < 0.4 ns. All data were obtained in at least two independent experiments. For visualization of the lifetimes, box and scatter plots were created with Origin 2020b (OriginLab Corporation). Lifetime images of representative measurements were created with a pixel wise FLIM‐fit in SymPhoTime64 (PicoQuant GmbH). The line graph showing the lifetime difference between the bodies and the nucleoplasm of WOX5‐mVenus co‐expressed with PLT3‐mCherry was created using Excel (Microsoft Office 365 ProPlus, Microsoft Corporation).
Statistical testing
Data were tested for normal distribution by Kolmogorov‐Smirnov testing. In case of normal distribution below 0.05 niveau, the data were subsequently analyzed by one‐way ANOVA and post‐hoc Holm–Sidak multiple comparisons test with a = 0.01 to identify statistically significant differences. In case of non‐normal distribution of the data, the non‐parametric Kruskal–Wallis ANOVA with subsequent Dunn’s test was used to test for statistical significance (a = 0.01). Statistical tests were carried out in Origin 2020b (OriginLab Corporation) or in R.
Prediction of protein domains
The PrDs in the WOX5, PLT1, PLT2, and PLT3 aa sequences were predicted using the PLAAC application (Lancaster et al, 2014). The nuclear localization signals (NLSs) of WOX5 and the studied PLT proteins were predicted using the cNLS Mapper (Kosugi et al, 2009) for WOX5 and PLT3 and SeqNLS (Lin & Hu, 2013) for PLT1 and PLT2.
Figure assembly
All figures in this study were assembled using Adobe Photoshop (Adobe Inc.).
Author contributions
Rebecca C Burkart: Conceptualization; Data curation; Validation; Investigation; Visualization; Methodology; Writing – original draft. Vivien I Strotmann: Data curation; Investigation; Writing – review & editing. Gwendolyn K Kirschner: Investigation. Abdullah Akinci: Investigation. Laura Czempik: Investigation. Anika Dolata: Investigation; Visualization. Alexis Maizel: Investigation; Visualization. Stefanie Weidtkamp‐Peters: Validation. Yvonne Stahl: Conceptualization; Data curation; Formal analysis; Supervision; Funding acquisition; Validation; Investigation; Methodology; Writing – original draft; Project administration; Writing – review & editing.
In addition to the CRediT author contributions listed above, the contributions in detail are:
YS conceived the project. YS, RCB and VIS designed the experiments, analyzed and interpreted the data. RCB, VIS, AA, AD, LC, and GKK carried out experiments. SW‐P contributed to FLIM data analyses. AM carried out light sheet imaging. YS and RCB wrote the manuscript. All authors commented on the manuscript.
Disclosure and competing interests statement
The authors declare that they have no conflict of interest.
Supporting information
Appendix
Expanded View Figures PDF
Movie EV1
Source Data for Expanded View and Appendix
Source Data for Figure 3
Source Data for Figure 4
Source Data for Figure 7
Acknowledgements
We would like to acknowledge funding of R.C.B. by the Deutsche Forschungsgemeinschaft (DFG) through grant Sta1212/1‐1 to Y.S. We thank Andrea Bleckmann for sharing the Greengate Cerulean construct, Renze Heidstra, and Ben Scheres for sharing published Arabidopsis lines (PLT::PLT‐YFP, PLT::CFP, PLT4 cDNA and plt mutants). We thank Rüdiger Simon and Thomas Laux for providing seeds of the published 35S::WOX5‐GFP‐GR and 35S::WOX5‐GR Arabiodpsis thaliana lines, respectively. We thank Meik H. Thiele for help with statistical analyses. We also thank the Center for Advanced Imaging (CAi) for technical assistance, and Rüdiger Simon and Peter Welters for critical discussion of the manuscript. Open Access funding enabled and organized by Projekt DEAL.
EMBO reports (2022) 23: e54105.
Footnotes
Correction added on 7 June 2022, after first online publication: The authors became aware of a publication that describes a different combined mPSPI and EdU staining protocol for Arabidopsis floral meristems and would like to acknowledge this work (Schiessl et al, 2012).
Data availability
No primary datasets have been generated and deposited.
References
- Aguzzi A, Nuvolone M, Zhu C (2013) The immunobiology of prion diseases. Nat Rev Immunol 13: 888–902 [DOI] [PubMed] [Google Scholar]
- Aida M, Beis D, Heidstra R, Willemsen V, Blilou I, Galinha C, Nussaume L, Noh Y‐S, Amasino R, Scheres B (2004) The PLETHORA genes mediate patterning of the Arabidopsis root stem cell niche. Cell 119: 109–120 [DOI] [PubMed] [Google Scholar]
- Alberti S, Halfmann R, King O, Kapila A, Lindquist S (2009) A systematic survey identifies prions and illuminates sequence features of prionogenic proteins. Cell 137: 146–158 [DOI] [PMC free article] [PubMed] [Google Scholar]
- Atanesyan L, Günther V, Dichtl B, Georgiev O, Schaffner W (2012) Polyglutamine tracts as modulators of transcriptional activation from yeast to mammals. Biol Chem 393: 63–70 [DOI] [PubMed] [Google Scholar]
- Bailey CH, Kandel ER, Si K (2004) The persistence of long‐term memory: a molecular approach to self‐sustaining changes in learning‐induced synaptic growth. Neuron 44: 49–57 [DOI] [PubMed] [Google Scholar]
- Benfey PN, Scheres B (2000) Root development. Curr Biol 10: 13 [DOI] [PubMed] [Google Scholar]
- Berckmans B, Kirschner G, Gerlitz N, Stadler R, Simon R (2020) CLE40 signaling regulates root stem cell fate. Plant Physiol 182: 1776–1792 [DOI] [PMC free article] [PubMed] [Google Scholar]
- van den Berg C, Willemsen V, Henriks G, Weisbeek P, Scheres B (1997) Short‐range control of cell differentiation in the Arabidopsis root meristem. Nature 390: 287–289 [DOI] [PubMed] [Google Scholar]
- Bleckmann A, Weidtkamp‐Peters S, Seidel CAM, Simon R (2010) Stem cell signaling in Arabidopsis requires CRN to localize CLV2 to the plasma membrane. Plant Physiol 152: 166–176 [DOI] [PMC free article] [PubMed] [Google Scholar]
- Castilla‐Llorente V, Ramos A (2014) PolyQ‐mediated regulation of mRNA granules assembly. Biochem Soc Trans 42: 1246–1250 [DOI] [PubMed] [Google Scholar]
- Chakrabortee S, Kayatekin C, Newby GA, Mendillo ML, Lancaster A, Lindquist S (2016) Luminidependens (LD) is an Arabidopsis protein with prion behavior. Proc Natl Acad Sci USA 113: 6065–6070 [DOI] [PMC free article] [PubMed] [Google Scholar]
- Cruz‐Ramírez A, Díaz‐Triviño S, Wachsman G, Du Y, Arteága‐Vázquez M, Zhang H, Benjamins R, Blilou I, Neef AB, Chandler V et al (2013) A SCARECROW‐RETINOBLASTOMA protein network controls protective quiescence in the Arabidopsis root stem cell organizer. PLoS Biol 11: e1001724 [DOI] [PMC free article] [PubMed] [Google Scholar]
- Cuevas‐Velazquez CL, Dinneny JR (2018) Organization out of disorder: liquid‐liquid phase separation in plants. COPB 45: 68–74 [DOI] [PubMed] [Google Scholar]
- Curtis MD, Grossniklaus U (2003) A gateway cloning vector set for high‐throughput functional analysis of genes in planta. Plant Physiol 133: 462–469 [DOI] [PMC free article] [PubMed] [Google Scholar]
- Denninger P, Reichelt A, Schmidt VAF, Mehlhorn DG, Asseck LY, Stanley CE, Keinath NF, Evers J‐F, Grefen C, Grossmann G (2019) Distinct RopGEFs successively drive polarization and outgrowth of root hairs. Curr Biol 29: 1854–1865.e5 [DOI] [PubMed] [Google Scholar]
- Ding Z, Friml J (2010) Auxin regulates distal stem cell differentiation in Arabidopsis roots. Proc Natl Acad Sci USA 107: 12046–12051 [DOI] [PMC free article] [PubMed] [Google Scholar]
- Dolan L, Janmaat K, Willemsen V, Linstead P, Poethig S, Roberts K, Scheres B (1993) Cellular organisation of the Arabidopsis thaliana root. Development 119: 71–84 [DOI] [PubMed] [Google Scholar]
- Drisch RC, Stahl Y (2015) Function and regulation of transcription factors involved in root apical meristem and stem cell maintenance. Front Plant Sci 6: 505 [DOI] [PMC free article] [PubMed] [Google Scholar]
- Du Y, Scheres B (2017) PLETHORA transcription factors orchestrate de novo organ patterning during Arabidopsis lateral root outgrowth. Proc Natl Acad Sci USA 114: 11709–11714 [DOI] [PMC free article] [PubMed] [Google Scholar]
- Fang X, Wang L, Ishikawa R, Li Y, Fiedler M, Liu F, Calder G, Rowan B, Weigel D, Li P et al (2019) Arabidopsis FLL2 promotes liquid‐liquid phase separation of polyadenylation complexes. Nature 569: 265–269 [DOI] [PMC free article] [PubMed] [Google Scholar]
- Forzani C, Aichinger E, Sornay E, Willemsen V, Laux T, Dewitte W, Murray JAH (2014) WOX5 suppresses CYCLIN D activity to establish quiescence at the center of the root stem cell niche. Curr Biol 24: 1939–1944 [DOI] [PMC free article] [PubMed] [Google Scholar]
- Galinha C, Hofhuis H, Luijten M, Willemsen V, Blilou I, Heidstra R, Scheres B (2007) PLETHORA proteins as dose‐dependent master regulators of Arabidopsis root development. Nature 449: 1053–1057 [DOI] [PubMed] [Google Scholar]
- Gerber H, Seipel K, Georgiev O, Hofferer M, Hug M, Rusconi S, Schaffner W (1994) Transcriptional activation modulated by homopolymeric glutamine and proline stretches. Science 263: 808–811 [DOI] [PubMed] [Google Scholar]
- Jung J‐H, Barbosa AD, Hutin S, Kumita JR, Gao M, Derwort D, Silva CS, Lai X, Pierre E, Geng F et al (2020) A prion‐like domain in ELF3 functions as a thermosensor in Arabidopsis . Nature 585: 256–260 [DOI] [PubMed] [Google Scholar]
- Kim HJ, Kim NC, Wang Y‐D, Scarborough EA, Moore J, Diaz Z, MacLea KS, Freibaum B, Li S, Molliex A et al (2013) Mutations in prion‐like domains in hnRNPA2B1 and hnRNPA1 cause multisystem proteinopathy and ALS. Nature 495: 467–473 [DOI] [PMC free article] [PubMed] [Google Scholar]
- Kosugi S, Hasebe M, Tomita M, Yanagawa H (2009) Systematic identification of cell cycle‐dependent yeast nucleocytoplasmic shuttling proteins by prediction of composite motifs. Proc Natl Acad Sci USA 106: 10171–10176 [DOI] [PMC free article] [PubMed] [Google Scholar]
- Kottenhagen N, Gramzow L, Horn F, Pohl M, Theißen G (2012) Polyglutamine and polyalanine tracts are enriched in transcription factors of plants. German conference on Bioinformatics
- Lampropoulos A, Sutikovic Z, Wenzl C, Maegele I, Lohmann JU, Forner J (2013) GreenGate ‐ a novel, versatile, and efficient cloning system for plant transgenesis. PLoS One 8: e83043 [DOI] [PMC free article] [PubMed] [Google Scholar]
- Lancaster AK, Nutter‐Upham A, Lindquist S, King OD (2014) PLAAC: a web and command‐line application to identify proteins with prion‐like amino acid composition. Bioinformatics 30: 2501–2502 [DOI] [PMC free article] [PubMed] [Google Scholar]
- Lin J‐R, Hu J (2013) SeqNLS: nuclear localization signal prediction based on frequent pattern mining and linear motif scoring. PLoS One 8: e76864 [DOI] [PMC free article] [PubMed] [Google Scholar]
- Livak KJ, Schmittgen TD (2001) Analysis of relative gene expression data using real‐time quantitative PCR and the 2(‐Delta Delta C(T)) Method. Methods 25: 402–408 [DOI] [PubMed] [Google Scholar]
- Lu R, Canher B, Bisht A, Heyman J, de Veylder L (2021) Three‐dimensional quantitative analysis of the Arabidopsis quiescent center. J Exp Bot 72: 6789–6800 [DOI] [PubMed] [Google Scholar]
- de Luis Balaguer MA, Fisher AP, Clark NM, Fernandez‐Espinosa MG, Möller BK, Weijers D, Lohmann JU, Williams C, Lorenzo O, Sozzani R (2017) Predicting gene regulatory networks by combining spatial and temporal gene expression data in Arabidopsis root stem cells. Proc Natl Acad Sci USA 114: E7632–E7640 [DOI] [PMC free article] [PubMed] [Google Scholar]
- Macknight R, Bancroft I, Page T, Lister C, Schmidt R, Love K, Westphal L, Murphy G, Sherson S, Cobbett C et al (1997) FCA, a gene controlling flowering time in Arabidopsis, encodes a protein containing RNA‐binding domains. Cell 89: 737–745 [DOI] [PubMed] [Google Scholar]
- Mähönen AP, ten Tusscher K, Siligato R, Smetana O, Díaz‐Triviño S, Salojärvi J, Wachsman G, Prasad K, Heidstra R, Scheres B (2014) PLETHORA gradient formation mechanism separates auxin responses. Nature 515: 125–129 [DOI] [PMC free article] [PubMed] [Google Scholar]
- Mao YS, Zhang B, Spector DL (2011) Biogenesis and function of nuclear bodies. Trends Genet 27: 295–306 [DOI] [PMC free article] [PubMed] [Google Scholar]
- McSwiggen DT, Mir M, Darzacq X, Tjian R (2019) Evaluating phase separation in live cells: diagnosis, caveats, and functional consequences. Genes Dev 33: 1619–1634 [DOI] [PMC free article] [PubMed] [Google Scholar]
- Meyer HM (2020) In search of function: nuclear bodies and their possible roles as plant environmental sensors. COPB 58: 33–40 [DOI] [PubMed] [Google Scholar]
- Michelitsch MD, Weissman JS (2000) A census of glutamine/asparagine‐rich regions: implications for their conserved function and the prediction of novel prions. Proc Natl Acad Sci USA 97: 11910–11915 [DOI] [PMC free article] [PubMed] [Google Scholar]
- von Mikecz A (2009) PolyQ fibrillation in the cell nucleus: who’s bad? Trends Cell Biol 19: 685–691 [DOI] [PubMed] [Google Scholar]
- Pardal R, Heidstra R (2021) Root stem cell niche networks: it’s complexed! Insights from Arabidopsis . J Exp Bot 72: 6727–6738 [DOI] [PMC free article] [PubMed] [Google Scholar]
- Pi L, Aichinger E, van der Graaff E, Llavata‐Peris CI, Weijers D, Hennig L, Groot E, Laux T (2015) Organizer‐derived WOX5 signal maintains root columella stem cells through chromatin‐mediated repression of CDF4 expression. Dev Cell 33: 576–588 [DOI] [PubMed] [Google Scholar]
- Sarkar AK, Luijten M, Miyashima S, Lenhard M, Hashimoto T, Nakajima K, Scheres B, Heidstra R, Laux T (2007) Conserved factors regulate signalling in Arabidopsis thaliana shoot and root stem cell organizers. Nature 446: 811–814 [DOI] [PubMed] [Google Scholar]
- Savina MS, Pasternak T, Omelyanchuk NA, Novikova DD, Palme K, Mironova VV , Lavrekha VV (2020) Cell dynamics in WOX5‐overexpressing root tips: the impact of local auxin biosynthesis. Front Plant Sci 11: 560169 [DOI] [PMC free article] [PubMed] [Google Scholar]
- Scarafone N, Pain C, Fratamico A, Gaspard G, Yilmaz N, Filée P, Galleni M, Matagne A, Dumoulin M (2012) Amyloid‐like fibril formation by polyQ proteins: a critical balance between the polyQ length and the constraints imposed by the host protein. PLoS One 7: e31253 [DOI] [PMC free article] [PubMed] [Google Scholar]
- Schiessl K, Kausika S, Southam P, Bush M, Sablowski R (2012) JAGGED controls growth anisotropy and coordination between cell sizeand cell cycle during plant organogenesis. Curr Biol 22: 1739–1746 [DOI] [PMC free article] [PubMed] [Google Scholar]
- Schindelin J, Arganda‐Carreras I, Frise E, Kaynig V, Longair M, Pietzsch T, Preibisch S, Rueden C, Saalfeld S, Schmid B et al (2012) Fiji: an open‐source platform for biological‐image analysis. Nat Methods 9: 676–682 [DOI] [PMC free article] [PubMed] [Google Scholar]
- Schomburg FM, Patton DA, Meinke DW, Amasino RM (2001) FPA, a gene involved in floral induction in Arabidopsis, encodes a protein containing RNA‐recognition motifs. Plant Cell 13: 1427–1436 [DOI] [PMC free article] [PubMed] [Google Scholar]
- Schwechheimer C, Smith C, Bevan MW (1998) The activities of acidic and glutamine‐rich transcriptional activation domains in plant cells: design of modular transcription factors for high‐level expression. Plant Mol Biol 36: 195–204 [DOI] [PubMed] [Google Scholar]
- Shimotohno A, Heidstra R, Blilou I, Scheres B (2018) Root stem cell niche organizer specification by molecular convergence of PLETHORA and SCARECROW transcription factor modules. Genes Dev 32: 1085–1100 [DOI] [PMC free article] [PubMed] [Google Scholar]
- Shorter J, Lindquist S (2005) Prions as adaptive conduits of memory and inheritance. Nat Rev Genet 6: 435–450 [DOI] [PubMed] [Google Scholar]
- Sonmez C, Bäurle I, Magusin A, Dreos R, Laubinger S, Weigel D, Dean C (2011) RNA 3′ processing functions of Arabidopsis FCA and FPA limit intergenic transcription. Proc Natl Acad Sci USA 108: 8508–8513 [DOI] [PMC free article] [PubMed] [Google Scholar]
- Stahl Y, Grabowski S, Bleckmann A, Kühnemuth R, Weidtkamp‐Peters S, Pinto K, Kirschner G, Schmid J, Wink RH, Hülsewede A et al (2013) Moderation of Arabidopsis root stemness by CLAVATA1 and Arabidopsis CRINKLY4 receptor kinase complexes. Curr Biol 23: 362–371 [DOI] [PubMed] [Google Scholar]
- Stahl Y, Wink RH, Ingram GC, Simon R (2009) A signaling module controlling the stem cell niche in Arabidopsis root meristems. Curr Biol 19: 909–914 [DOI] [PubMed] [Google Scholar]
- Totzeck F, Andrade‐Navarro MA, Mier P (2017) The protein structure context of PolyQ regions. PLoS One 12: e0170801 [DOI] [PMC free article] [PubMed] [Google Scholar]
- Truernit E, Bauby H, Dubreucq B, Grandjean O, Runions J, Barthélémy J, Palauqui J‐C (2008) High‐resolution whole‐mount imaging of three‐dimensional tissue organization and gene expression enables the study of Phloem development and structure in Arabidopsis . Plant Cell 20: 1494–1503 [DOI] [PMC free article] [PubMed] [Google Scholar]
- Vilarrasa‐Blasi J, González‐García M‐P, Frigola D, Fàbregas N, Alexiou K, López‐Bigas N, Rivas S, Jauneau A, Lohmann J, Benfey P et al (2014) Regulation of plant stem cell quiescence by a brassinosteroid signaling module. Dev Cell 30: 36–47 [DOI] [PubMed] [Google Scholar]
- Zhang X, Henriques R, Lin S‐S, Niu Q‐W, Chua N‐H (2006) Agrobacterium‐mediated transformation of Arabidopsis thaliana using the floral dip method. Nat Protoc 1: 641–646 [DOI] [PubMed] [Google Scholar]