

Abstract

Halogenated inorganic complexes Ax[MHaly] (A = alkali metal or alkaline earth, M = transition or main group metal, x = 1–3, and y = 2–9) are an archetypal class of compounds that provide entry points to large areas of inorganic and physical chemistry. All of the hexahalo complexes adopt an octahedral, Oh, symmetry (or nearly so). Consequently, one of the bending modes is forbidden in both the infrared and Raman spectra. In the solid state, many of the complexes crystallize in the cubic space group Fm3̅m, which preserves the octahedral symmetry. Even for those that are not cubic, the octahedral symmetry of the [MHal6]n− ion is largely retained and, to a good approximation, so are the selection rules. In the present work, we show that by using the additional information provided by neutron vibrational spectroscopy, in combination with conventional optical spectroscopies, we can generate complete and unambiguous assignments for all the modes. Comparison of the experimental and calculated transition energies for the systems where periodic-density functional theory was possible (i.e., those for which the crystal structure is known) shows that the agreement is almost quantitative. We also provide a linear relationship that enables the prediction of the forbidden mode.
Short abstract
Halogenated inorganic complexes provide entry to large areas of inorganic chemistry. All of the hexahalo complexes adopt an octahedral symmetry, so one of the bending modes is forbidden in both the infrared and Raman spectra. By using neutron vibrational spectroscopy, we can generate unambiguous assignments for all the modes. Comparison of experimental and calculated transition energies shows that the agreement is almost quantitative. We also provide a linear relationship that enables prediction of the forbidden mode.
Introduction
Halogenated inorganic complexes Ax[MHaly] (A = alkali metal or alkaline earth, M = transition or main group metal, x = 1–3, and y = 2–9) are an archetypal class of compounds that provide entry points to large areas of inorganic and physical chemistry.1,2 Of particular current interest for photovoltaic applications is CsPbBr33 and the closely related hybrid organic–inorganic perovskites that are derivatives of CsPbX3 (X = Cl, Br, or I).4−6 For light-emitting applications, Cs4PbBr67 has emerged as a very promising candidate.8 In other fields, K2[PtCl6] is used as a catalyst precursor,9 and cryolite, Na3[AlF6], as a molten salt is used as a solvent for aluminum oxides in the electrolytic refining of aluminum from its ores.10
As might be expected, the vibrational spectra of these materials have been extensively investigated for many years: the definitive reference book by Nakamoto11 lists the transition energies of almost 150 such compounds for the hexahalo complexes alone. However, for only two compounds, K2[PtCl6] and K2[IrCl6], have all of the fundamental modes of the hexahalo ions been observed and assigned.12 The reasons for this are both pragmatic and fundamental: as the halogen becomes heavier, the modes shift down in energy and become increasingly difficult to observe with conventional infrared and Raman spectroscopies. All of the hexahalo complexes adopt an octahedral, Oh, symmetry (or nearly so). Consequently, one of the bending modes is forbidden in both the infrared and Raman spectra. In the solid state, many of the complexes crystallize in the cubic space group Fm3̅m (no. 225), which preserves the octahedral symmetry. Even for those that are not cubic, the octahedral symmetry of the [MHal6]n− ion is largely retained and, to a good approximation, so are the selection rules.
In the present work, we show that by using the additional information provided by neutron vibrational spectroscopy13 [inelastic neutron scattering, (INS)], in combination with conventional optical spectroscopies, we can generate complete and unambiguous assignments for all the modes. Where the structure is available, we support the assignments with density functional theory calculations of the complete primitive cell.
INS Spectroscopy
INS spectroscopy13 is a form of vibrational spectroscopy, where the inelastic scattering event occurs between the incident neutron and an atomic nucleus. This has a number of consequences, and for the present purposes the key one is that there are no selection rules and all modes are allowed. This is illustrated in Figure 1 for K2[PtBr6], which crystallizes14 in the cubic face centered space group Fm3̅m with the complex ion on a site of Oh symmetry. Table 1 lists the modes, the spectral activity, their numbering, and the symmetry for an A2[MHal6] material with an Fm3̅m symmetry and one formula unit in the primitive cell. From Table 1, it can be seen that there should be no coincidences in the infrared and Raman spectra, and this is indeed the case in Figure 1. In contrast, all the modes are allowed in the INS spectrum and all are seen, including those forbidden in the infrared and Raman spectra. This highlights the complementarity of the three forms of spectroscopy: symmetry assignments are unambiguous from the infrared and Raman spectra and, by inspection, the optically forbidden modes may be located from the INS spectrum.
Figure 1.
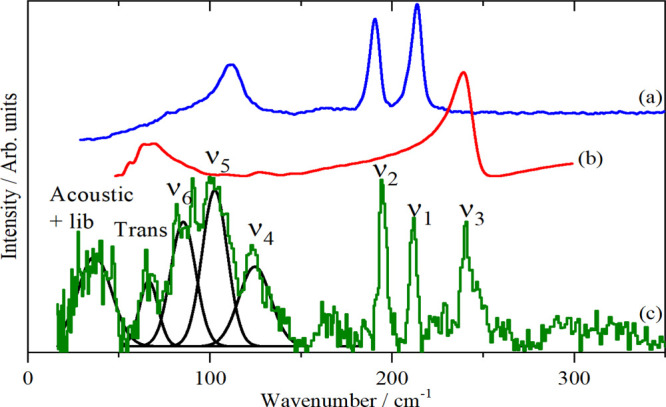
Vibrational spectra of K2[PtBr6]: (a) Raman recorded with 785 nm excitation at room temperature, (b) infrared at room temperature, and (c) INS recorded on TOSCA at <20 K.
Table 1. Modes, Spectral Activity, Numbering, and Symmetry for an A2[MHal6] Material with a Fm3̅m Symmetry, One Formula Unit in the Primitive Cell, the Complex Ion on the Oh Site, and the Counterion on the Td Site.
| activity |
|||||
|---|---|---|---|---|---|
| mode | description | symmetry | IR | R | INS |
| ν1 | symmetric M–Hal stretch | A1g | × | √ | √ |
| ν2 | symmetric M–Hal stretch | Eg | × | √ | √ |
| ν3 | asymmetric M–Hal stretch | T1u | √ | × | √ |
| ν4 | asymmetric Hal–M–Hal bend | T1u | √ | × | √ |
| ν5 | symmetric Hal–M–Hal bend | T2g | × | √ | √ |
| ν6 | asymmetric Hal–M–Hal bend | T2u | × | × | √ |
| ν7 | libration | T1g | × | × | √ |
| ν8 | optic translation | T1u | √ | × | √ |
| ν9 | optic translation | T2g | × | √ | √ |
| ν10 | acoustic translation | T1u | × | × | √ |
The intensity, S(Q,ω), is determined by the total scattering cross section of the atom and the amplitude of motion of the atoms in the vibrational mode. The cross section is both element and isotope dependent, for the halogens15 it is: 19F = 4.0, 35Cl = 21.8, 37Cl = 1.2, 79Br = 5.96, 81Br = 5.84, and 127I = 3.8 b [15] (1 b = 10–28 m2). For comparison, 1H = 82.0 b and this in combination with it being the lightest element (and hence having the largest amplitude of motion) is the reason that INS spectroscopy of chemical systems is dominated by studies of hydrogenous materials.13
However, it can be seen that the majority Cl isotope, 35Cl (75.8%), has an appreciable total scattering cross section of 21.8 b, which enabled the INS spectra of the K2[PtCl6] and K2[IrCl6]12 complexes to be recorded in a reasonable time (12 h or so). The other halogens are much less favorable. The smaller mass of F relative to Cl means that the amplitude of motion (and hence INS intensity) is larger but, until recently, this was insufficient to compensate for the much smaller cross section even with a 20 g sample and a measurement time of 24 h, see Figure S1.
As Figure 1 shows, this situation has changed in recent years. TOSCA at ISIS has undergone an upgrade that has greatly boosted the incident flux in the region of interest below 1000 cm–1.16 Even more significantly, a new instrument, VISION17 at the spallation neutron source (SNS, Oak Ridge, TN, USA), has become operational, which has unprecedented sensitivity. As we will show, these instruments now allow even the most unfavorable systems, those containing Br or I, to be routinely measured.
Experimental Section
Materials
K2[SiF6], Na2[SiF6], K2[TiF6], K[PF6], and Na3[AlF6] were purchased from Aldrich. K2[ReCl6], K2[IrCl6], K2[PtBr6], K2[PtI6] were purchased from Alfa Aesar. All compounds were used as received. It should be noted that in addition to the materials listed, several other compounds were purchased from reputable vendors; however, their spectra were incompatible with the stated composition. Caveat emptor!
Infrared Spectroscopy
Room-temperature infrared spectra (50–4000 cm–1, 4 cm–1 resolution, 64 scans, 8 × zero filling) were recorded with a Bruker Vertex 70 Fourier transform infrared spectrometer using a Bruker Platinum single reflection attenuated total internal reflection accessory. Some spectra were also measured in transmission as polyethylene discs (∼1 wt % in low density polyethylene). The low wavenumber limit (∼50 cm–1) is determined by the very low output of the globar infrared source at these energies, resulting in almost no signal.
Raman Spectroscopy
Raman spectra were measured with a variety of instruments and excitation wavelengths. FT-Raman spectra were recorded at room temperature with a Bruker MultiRam spectrometer using 1064 nm excitation (500 mW laser power and 1024 scans at 1 or 4 cm–1 resolution). Multi-wavelength (405, 532, 633, and 785 nm) Raman spectra were recorded with a Renishaw InVia Raman microscope system. Some spectra were also obtained with a Bruker Senterra system using 532 and 785 nm excitation. Variable temperature (13–300 K) Raman spectra were recorded with a modified Renishaw InVia spectrometer using 785 nm excitation that has been previously described.18 The low wavenumber limit (∼40 cm–1 for all the spectrometers) is set by the cutoff of the notch filter used to reject the laser line.
INS Spectroscopy
INS spectra were recorded with the broad band, high-resolution indirect geometry spectrometers TOSCA16 (and its predecessor TFXA19) at ISIS and VISION17 at SNS. At ISIS, the sample size was typically ∼10 g and measurement times ranged from 6 to 24 h. VISION is considerably more sensitive, so sample sizes were ∼5 g with a few hours of measurement time. All spectra were measured below 20 K unless noted otherwise.
Computational Studies
Dispersion-corrected periodic density functional theory (DFT-D) calculations were carried out with CASTEP (version 17.21).20 On-the-fly generated norm-conserving pseudopotentials were used with the PBE21 functional with the Tkatchenko–Scheffler (TS) dispersion correction scheme22 using the generalized gradient approximation (GGA). The plane wave cutoffs and the Brillouin zone sampling of electronic states are given in Table S12. The equilibrium structure was obtained by BFGS geometry optimization and converged to, typically, |0.001| eV Å–1. Phonon frequencies were obtained by diagonalization of the dynamical matrix, computed using density functional perturbation theory,23 to compute the dielectric response and the Born effective charges and, from these, the mode oscillator strength tensor and infrared absorptivity were calculated. Raman intensities were calculated by a finite displacement method.24 In addition to the calculation of transition energies at zero wavevector, phonon dispersion was also calculated along high symmetry directions throughout the Brillouin zone. For this purpose, dynamical matrices were computed on a regular grid of wavevectors throughout the Brillouin zone, and Fourier interpolation was used to extend the computed grid to the desired fine set of points along the high-symmetry paths.25 The atomic displacements in each mode, that are part of the CASTEP output, enable visualization of the modes in Materials Studio26 to aid assignments and are also all that is required to generate the INS spectrum via ACLIMAX (version 6.0.0 LE).27 It is emphasized that the calculated transition energies have not been scaled.
Results
In this section, we will provide examples of the spectra of hexahalo complexes for all of the halogens. The assignments will be supported, where possible, by DFT calculations of the primitive cell. We will conclude by comparing all of the experimental and DFT transition energies, in order to provide estimates of the reliability of the DFT results for each mode. The observed transition energies and assignments are given in Table 2. The calculated transition energies at the Brillouin zone Γ-point and the dispersion curves are provided as tables and figures in the Supporting Information.
Table 2. Observed and Calculated Transition Energies (cm–1) of the Ax[MHaly] Complexes.
| K2[SiF6] |
Na2[SiF6] |
K2[TiF6] |
K[PF6] |
Na3[AlF6] |
K2[ReCl6] | K2[IrCl6] | K2[PtCl6] |
K2[PtBr6] | K2[PtI6] |
||||||||
|---|---|---|---|---|---|---|---|---|---|---|---|---|---|---|---|---|---|
| exp | cal | exp | calb | exp | cal | exp | calb | exp | cal | exp | exp | exp | cal | exp | exp | calb | |
| SG | Fm3̅m | P321 | P3̅m1 | C2/n | P21/n | Fm3̅m | Fm3̅m | Fm3̅m | Fm3̅m | P21/c | |||||||
| site | Oh | C3, D3 | D3d | Ci | Oh | Oh | Oh | ||||||||||
| ν1 | 656 | 632 | 663 | 645 | 614 | 592 | 751 | 711 | 553 | 541 | 359 | 350 | 346 | 315 | 223 | 151 | 146 |
| ν2 | 478 | 471 | 479 | 469 | 450 | 452 | 588 | 539 | 396 | 415 | 302 | 310 | 325 | 295 | 206 | 132 | 127 |
| 579 | |||||||||||||||||
| 573 | |||||||||||||||||
| ν3 | 722 | 718 | 707 | 729 | 532 | 552 | 786 | 789 | 560 | 590 | 315 | 330 | 346 | 318 | 251 | 186 | 177 |
| 542 | |||||||||||||||||
| ν4 | 477 | 460 | 492 | 481 | 308 | 298 | 545 | 557 | 414 | 395 | 166 | 177 | 183 | 188 | 135 | 95 | 89 |
| 473 | 274 | 294 | 394 | ||||||||||||||
| ν5 | 408 | 392 | 408 | 396 | 305 | 286 | 485 | 476 | 344 | 327 | 174 | 166 | 164 | 167 | 112 | 77 | 71 |
| 292 | 260 | 479 | |||||||||||||||
| 474 | |||||||||||||||||
| ν6 | 272 | 258 | 284 | 282 | 198 | 179 | 324, | 313 | 278 | 272 | 132 | 143 | 147 | 140 | 96 | 62 | 57 |
| 187 | 318, | 257 | |||||||||||||||
| , | 178 | 310 | |||||||||||||||
| ν7 lib | 81 | 68 | 81 | 86 | 48 | 55 | 28 | 31 | 32 | ||||||||
| 55 | |||||||||||||||||
| ν8 IR trans | 114 | 128 | 115 | 75/106a | 83 | 80 | 111 | 87 | |||||||||
| 93 | |||||||||||||||||
| ν9 Raman trans | 125 | 124 | 124 | 80 | 80 | 82 | |||||||||||
| 97 | |||||||||||||||||
LOTO splitting.
Average of site and factor group components.
Fluoro Complexes
We will begin with K2[SiF6] because this is the simplest material as it has a cubic (Fm3̅m) symmetry;28 systems with a lower symmetry (Na2[SiF6], K2[TiF6], K[PF6], and Na3[AlF6]) will then be considered.
K2[SiF6]
Figure 2 shows the Raman, infrared, and INS spectra of the material. The combination of the three techniques with the cubic symmetry means that the assignment is straightforward, as listed in Table 2. The only noteworthy feature is that ν2 and ν4 are almost accidentally degenerate. The assignments are confirmed by comparison with the INS spectrum generated from the DFT calculation (Table S1 and Figure S2), Figure 2d.
Figure 2.

Vibrational spectra of K2[SiF6]: (a) Raman recorded with 1064 nm excitation at room temperature, (b) infrared at room temperature, and (c) INS recorded on TOSCA at <20 K and (d) INS spectrum generated from the CASTEP output in space group Fm3̅m.
Na2[SiF6]
In contrast to the potassium salt, the structure of the sodium salt is still debated with triclinic, P1,29 and trigonal, P321,30,31 structures having been proposed. Both structures have Z = 3, (Z is the number of formula units in the unit cell), but the site symmetry is different: C1 in P1 and C3 and D3 in P321. In C1, all degeneracies are formally removed and all modes are infrared and Raman allowed, in C3 and D3, T modes split to A + E and all modes are allowed. However, as usual, both proposed structures have [SiF6]2– ions with an almost Oh symmetry, so the optical selection rules would still be expected to be largely valid. The correlation table is given in Table S2.
Figure 3a–c shows the Raman, infrared, and INS spectra and Figure 3d shows the results of a DFT calculation based on the P32120 structure. The Raman spectrum is very similar to that of K2[SiF6] and is assigned similarly: ν1, ν2, and ν5 (from high to low). The infrared and INS spectra are more interesting and the lower symmetry is particularly evident in the lattice mode region below 250 cm–1 where there are many more modes, reflecting that there are now nine, rather than three, ions in the primitive cell. ν3 and ν4 are clearly seen in the infrared spectrum, as with K2[SiF6], ν2 and ν4 are almost coincident, the latter is split by the lower site symmetry. There is no evidence for ν1 or ν5 in the infrared spectrum but there is a very weak band at 279 cm–1 which the INS shows is ν6. The calculated (Table S3 and Figure S3), INS spectrum, Figure 3d, is in reasonable agreement with the experimental one and thus supports (but does not prove) the P32130,31 structure.
Figure 3.

Vibrational spectra of Na2[SiF6]: (a) Raman recorded with 1064 nm excitation at room temperature, (b) infrared at room temperature, (c) INS recorded on VISION at <20 K, and (d) INS spectrum of the P321 structure generated from the CASTEP output.
The mode animations from the calculations show that the low site symmetry, in particular the absence of a center of symmetry, results in a partial breakdown of the Oh selection rules. This is apparent from the correlation table for the complex assuming the P321 structure, as listed in Table S3. This is also shown by one of the components of ν2 having significant infrared activity and the mixing of the translational and librational modes, particularly for the lower symmetry C3 site.
A series of 11 hexafluorosilicate salts were previously measured.32 The assignments are largely in agreement with those given here, with the exception of ν6. This was estimated at 325 cm–1, whereas the present work shows it to be at 279 and 272 cm–1 in the Na and K salts, respectively.
K2[TiF6]
At room temperature, this material crystallizes in the trigonal space group P3̅m1 (no. 164) with Z = 1 and the complex ion on a D3d site.33 The infrared and Raman spectroscopy have been comprehensively investigated34 and all the modes observed except for ν2 and ν6. Figure 4 shows the observed spectra and the calculated INS spectra (Table S4 and Figure S4).
Figure 4.

Vibrational spectra of K2[TiF6]: (a) Raman recorded with 1064 nm excitation at room temperature, (b) infrared at room temperature, (c) INS recorded on VISION at <20 K, and (d) INS spectrum generated from the CASTEP output in space group P3̅m1.
From the INS spectrum, by inspection ν1 and ν3 are seen at 618 and 550 cm–1, ν2 is apparent at 477 cm–1 and ν6 at 150–200 cm–1. ν4 and ν5 are almost coincident and account for the complex feature at 250–350 cm–1. The calculated spectrum is in reasonable agreement with the experimental data, but the agreement is not as good as would be expected. The structure33 was determined at room temperature, and it is possible that there is a phase transition at lower temperatures. Nonetheless, the result is sufficiently close to enable unambiguous assignments to be made. The asymmetric shape of ν2 and the feature at 650 cm–1 are the result of significant dispersion in ν2 and ν3, respectively, see Figure S4.
K[PF6]
This material has an interesting phase diagram.35−38 The room-temperature phase I is cubic (Fm3̅m) but with tilted, orientationally disordered PF6 octahedra. At around 256 K (the values vary in the literature), the monoclinic (A2/n) phase II forms. Below 210 K, the low-temperature phase III occurs, which is also monoclinic, but C2/n with Z = 4. The atomic coordinates are only available in a thesis36 and are reproduced in Table S5. Figure 5 shows the Raman, infrared, and INS spectra of K[PF6] in phase III. The infrared and Raman spectra are in good agreement with previous works,38 but because the structure was not known and in the absence of the INS spectrum at that time, only tentative assignments were possible.
Figure 5.

Vibrational spectra of K[PF6] in phase III: (a) Raman recorded with 785 nm excitation at 45 K, (b) ordinate (×12) and abscissa (×2) expanded Raman spectrum at 45 K in the ν2 and ν4 region, (c) infrared at 150 K, (d) INS recorded on VISION at <20 K, and (e) INS spectrum generated from the CASTEP output of the primitive cell of the C2/n space group. [The asterisks in (a) denote bands from the sapphire window].
From the structure,36 the complex ion is known to be on a Ci site. Despite the low-site symmetry, the P–F bonds are all almost equal (1.602, 1.603, and 1.608 Å), consequently the Oh selection rules are largely obeyed, making the assignment straightforward: ν1 at 544 cm–1, ν2 at 588/578/574 cm–1, ν3 at 786 cm–1, ν4 at 509 cm–1, ν5 at 485/479/473 cm–1, and ν6 at 324/318/310 cm–1. The calculated INS spectrum is in excellent agreement apart from the P–F stretch modes, which are slightly underestimated (Table S6 and Figure S5). This may be a result of the calculated P–F distances being slightly longer (1.606, 1.607, and 1.609 Å) than the experimental values.
Na3[AlF6]
This material is better known as the mineral cryolite and the spectra (including the INS) have been comprehensively assigned previously.39 The spectra are shown in Figure S6.
Chloro Complexes
As discussed in the Introduction, the chloro complexes are the most favorable for INS studies because of the large incoherent cross section of 35Cl. Despite this, inspection of the INS spectra of the chloro complexes (Figures 6, 7 and S7) shows that the signal-to-noise ratio is markedly inferior to that of the fluoro complexes (Figures 2–5 and S6). The chloro spectra were measured with a first generation instrument (TFXA13). The spectra of the fluoro complexes emphasizes the enormous gains in flux and sensitivity that state-of-the-art instrumentation (the upgraded TOSCA16 and VISION17) have achieved.
Figure 6.
Variable temperature INS spectra of K2[ReCl6] recorded on TFXA: (a) 120 K, cubic, (b) 107 K, tetragonal, (c) 90 K, monoclinic, (d) 25 K, possibly tetragonal, and (e) 5 K, unknown structure but antiferromagnetically ordered.
Figure 7.

Vibrational spectra of K2[IrCl6]: (a) Raman (785 nm) at room temperature, (b) infrared as a polyethylene disc at room temperature, and (c) INS at 5 K recorded on TFXA.
The INS spectra of K2[PtCl6] and K2[IrCl6] have been previously reported;12 however, the analysis only considered the isolated [MCl6]2– ion with an empirical force field. We have re-analyzed the spectra with DFT and present new data for K2[ReCl6].
K2[ReCl6]
While K2[ReCl6] is cubic at room temperature,40 it undergoes a series of phase transitions as the temperature is lowered:41,42
Below 12.3 K, the compound orders antiferromagnetically with an associated structural change,43 neither of the low-temperature structures is known. The spectroscopy has been the subject of an extraordinarily detailed investigation by O’Leary and Wheeler42 that has characterized the spectra in each of the phases. The work has shown that the [ReCl6]2– ion remains octahedral in all the phases and that the phase transitions occur as a result of successive small tilts of the octahedra.42−44
The spectra in the cubic phase, Figure S9, are in complete agreement with the literature.42,45 The INS spectra in each of the five phases are shown in Figure 6. Apart from minor differences in intensity as a result of the changing Debye–Waller factor, the spectra are essentially identical. This is consistent with the various phases differing only in the tilts of the ReCl6 octahedra. The absence of selection rules means that all modes are allowed in all phases. As the overall structure does not change by very much, the INS spectra are largely invariant to the phase.
We were unable to calculate the spectra for K2[ReCl6] as the structure of the low temperature phase is unknown. Attempts to model the spectra using the cubic room temperature structure were unsuccessful. The dispersion curves showed negative values at the Γ and the X-points in the Brillouin zone for the librational modes, that is, they are imaginary modes, see Figure S10. This is in complete agreement with the work of O’Leary and Wheeler42 who concluded that the phase transitions are driven by the softening of these modes.
K2[IrCl6]
K2[IrCl6] is reported to be cubic down to the Néel temperature of 3 K, where it magnetically orders.46 The spectroscopy of K2[IrCl6] has been investigated45,47,48 and our infrared and Raman spectra, Figure 7a,b, are in general agreement with the literature. The infrared and Raman spectra show that ν1 occurs at 350 cm–1, ν3 at 330 cm–1, and ν2 at 310 cm–1. ν2 has only been previously observed in solution by Raman spectroscopy.37 The INS spectrum, Figure 7c, confirms that ν4 and ν5 are almost accidentally degenerate and ν6 is clearly seen at 143 cm–1. It is surprising that the infrared spectrum shows two bands at 135 and 155 cm–1, both are close to the position of ν6 but for it to be activated would require that the cubic symmetry is broken and there is no other evidence for this. The T1u translational mode is the intense infrared band at 85 cm–1 (also seen in the INS) and we assign the 135 cm–1 band as a combination of this mode and the T1g translational mode at 50 cm–1. The product (T1u ⊗ T1g = A1u + Eu + T1u + T2u) has a T1u component that is allowed in the infrared spectrum. The 155 cm–1 band is more difficult, we note that room temperature corresponds to ∼200 cm–1, thus there will be appreciable population of the modes, and hence we assign this mode to a hot band (ν3–ν5): 155 = 330–175 cm–1. As with the 135 cm–1 band, the product (T1u ⊗ T2g = A2u + Eu + T1u + T2u) has a T1u component that is infrared allowed.
K2[PtCl6]
The spectra of K2[PtCl6] are shown in Figure S7 and the assignments are given in Table 2. The calculated data are in Table S7 and Figure S8.
Bromo and Iodo Complexes
The combination of small cross sections with large mass means that the bromo and iodo complexes are the most challenging of the hexahalo quartet for INS spectroscopy. As the modes occur below ∼300 cm–1, this has also made observing the modes by infrared spectroscopy non-routine. This arises because infrared spectrometers commonly use KBr optics, which sets the low wavenumber limit to 400 cm–1.
K2[PtBr6]
The assignment of the spectra is given in Figure 1 and for ν1, ν2, ν3, and ν5 that is unambiguous. Previous work45,48,49 assigned ν4 at 78 or 128 cm–1, and it is apparent that the latter is correct and that the 78 cm–1 feature is the infrared active translational mode, ν8. The ambiguity arose because ν4 is unusually weak in the infrared spectrum.
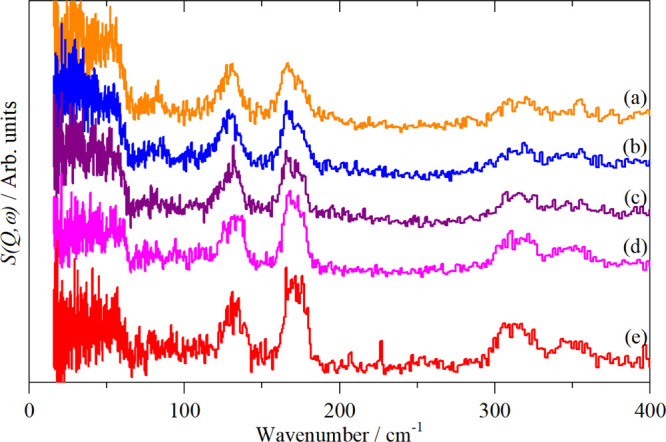
As with K2[ReCl6], K2[PtBr6] also undergoes a series of phase transitions as the temperature is lowered:50
Variable temperature Raman spectra, Figure 8, show minor changes in the position of ν2 and almost no change in ν1. In the low-temperature phase, ν5 has apparently split into three bands, which would favor the C2/c choice of the space group. This is because with a monoclinic symmetry the threefold degeneracy of the OhT modes is completely removed whereas with a tetragonal symmetry, the T modes split to A and E modes. Unfortunately, this is not conclusive because the presence of more than one molecule in the primitive cell means that a factor group splitting is present and this may account for the additional modes. However, this would also be the case for ν1 and ν2 and neither shows additional modes, suggesting that the factor group splitting is small. On balance, the spectroscopy favors the monoclinic choice.
Figure 8.

Variable temperature Raman spectra (785 nm excitation) of K2[PtBr6] at: (a) 250 K, cubic, (b) 220 K, cubic, (c) 156 K, tetragonal, (d) 122 K, monoclinic, and (e) 22 K, tetragonal or monoclinic. The dashed vertical lines indicate the position of ν1, ν2, and ν5 in the cubic phase.
An attempt to investigate anharmonicity in K2[PtBr6] by the observation of an overtone progression, as seen in the ammonium salt,51 was unsuccessful (see the Supporting Information).
K2[PtI6]
The vibrational spectra are shown in Figure 9. The Raman spectrum is straightforward with ν1 and ν2 at 152 and 128 cm–1, respectively, as seen previously51,52 and confirmed by solution polarization measurements.51 The intense infrared mode at 184 cm–1 is clearly ν3.45,53 The assignment of the remaining modes is much less obvious. There are two reasons for this: first, the large mass of iodine means that bending modes overlap with the external modes, making the INS spectrum particularly congested. Second, the infrared spectrum is unexpectedly complex, with many more modes than expected and is highly problematic.
Figure 9.

Vibrational spectra of K2[PtI6]: (a) Raman at room temperature (1064 nm excitation), (b) infrared at room temperature, and (c) INS at 5 K recorded on VISION.
This material is unusual in that the room-temperature structure is tetragonal,54Pmnc, rather than cubic, and Z = 2. All attempts to calculate the spectra in Pmnc were unsuccessful and resulted in the doubly degenerate librational mode being imaginary. This strongly suggests that below room temperature there is a phase transition to a structure of a lower symmetry. This behavior is reminiscent of K2[ReCl6] and K2[PtBr6], where, as the temperature is reduced, a series of tilts of the octahedra result in a monoclinic structure. For K2[PtI6], tilting the octahedra produces a monoclinic structure with the space group P21/c (Z = 2), as shown in Figure S12. This structure has all real modes across the entire Brillouin zone (see Figure S13 and Table S8), showing that it is dynamically stable. As Figure 10a,b shows, there is good agreement with the experimental spectrum.
Figure 10.

Top panel: (a) INS spectrum of K2[PtI6] at 5 K recorded on VISION and (b) generated from the CASTEP output of the calculation in the space group P21/c. Lower panel: contributions (fundamentals only) to the calculated INS spectrum (c) from: (d) K, (e) I, and (f) Pt. (f) is ×2 ordinate expanded relative to (d,e).
The correlation tables for K2[PtI6] in Pmnc and P21/c are given in Tables S9 and S10. In both space groups, the center-of-symmetry is retained, thus gerade (g) and ungerade (u) modes in Oh retain their character in the non-cubic space groups, so the rule of mutual exclusion should still hold. The reduction in symmetry means that ν6 is now allowed in the infrared spectrum. More significantly, the K+ translational modes now have the same symmetry as the internal modes and so are allowed to mix with all of them.
The INS spectrum can be decomposed into the individual contributions from K, I, and Pt, as shown in Figure 10c–e. These confirm the assignments of ν1, ν2, and ν3: the first two only involve motion of I, while the last also has motion of Pt, exactly as expected for g and u modes, respectively. These have energies above those of the translational modes, so they do not mix with them and are relatively pure modes.
The Raman spectra52 of a series of amine salts of the hexaiodoplatinate ions show a mode around 114 cm–1 that was assigned as ν5 or a lattice mode. Our Raman spectrum does not show this mode, but there is a strong mode at 111 cm–1 in the INS spectrum. Figure 10c–e shows that this mode has a major contribution from K and almost nothing from I, showing that it is a K translational, that is, lattice mode.
The region 40–100 cm–1 in the INS spectrum shows three peaks at 60, 75 and 95 cm–1, each with some sub-structure. The latter arises from the reduction of symmetry (removal of degeneracies) and the factor group splitting. The elemental decomposition shows that all three modes have substantial contributions from both K and I motions. Mode visualization from the CASTEP calculation shows that these are ν6, ν5, and ν4 (from low to high energy). A close inspection of the Raman spectrum shows a weak band at 78 cm–1 consistent with the INS spectrum and it being ν5.
The region 0–40 cm–1 is not accessible with our infrared or Raman spectrometers (see the Experimental Section) but is readily seen by INS. The mode visualizations and Figure 10d–f show that this region is dominated by the translations and librations.
As stated earlier, the infrared spectrum is problematic. The selection rules predict that the Raman active modes ν1, ν2, and ν5 should not appear in the infrared spectrum. This prediction is not met: ν1 and ν5 are clearly present, ν2 may also be weakly present. After ν3, ν6 is the strongest mode present, this is unexpected, as although allowed, it would be expected to be weak. Overall, the spectrum suggests a symmetry much lower than Pmnc. We currently have no explanation for this result.
Discussion
One of the aims of this work was to investigate how the combination of INS spectroscopy with infrared and Raman spectroscopies could be used to provide complete assignments for hexahalo systems. This has been comprehensively achieved. For hexafluoro systems, the current generation of INS spectrometers are easily able to measure the spectra. The spectra are spread across the 0–1000 cm–1 range, so the modes are relatively well separated which simplifies assignments. The hexachloro systems are also straightforward. The most challenging are the hexabromo and hexaiodo materials, but even these are tractable. The difficulty with these is not acquisition of spectra, but that all of the modes occur in only a 250 cm–1 span, meaning that they are highly overlapped. However, even these can largely be assigned by inspection, for example, K2[PtBr6], Figure 1.
One potential area of concern was the question of how relevant data that was obtained below 20 K, that is, INS was to room-temperature spectra. As Figure 6 shows, the INS spectra are almost invariant with temperature, despite the occurrence of multiple phase transitions. This is a consequence of the absence of selection rules: the phase transitions result in only minor changes to the structure, so the local spatial arrangement of the atoms is largely unchanged, so the spectrum is also unchanged. This means that low temperature INS data can be readily applied to the analysis of room-temperature infrared and Raman spectra, even if there are phase changes below room temperature.
A second aim of the work was to verify that DFT was able to accurately describe these systems. As shown by the comparison of observed and calculated INS spectra in Figures 2c,d, 3c,d, 4c,d, 5d,e, 6c,d, and 10a,b, the description is very good. Figure 11 compares the experimental and calculated transition energies for all of the systems where DFT was possible. It is clear that the agreement is almost quantitative.
Figure 11.

Comparison of experimental and DFT calculated transition energies for hexahalo materials. Key: cyan: K[PF6], purple: K2[SiF6], orange: Na2[SiF6], blue: K2[TiF6], magenta: Na3[AlF6], dark yellow: K2[PtCl6], and red: K2[PtI6]. The black line is a least squares fit to the data.
This work has increased the number of systems for which ν6 is known by ∼30% (see Table S11). Thus it is interest to see if there are any systematic trends that can be exploited to estimate ν6, if the other modes are known. A trivial result is that ν6 always occurs below ν4 and ν5 and generally below ν5 because in almost all cases ν4 ≥ ν5. Table 2 shows that this is true for all the examples studied here11 and lists only a few cases where ν5 ≥ ν4. Figure 12 compares the transition energies for ν5 and ν6. It can be seen that there is a simple linear relationship between ν5 and ν6, enabling prediction of the latter. The four points that are circled are apparently anomalous and were omitted from the fit. Inclusion of these points does not change the fit parameters greatly but does result in an almost 10-fold increase in the residual sum of squares.
Figure 12.

Comparison of ν5 and ν6 transition energies for hexahalo materials. Points in magenta are from the present work (Table 2) and those in blue are from the literature (see Table S11 for values and references). The black line is a least squares fit to the points and the orange line is ν6 = ν5/√2 (Wilson’s rule). The circled points (red) were omitted from the least squares fit (see text).
Inspection of the original literature shows that the assignment for [CrCl6]3– as the Rb salt55 (in the upper left circle) is based on the presence of a shoulder on the low energy side of ν4. The structure of Rb3[CrCl6] is unknown, but the analogous Cs salt is orthorhombic,56Pnnm, with Z = 6. The presence of multiple ions in the primitive cell means that factor group splitting will be present, which may account for the shoulder on ν4. We note that there is no other example known where ν5 = ν6.
The three lower points are for TcF6, WF6, and MoF6 (from top to bottom).57−60 The assignment of ν6 here is based on the observation of the Raman allowed overtone 2ν6 in the gas phase. The Raman method is critically dependent on correct identification of the overtone, in systems such as these where there is significant population of excited states and hence, the presence of hot bands, this is not straightforward. For several systems (e.g. SF6, UF6) where ν6 has been determined by both this method and other techniques, the agreement is within a few wavenumbers (Table S11). However, ReF6 shows that this is not always the case and this is particularly so for MoF6, where values for ν6 of 117, 140, and 234 cm–1 have been proposed.57,61,62 A similar situation exists for WF6, where gas phase studies show ν6 at 127 cm–1, whereas it is observed at 147 cm–1 in the solid state.61 We note that ν6 at 140 and 147 cm–1, for MoF6 and WF6, respectively, would place them close to the least squares line. It is possible that there is a large shift between the gas phase and solid-state transition energies for these molecules (and by inference also for TcF6), but if so, it is very surprising that this is only true for ν6: ν1 to ν5 only show shifts of a few wavenumbers.
There have been a number of attempts to calculate ν6. The oldest method63 is based on a diagonal force field from which the relationship ν6 = ν5/√2 (Wilson’s rule) is obtained. This is plotted in Figure 12 as the solid orange line, and it can be seen that it is a reasonable approximation. However, the residual sum of squares is about triple that of the least squares fit (black line). A range of more sophisticated force fields have also been investigated,64,65 these generally do not predict ν6 any better than Wilson’s rule.
Conclusions
In the present work, we have demonstrated that the addition of INS spectra to conventional infrared and Raman spectra enables unambiguous assignment of the internal M–X stretch and X–M–X bending modes by inspection. For cubic systems, the librational and translational modes are also readily assigned. For materials with a lower crystal symmetry, periodic-DFT provides a straightforward method for symmetry assignments, albeit it does require that the crystal structure of the low-temperature phase is known.
We have also shown that ν6 can be predicted with good accuracy, if ν5 is known (which is generally the case). If the apparently anomalous cases of TcF6, WF6, and MoF6 are omitted, the linear relation ν6 = 18 + 0.63ν5 predicts ν6 to better than 10% accuracy.
As has been mentioned, the INS spectra emphasize the enormous gains in sensitivity that have been achieved by modern instrumentation. The performance of VISION at SNS is so good that it is possible to obtain excellent quality spectra from only a few grams of material that has almost no cross section. This capability has obvious implications for the investigation of the inorganic halo perovskites that are of interest as photovoltaic materials. Phonons in these materials are important as they are involved in energy dissipation and may drive the structural phase changes that are commonly found in perovskites.
While INS spectroscopy may be considered a rare and exotic form of vibrational spectroscopy, in practice, it is readily accessible. The major facilities, ISIS (UK), SNS (USA), and Institut Laue Langevin (ILL, France) all operate a “mail-in” system, whereby all that is required is that the sample is “standard” (i.e., solid or liquid at room temperature and can be handled in air) and that sufficient information (usually just the composition) is provided to enable chemical and radiological safety assessments to be made.
Acknowledgments
The STFC Rutherford Appleton Laboratory is thanked for granting access to neutron beam facilities. We would like to thank Dr James W. Taylor for help with the Bruker Senterra instrument in the Materials Characterization Laboratory at the ISIS Neutron and Muon Source. Computing resources (time on the SCARF compute cluster for the CASTEP calculations) were provided by STFC’s e-Science facility. This research was performed with the aid of facilities at the Research Complex at Harwell, including the FT-Raman spectrometer. The authors would like to thank the Research Complex for providing access to, and support of, these facilities and equipment. The INS studies, in part, used the VISION spectrometer at the Spallation Neutron Source, Oak Ridge National Laboratory, as DOE Office of Science User Facility under contract no. DEAC0500OR22725 with UT Battelle, LLC.
Supporting Information Available
The Supporting Information is available free of charge at https://pubs.acs.org/doi/10.1021/acs.inorgchem.2c00125.
INS spectra of cryolite over time; calculated dispersion curves and transition energies (with assignments) of K2[SiF6], Na2[SiF6], K2[TiF6], K[PF6], K2[PtCl6], K2[ReCl6], and K2[PtI6]; cif file for K[PF6] in phase III; structure of K2[PtI6]; correlation tables for Na2[SiF6] and K2[PtI6]; discussion and spectra of Na3[AlF6] and K2[PtCl6]; and multiwavelength Raman spectra of K2[PtBr6] (PDF)
Author Contributions
The manuscript was written through contributions of all authors. All authors have given approval to the final version of the manuscript.
The authors declare no competing financial interest.
Supplementary Material
References
- Cotton F. A.; Wilkinson G.; Murillo C. A.; Bochmann M.. Advanced Inorganic Chemistry, 6th ed.; Wiley-Interscience: New York, 1999. [Google Scholar]
- Greenwood N. N.; Earnshaw A.. Chemistry of the Elements; Pergamon Press: Oxford, 1990. [Google Scholar]
- Huang C.-Y.; Wu C.-C.; Wu C.-L.; Lin C.-W. CsPbBr3 perovskite powder, a robust and mass-producible single-source precursor: synthesis, characterization, and optoelectronic applications. ACS Omega 2019, 4, 8081–8086. 10.1021/acsomega.9b00385. [DOI] [PMC free article] [PubMed] [Google Scholar]
- Kojima A.; Teshima K.; Shirai Y.; Miyasaka T. Organometal halide perovskites as visible-light sensitizers for photovoltaic cells. J. Am. Chem. Soc. 2009, 131, 6050–6051. 10.1021/ja809598r. [DOI] [PubMed] [Google Scholar]
- Saparov B.; Mitzi D. B. Organic–inorganic perovskites: structural versatility for functional materials design. Chem. Rev. 2016, 116, 4558–4596. 10.1021/acs.chemrev.5b00715. [DOI] [PubMed] [Google Scholar]
- Grätzel M. The rise of highly efficient and stable perovskite solar cells. Acc. Chem. Res. 2017, 50, 487–491. 10.1021/acs.accounts.6b00492. [DOI] [PubMed] [Google Scholar]
- Saidaminov M. I.; Almutlaq J.; Sarmah S.; Dursun I.; Zhumekenov A. A.; Begum R.; Pan J.; Cho N.; Mohammed O. F.; Bakr O. M. Pure Cs4PbBr6: highly luminescent zero-dimensional perovskite solids. ACS Energy Lett. 2016, 1, 840–845. 10.1021/acsenergylett.6b00396. [DOI] [Google Scholar]
- Zhang Y.; Saidaminov M. I.; Dursun I.; Yang H.; Murali B.; Alarousu E.; Yengel E.; Alshankiti B. A.; Bakr O. M.; Mohammed O. F. Zero-dimensional Cs4PbBr6 perovskite nanocrystals. J. Phys. Chem. Lett. 2017, 8, 961–965. 10.1021/acs.jpclett.7b00105. [DOI] [PubMed] [Google Scholar]
- Soma Y. Infrared spectra of ethylene adsorbed on transition metals at low temperatures and hydrogenation of the adsorbed species. J. Catal. 1979, 59, 239–247. 10.1016/s0021-9517(79)80028-7. [DOI] [Google Scholar]
- Thonstad J.; Feller P.; Haarberg G. M.; Hiveš J.; Kvande H.; Sterten Å.. Aluminium Electrolysis. Fundamentals of the Hall–Héroult Process, 3rd ed.; Aluminium-Verlag: Dusseldorf, 2001. [Google Scholar]
- Nakamoto K.Infrared and Raman Spectra of Inorganic and Coordination Compounds, Part A, 5th ed.; Wiley-Interscience: New York, 1997. [Google Scholar]
- Parker S. F.; Bruce Forsyth J. K2MCl6: (M = Pt, Ir) Location of the silent modes and forcefields. J. Chem. Soc., Faraday Trans. 1998, 94, 1111–1114. 10.1039/a709215f. [DOI] [Google Scholar]
- Mitchell P. C. H.; Parker S. F.; Ramirez-Cuesta A. J.; Tomkinson J.. Vibrational Spectroscopy with Neutrons, with Applications in Chemistry, Biology, Materials Science and Catalysis; World Scientific: Singapore, 2005. [Google Scholar]
- Grundy H. D.; Brown I. D. A refinement of the crystal structures of K2[ReCl6], K2[ReBr6] and K2[PtBr6]. Can. J. Chem. 1970, 48, 1151–1154. 10.1139/v70-189. [DOI] [Google Scholar]
- Sears V. F. Neutron scattering lengths and cross sections. Neutron News 1992, 3, 26–37. 10.1080/10448639208218770. [DOI] [Google Scholar]
- Pinna R. S.; Zanetti M.; Rudić S.; Parker S. F.; Armstrong J.; Waller S. P.; Zacek D.; Smith C.; Harrison S. M.; Gorini G.; Fernandez-Alonso F. The TOSCA spectrometer at ISIS: the guide upgrade and beyond. J. Phys.: Conf. Ser. 2018, 1021, 012029. 10.1088/1742-6596/1021/1/012029. [DOI] [Google Scholar]
- https://neutrons.ornl.gov/vision (accessed on Dec 2, 2021).
- Adams M. A.; Parker S. F.; Fernandez-Alonso F.; Cutler D. J.; Hodges C.; King A. Simultaneous neutron scattering and Raman scattering. Appl. Spectrosc. 2009, 63, 727–732. 10.1366/000370209788701107. [DOI] [PubMed] [Google Scholar]
- Parker S. F.; Tomkinson J. Vibrational spectroscopy on TFXA. Neutron News 1998, 9, 33–39. 10.1080/10448639808232010. [DOI] [Google Scholar]
- Clark S. J.; Segall M. D.; Pickard C. J.; Hasnip P. J.; Probert M. I. J.; Refson K.; Payne M. C. First principles methods using CASTEP. Z. Kristallogr. 2005, 220, 567–570. 10.1524/zkri.220.5.567.65075. [DOI] [Google Scholar]
- Perdew J. P.; Burke K.; Ernzerhof M. Generalized gradient approximation made simple. Phys. Rev. Lett. 1996, 77, 3865–3868. 10.1103/physrevlett.77.3865. [DOI] [PubMed] [Google Scholar]
- Tkatchenko A.; Scheffler M. Accurate molecular Van Der Waals interactions from ground-state electron density and free-atom reference data. Phys. Rev. Lett. 2009, 102, 073005. 10.1103/physrevlett.102.073005. [DOI] [PubMed] [Google Scholar]
- Milman V.; Perlov A.; Refson K.; Clark S. J.; Gavartin J.; Winkler B. Structural, electronic and vibrational properties of tetragonal zirconia under pressure: a density functional theory study. J. Phys.: Condens. Matter 2009, 21, 485404. 10.1088/0953-8984/21/48/485404. [DOI] [PubMed] [Google Scholar]
- Porezag D. V.; Pederson M. R. Infrared intensities and Raman-scattering activities within density-functional theory. Phys. Rev. B: Condens. Matter Mater. Phys. 1994, 50, 7830–7836. [DOI] [PubMed] [Google Scholar]
- Gonze X.; Charlier J.-C.; Allan D. C.; Teter M. P. Interatomic force constants from first principles: The case of α-quartz. Phys. Rev. B: Condens. Matter Mater. Phys. 1994, 50, 13035. 10.1103/physrevb.50.13035. [DOI] [PubMed] [Google Scholar]
- BIOVIA Materials Studio; BIOVIA—Dassault systèmes; (3ds.com), 2021.
- Ramirez-Cuesta A. J. aCLIMAX 4.0.1, The new version of the software for analyzing and interpreting INS spectra. Comput. Phys. Commun. 2004, 157, 226–238. 10.1016/s0010-4655(03)00520-4. [DOI] [Google Scholar]
- Meetsma A.; Karray M.; Jarraya K.. ICSD Private Communication, Collection Code 420429, 2009.
- Schäfer G. F. The crystal structures of Na2TiF6 and Na2SiF6. Pseudotrigonal polar phases in double hexafluorides of the type Me(I)2Me(IV)F6. Z. Kristallogr. 1986, 175, 269–276. 10.1524/zkri.1986.175.3-4.269. [DOI] [Google Scholar]
- Zalkin A.; Forrester J. D.; Templeton D. H. The crystal structure of sodium fluorosilicate. Acta Crystallogr. 1964, 17, 1408–1412. 10.1107/s0365110x64003516. [DOI] [Google Scholar]
- Zhang W.; Jing Q.; Fang Y.; Chen Z. Synthesis, structure, and properties of nonlinear optical crystal Na2SiF6. Z. Anorg. Allg. Chem. 2017, 643, 1739–1743. 10.1002/zaac.201700322. [DOI] [Google Scholar]
- Badachhape R. B.; Hunter G.; McCory L. D.; Margrave J. L. Infrared absorption spectra of inorganic solids. IV. Hexafluorosilicates. Raman spectra of aqueous SiF62-. Inorg. Chem. 1966, 5, 929–931. 10.1021/ic50039a045. [DOI] [Google Scholar]
- Göbel O. Rerefinement of K2[TiF6]. Acta Crystallogr. 2000, C56, 521–522. 10.1107/s0108270100002560. [DOI] [PubMed] [Google Scholar]
- Forrest I. W.; Lane A. P. Single-crystal polarized infrared and Raman spectra and normal-coordinate analysis of some group 4 complex hexafluorometalates. Inorg. Chem. 1976, 15, 265–269. 10.1021/ic50156a004. [DOI] [Google Scholar]
- Fitch A. N.; Cockcroft J. K. Low-temperature powder diffraction studies using synchrotron radiation. Phase Transitions 1992, 39, 161–170. 10.1080/01411599208203479. [DOI] [Google Scholar]
- Cockcroft J. K.Neutron-scattering studies of order-disorder transitions in hexafluoride salts ABF6. Thesis (D.Phil.), University of Oxford, 1985. [Google Scholar]
- Huber P.; Krummeck H.; Baller J.; Krüger J. K.; Knorr K.; Haussühl S. Phases and phase transitions of KPF6. Ferroelectrics 1997, 203, 211–219. 10.1080/00150199708012847. [DOI] [Google Scholar]
- Heyns A. M.; Pistorius C. W. F. T. Vibrational spectra and high-pressure polymorphism of KPF6. Spectrochim. Acta 1974, 30, 99–116. 10.1016/0584-8539(74)80215-1. [DOI] [Google Scholar]
- Parker S. F.; Ramirez-Cuesta A. J.; Daemen L. L. The structure and vibrational spectroscopy of cryolite, Na3AlF6. RSC Adv. 2020, 10, 25856–25863. 10.1039/d0ra04804f. [DOI] [PMC free article] [PubMed] [Google Scholar]
- Takazawa H.; Ohba S.; Saito Y.; Sano M. Electron-density distribution in crystals of K2[MCl6] (M = Re, Os, Pt) and K2[PtCl4] at 120 K. Acta Crystallogr. 1990, 46, 166–174. 10.1107/s0108768189012693. [DOI] [Google Scholar]
- Busey R. H.; Dearman H. H.; Bevan R. B. Jr. The heat capacity of potassium hexachlororhenate(IV) from 7 to 320 K. Anomalies near 12, 76, 103, and 111 K. entropy and free energy functions. Solubility and heat of solution of K2ReCl6. Entropy of the hexachlororhenate ion. J. Phys. Chem. 1962, 66, 82–89. 10.1021/j100807a017. [DOI] [Google Scholar]
- O’Leary G. P.; Wheeler R. G. Phase transitions and soft librational modes in cubic crystals. Phys. Rev. B: Solid State 1970, 1, 4409–4439. 10.1103/physrevb.1.4409. [DOI] [Google Scholar]
- Lynn J. W.; Patterson H. H.; Shirane G.; Wheeler R. G. Soft rotary mode and structural phase transitions in K2ReCl6. Solid State Commun. 1978, 27, 859–862. 10.1016/0038-1098(78)90192-8. [DOI] [Google Scholar]
- Minkiewicz V. J.; Shirane G.; Frazer B. C.; Wheeler R. G.; Dorain P. B. Neutron diffraction study of magnetic ordering in K2IrCl6, K2ReBr6, and K2ReCl6. J. Phys. Chem. Solids 1968, 29, 881–884. 10.1016/0022-3697(68)90222-9. [DOI] [Google Scholar]
- Adams D. M.; Gebbie H. A. Absorption spectra of some inorganic complex halides by far infra-red interferometry. Spectrochim. Acta 1963, 19, 925–930. 10.1016/0371-1951(63)80179-4. [DOI] [Google Scholar]
- Khan N.; Prishchenko D.; Skourski Y.; Mazurenko V. G.; Tsirlin A. A. Cubic symmetry and magnetic frustration on the fcc spin lattice in K2IrCl6. Phys. Rev. B 2019, 99, 144425. 10.1103/physrevb.99.144425. [DOI] [Google Scholar]
- Hendra P. J.; Park P. J. D. The Raman and far infra-red spectra of some octahedral transition metal anions in the crystalline phase. Spectrochim. Acta, Part A 1967, 23, 1635–1640. 10.1016/0584-8539(67)80046-1. [DOI] [Google Scholar]
- Bosworth Y. M.; Clark R. J. H. Intensity studies on the Raman-active fundamentals of hexahalogenoanions of second- and third-row transition and non-transition metals. The calculation of parallel and perpendicular bond polarisability derivatives. J. Chem. Soc., Dalton Trans. 1974, 1749–1761. 10.1039/dt9740001749. [DOI] [Google Scholar]
- Debeau M.; Krauzman M. Spectres de vibration de complexes métalliques hexahalogénés cristallisés. C. R. Seances Acad. Sci., Ser. B 1967, 264, 1724–1727. [Google Scholar]
- Armstrong R. L.; Morra R. M.; Powell B. M. Neutron-diffraction study of the structural phase transitions in the antifluorite K2PtBr6. Can. J. Phys. 1985, 63, 988–996. 10.1139/p85-162. [DOI] [Google Scholar]
- Hamaguchi H.-O.; Harada I.; Shimanouchi T. Resonance Raman effect of octahedral complex ions, PtBr62- and PtI62-. J. Raman Spectrosc. 1974, 2, 517–528. 10.1002/jrs.1250020507. [DOI] [Google Scholar]
- Baechle W.; Rotter H. W.; Thiele G.; Clark R. J. H. Raman and resonance Raman spectroscopy of iodoplatinate(II), iodoplatinate(IV) and mixed-valence iodoplatinate(II,IV) salts. Inorg. Chim. Acta 1992, 191, 121–129. 10.1016/s0020-1693(00)80338-2. [DOI] [Google Scholar]
- Yokoyama T.; Yonamoto Y.; Ohta T.; Ugawa A. Anharmonic interatomic potentials of octahedral Pt-halogen complexes studied by extended X-ray-absorption fine structure. Phys. Rev. B: Condens. Matter Mater. Phys. 1996, 54, 6921–6928. 10.1103/physrevb.54.6921. [DOI] [PubMed] [Google Scholar]
- Thiele G.; Mrozek C.; Kämmerer D.; Wittmann K. Über Hexaiodoplatinate(IV) M2PtI6 (M = K, Rb, Cs, NH4, Tl) - Darstellungsverfahren, Eigenschaften und Kristallstrukturen. Z. Naturforsch. 1983, 38, 905–910. 10.1515/znb-1983-0802. [DOI] [Google Scholar]
- Eysel H. H. Hexamminmetall(lll)-hexachlorochromate(lll): Darstellung, Kristallgitter und Spektren. Z. Anorg. Allg. Chem. 1972, 390, 210–216. 10.1002/zaac.19723900209. [DOI] [Google Scholar]
- Sassmannshausen M.; Lutz H. D. Cesium chromium halides Cs3CrCl6, Cs3Cr2Cl9, and Cs3CrBr6 - Preparation, properties, crystal structure. Z. Anorg. Allg. Chem. 2001, 627, 1071–1076. . [DOI] [Google Scholar]
- Claassen H. H.; Goodman G. L.; Holloway J. H.; Selig H. Raman spectra of MoF6, TcF6, ReF6, UF6, SF6, SeF6, and TeF6 in the vapor state. J. Chem. Phys. 1970, 53, 341–348. 10.1063/1.1673786. [DOI] [Google Scholar]
- Bosworth Y. M.; Clark R. J. H.; Rippon D. M. The vapor phase Raman spectra, Raman band contour analyses, and Coriolis constants of the spherical top molecules MF6 (M = S, Se, Te, Mo, W, or U), M(CH3)4, (M = C, Si, Ge, Sn, or Pb), P4, As4 and OsO4. J. Mol. Spectrosc. 1973, 46, 240–255. 10.1016/0022-2852(73)90040-4. [DOI] [Google Scholar]
- McDowell R. S.; Sherman R. J.; Asprey L. B.; Kennedy R. C. Vibrational spectrum and force field of molybdenum hexafluoride. J. Chem. Phys. 1975, 62, 3974–3978. 10.1063/1.430320. [DOI] [Google Scholar]
- McDowell R. S.; Asprey L. B. Coriolis constants of spherical-top molecules from low-temperature infrared studies of vapor band contours. Application to the force field of tungsten hexafluoride. J. Mol. Spectrosc. 1973, 48, 254–265. 10.1016/0022-2852(73)90190-2. [DOI] [Google Scholar]
- Bernstein E. R.; Meredith G. R. Vibrational spectra of transition metal hexafluoride crystals. III. Exciton band structures of MoF6, WF6 and UF6. Chem. Phys. 1977, 24, 311–325. 10.1016/0301-0104(77)85091-x. [DOI] [Google Scholar]
- Hellberg K. H.; Müller A.; Glemser O. Das Infrarotspektrum von festem CrF6, MoF6 und OsF6 bei tiefen Temperaturen. Z. Naturforsch. 1966, 21, 118–121. 10.1515/znb-1966-0205. [DOI] [Google Scholar]
- Yost D. M.; Steffens C. C.; Gross S. T. The Raman spectra and molecular constants of the hexafluorides of sulfur, selenium and tellurium. J. Chem. Phys. 1934, 2, 311–316. 10.1063/1.1749479. [DOI] [Google Scholar]
- Labonville P.; Ferraro J. R.; Wall M. C.; Mc S.; Basile L. J. A study of force fields for octahedral hexahalogen molecules. Coord. Chem. Rev. 1972, 7, 257–287. 10.1016/s0010-8545(00)80023-5. [DOI] [Google Scholar]
- Krynauw G. N. The estimation of ν6 of octahedral XY6 species. Spectrochim. Acta, Part A 1990, 46, 741–745. 10.1016/0584-8539(90)80030-3. [DOI] [Google Scholar]
Associated Data
This section collects any data citations, data availability statements, or supplementary materials included in this article.