

Abstract
Background and aim
Rapid antigen detection (RAD) tests on nasopharyngeal specimens have been recently made available for SARS-CoV-2 infections, and early studies suggested their potential utilization as rapid screening and diagnostic testing. The present systematic review and meta-analysis was aimed to assess available evidence and to explore the reliability of antigenic tests in the management of the SARS-CoV-2 pandemic.
Materials and Methods
We reported our meta-analysis according to the PRISMA statement. We searched Pubmed, Embase, and pre-print archive medRxiv.og for eligible studies published up to November 5th, 2020. Raw data included true/false positive and negative tests, and the total number of tests. Sensitivity and specificity data were calculated for every study, and then pooled in a random-effects model. Heterogeneity was assessed using the I2 measure. Reporting bias was assessed by means of funnel plots and regression analysis.
Results
Based on 25 studies, we computed a pooled sensitivity of 72.8% (95%CI 62.4–81.3), a specificity of 99.4% (95%CI 99.0–99.7), with high heterogeneity and risk of reporting bias. More precisely, RAD tests exhibited higher sensitivity on samples with high viral load (i.e. <25 Cycle Threshold; 97.6%; 95%CI 94.1–99.0), compared to those with low viral load (≥25 Cycle Threshold; 43.6%; 95% 27.6-61.1).
Discussion
As the majority of collected reports were either cohort or case-control studies, deprived of preventive power analysis and often oversampling positive tests, overall performances may have been overestimated. Therefore, the massive referral to antigenic tests in place of RT-qPCR is currently questionable, and also their deployment as mass screening test may lead to intolerable share of missing diagnoses. On the other hand, RAD tests may find a significant role in primary care and in front-line settings (e.g. Emergency Departments). (www.actabiomedica.it)
Keywords: COVID-19, SARS-CoV-2, point-of-care diagnostics, rapid testing, real-world data, systematic review and meta-analysis
Introduction
The “Severe Acute Respiratory Syndrome coronavirus type 2” (SARS-CoV-2) is an enveloped, single-stranded, positive-sense RNA beta-coronavirus that was discovered in late December 2019. By November 2020, it caused a global pandemic with over 53 million confirmed cases, and almost 1.2 million deaths worldwide (https://covid19.who.int): the managing of the clinical syndrome elicited by SARS-CoV-2 infection (coronavirus disease 19 or COVID-19) has rapidly become a main stressor for all healthcare systems around the world (1–3).
Timely and accurate SARS-CoV-2 laboratory testing is an essential step in the management of the pandemic [4–8]. To date, both the “European Centre for Disease Prevention and Control” (ECDC) and the “World Health Organization” (WHO) have recommended the use of an assay based on the reverse-transcription polymerase chain reaction (RT-qPCR) in respiratory samples as gold standard for the COVID-19 diagnosis (4,5,7,9,10). Unfortunately, RT-qPCR is usually based on specimens collected through the use of nasopharyngeal swabs, which is affected by several practical limitations. First at all, it is a relatively invasive sampling technique, that requires specialized operators, and may elicit cough and bleeding, with an increasing risk of healthcare workers infection (11). Moreover, RT-qPCR is a time- and reagent-consuming procedure, needing specialized lab operators and certified laboratories; such requirements have limited the testing capacity of laboratories to provide results in a timely manner (10). Such limitations have elicited interest in alternative methodologies, including rapid antigen detection (RAD) tests. RAD tests, including immunochromatographic tests (ICT), chemiluminescence enzyme assays (CIA), and fluorescent immunoassays (FIA), detect viral antigen by the immobilized coated SARS-CoV-2 antibody on the device. By design, results of RAD tests are generally available within 30 minutes, and can be usually interpreted without specialized instruments. Therefore, appropriate use of RAD tests can relieve the workload in diagnostic hospitals and laboratories, ultimately improving the turnaround time. However, according to WHO, RAD tests for SARS-CoV-2 detection still need to be evaluated in the clinical practice, and they are not extensively recommended for clinical diagnosis (12).
Despite several stakeholders are urging for their diffuse deployment, performance characteristics of rapid tests for SARS-CoV-2 remain largely uncertain (12,13). As some RAD have been licensed in both EU and USA for emergency use, early results are surfacing (14), being sometimes conflicting, suggesting the need for an updated synthesis of the literature to better inform health policies and guidelines. Reliance on modern diagnostic options made available by the scientific research should be supported by a synthesis of empirical evidence in which the heterogeneity of the different studies shows their efficacy. Therefore, the present systematic review and meta-analysis was undertaken to explore the deficiencies and contradictions found in the literature by analyzing the empirical evidence available (15), emphasizing the actual reliability of RAD tests for SARS-CoV-2 in the management of SARS-CoV-2 pandemic.
Materials and Methods
This systematic review and meta-analysis of the literature has been conducted following the “Preferred Reporting Items for Systematic Reviews and Meta-Analysis” (PRISMA) guidelines (15). We searched different scholarly databases (namely, PubMed/MEDLINE and EMBASE) as well as pre-print servers including medrxiv.org for relevant studies from inception up to November 5th, 2020, without applying any backward chronological restrictions. The search strategy was a combination of the following keywords (free text and Medical Subject Heading [MeSH] terms, where appropriate): antigen* AND (COVID-19 OR SARS-CoV-2 OR Coronavirus) AND (diagnostic OR diagnostic test OR screening).
Records were handled using references management software (Mendeley Desktop Version 1.19.5, Mendeley Ltd, London, UK, 2019), and duplicates were removed. Articles eligible for review were original research publications available online or through inter-library loan. A language filter was applied, by retaining articles written in Italian, English, German, French or Spanish, the languages spoken by the investigators.
Only articles (a) dealing with COVID-19 cases diagnosed by means of conventional RT-qPCR tests on nasopharyngeal swabs (5); (b) based on commercially available tests; and (c) reporting the raw number of true positive/true negative, and false positive/false negative results were eligible for the full review. Two independent reviewers (M.V. and S.R.) reviewed titles, abstracts, and the full text of articles. Titles were screened for relevance with respect to the subject under study.
Any article reporting original results, which met one or more of the inclusion criteria, was retained for the full-text review. The investigators independently read full-text versions of eligible articles. Disagreements were resolved by consensus between the two reviewers; when it was not possible to reach consensus, input from a third investigator (M.R.) was searched and obtained. Further studies were retrieved from reference lists of relevant articles and consultations with experts in the field. Data extracted included:
Settings of the study;
Characteristics of reference cases;
Characteristics of the commercially available point-of-care test employed (i.e. manufacturer; diagnostic kit; sampling technique; being a FIA, ICT or CIA test).
Total number of true positive, true negative, false positive, false negative cases.
We first performed a descriptive analysis to report the characteristics of the included studies. Each study was assessed by means of sensitivity (Se), specificity (Sp), positive and negative likelihood ratio (PLR and NLR), diagnostic odds ratio (DOR), accuracy and Cohen’s “kappa”. Sensitivity can be defined as the proportion of positive cases among people with a given disease, and specificity as the proportion of negative cases among people without that disease.
The likelihood ratios express the likelihood that a given test result would be expected in a patient with a certain disorder compared to the likelihood of that same result among subjects without that disorder; PLR was calculated by dividing the pooled Se by (1 – Sp); NLR was calculated by dividing (1 – Se) by Sp. The DOR expresses how much greater the odds of having the disorder are for the people with a positive test result than for the people with a negative test result. It is a single measure of diagnostic test performance that combines both likelihood ratios by dividing PLR by NLR. The accuracy of any test is measured by comparing the results from a diagnostic test (positive or negative) with the true disease using a gold standard (presence or absence). Cohen’s kappa coefficient is a statistical measure that is used to quantitatively assess inter-rater reliability (and also intra-rater reliability) for qualitative (i.e., categorical) items. In other words, it measures the agreement between two raters who each classify N items into C mutually exclusive categories. Cohen’s kappa values < 0.600 suggest “weak” to “none” agreement, while values 0.600 to 0.799 suggest a “moderate” agreement, 0.800 to 0.900 a “strong” agreement, and >0.900 an “almost perfect” agreement.
Pooled Se, Sp, PLR, NLR, accuracy, Cohen’s kappa and DOR were calculated by combining each study’s results, by means of a random-effects model. For DOR, a correction factor of one half was added to each cell to avoid calculation problems by having a value of zero in the 2 × 2 table.
Potential heterogeneity for threshold effect (i.e., differences in Se and Sp occurring because of different cut-offs used in different diagnostic kits) was assessed by reporting accuracy estimates from each study in a summary receiver operating characteristic (sROC) space and subsequent visual inspection of the resulting curves: i.e., a substantial difference in curves suggested a possible heterogeneity for threshold effect, while the overlap of curves was reported as a sign of its absence (16).
I2 statistics were then calculated to quantify the amount of inconsistency between included studies; it estimates the percentage of total variation across studies that is due to heterogeneity rather than to chance. I2 values ranging from 0% to 25% were considered to represent low heterogeneity, from 26% to 50% moderate heterogeneity and above 50% substantial heterogeneity, being pooled using a fixed-effects model because of the reduced number of samples eventually included.
To investigate publication bias, contour-enhanced funnel plots were initially generated: publication bias was evaluated by testing the null hypothesis that publication bias does not exist by means of the regression test for funnel plot asymmetry. The null hypothesis was rejected if the p-value was less than 0.10.
All calculations were performed in R (version 3.6.1; R Core Team, 2017. R: A language and environment for statistical computing. R Foundation for Statistical Computing, Vienna, Austria. URL https://www.R-project.org/) and RStudio (version 1.2.5019, RStudio PBC, 250 Northern Ave,
Boston, MA, USA) software by means of meta (version 4.9-9), mada (version 0.5-9), and nsROC (version 1.1) packages. All packages are open-source add-ons for conducting meta-analyses.
Results
The initial literature search yielded a pool of 3749 entries. After removing duplicates (n = 371), 3372 articles were evaluated by title and abstract. After title screening, 3334 articles were removed, and 38 were subsequently screened by abstract. Eight articles were excluded based on abstract screening and, finally, 30 articles were assessed for eligibility, reviewed by full-text. As one article was performed on salivary fluids, while two further reports dealt on respiratory sample, and two more articles lacked raw number of reported cases, that were otherwise not reverse-calculable, those 5 articles were ultimately excluded. Twenty-five studies were therefore eventually retrieved (14,17–33). As three studies reported data on multiple diagnostic kits (23,27,33), the present systematic review and meta-analysis included a total of 29 estimates. The process of studies retrieval and inclusion is pictorially shown in Figure 1.
Figure 1.

The process of studies retrieval and inclusion adopted in the present systematic review and meta-analysis. A total of 25 studies with 29 estimates were retrieved.
The main characteristics of the studies included in the present systematic review and meta-analysis are reported in Table 1. Briefly, 13 of the included reports were preprints (17,20,22–25,27,29,32–37), while remaining 12 studies had received a full peer-review process (14,18,19,21,26,28,30,31,38–41).
Table 1.
Summary of studies included in the meta-analysis
| Reference | Commercial test | Characteristics of the study | No. Of samples | TP | FP | FN | TN | Se. | Sp. | PPV | PNV | Accuracy | Cohen’s Kappa | |
|---|---|---|---|---|---|---|---|---|---|---|---|---|---|---|
| 1) Albert at al. (22) | Abbot Diagnostics Panbio COVID-19 Ag Rapid Test device |
ICT | Prospective study, 412 patients (327 adults; 85 pediatrics) with clinical suspicion of COVID-19 in a primary care centre. | 412 | 43 | 0 | 11 | 358 | 79.6% | 100% | 100% | 97.0% | 97.3% | 0.872 |
| 2) Alemany et al. (35) | Abbot Diagnostics Panbio COVID-19 Ag Rapid Test device |
ICT | Retrospective study including a total of 1406 frozen samples (swabs) with a RT-qPCR result available (951 positive and 455 negative studies). | 1406 | 872 | 5 | 79 | 450 | 91.7% | 98.9% | 99.4% | 85.1% | 94.0% | 0.896 |
| 3) Blairon et al. (40) | Coris Bioconcept COVID-19 Ag Respi-Strip |
ICT | Prospective study including a total of 774 either COVID-19 positive or negative cases from an original sample of 912. | 774 | 60 | 0 | 159 | 555 | 27.4% | 100% | 100% | 77.7% | 79.5% | 0.351 |
| 4) Cerutti et al. (21) | SD Biosensor STANDARD F COVID-19 Ag FIA |
FIA | Prospective study including 330 patients: 185 randomly selected patients from the Emergency Department of Turin and Genoa, and 145 travelers returning from high risk countries | 330 | 77 | 0 | 32 | 221 | 70.6% | 100% | 100% | 87.4% | 90.3% | 0.591 |
| 5) Courtellement et al. (36) | AAZ COVID-VIRO | ICT | Prospective study including 226 subjects voluntarily accessing to the COVID-19 Screening department and SARS-CoV-2 positive patients from two specialized hospitals in Paris and Orleans | 226 | 113 | 0 | 4 | 109 | 96.6% | 100% | 100% | 96.5% | 98.2% | 0.965 |
| 6) Fenollar et al. (41) | Abbot Diagnostics Panbio COVID-19 Ag Rapid Test device |
ICT | Prospective study including a total of 341 consecutive patients from a COVID-19 testing Center in Marseilles | 341 | 154 | 7 | 50 | 130 | 75.5% | 94.9% | 95.7% | 72.2% | 83.3% | 0.669 |
| 7) Gremmels et al. (23) | Abbot Diagnostics Panbio COVID-19 Ag Rapid Test device |
ICT | Prospective study including all individuals (No. 1367; 139 Positive cases) visiting COVID-19 community testing centers, located at the University Medical Center Utrecht (UMCU), | 1367 | 101 | 0 | 38 | 1228 | 72.7% | 100% | 100% | 97.0% | 97.2% | 0.827 |
| Prospective study including all individuals (No. 208, 63 positive cases) visiting COVID-19 community testing centers, located at the Horacio Oduber Hospital, Aruba | 208 | 51 | 0 | 12 | 145 | 81.0% | 100% | 100% | 92.4% | 94.2% | 0.856 | |||
| 8) Gupta et al. (38) | SD Biosensor STANDARD Q COVID-19 Ag FIA |
ICT | Prospective study; single-blinded, cross sectional, single-center study including all consecutive patients either symptomatic for COVID-19 or asymptomatic / presymptomatic contacts of laboratory confirmed COVID-19 cases | 330 | 63 | 1 | 15 | 252 | 81.8% | 99.6% | 98.4% | 94.7% | 95.5% | 0.865 |
| 9) Herrera et al. (17) | Quidel Corporation SOFIA SARS ANTIGEN FIA |
FIA | Prospective study on all patients (No. 1172) presenting with COVID19 symptoms | 1172 | 352 | 6 | 107 | 707 | 76.7% | 99.2% | 98.3% | 86.9% | 90.4% | 0.789 |
| 10) Hirotsu et al. (26) | Fuji Rebio inc Espline |
CIA | Retrospective study on 313 samples from inpatients of a medical center | 313 | 32 | 1 | 26 | 254 | 55.2% | 99.6% | 97.0% | 90.7% | 91.4% | 0.657 |
| 11) Krüger et al. (27) | Bioeasy Biotechnology Co. Bioeasy 2019-Novel Coronavirus (2019-nCoV) Fluorescence Antigen Rapid Test Kit |
FIA | Prospective study on 3160 participants with presumed SARS-CoV-2 infection. Subset of 727 randomly selected samples (No. 47 positive cases) | 727 | 10 | 5 | 49 | 663 | 16.9% | 99.3% | 66.7% | 93.1% | 92.6% | 0.245 |
| Coris Bioconcept COVID-19 Ag Respi-Strip |
ICT | Prospective study on 3160 participants with presumed SARS-CoV-2 infection. Subset of 417 randomly selected samples (No. 8 positive cases) | 417 | 4 | 4 | 17 | 392 | 19.0% | 99.0% | 50.0% | 95.8% | 95.0% | 0.255 | |
| SD Biosensor STANDARD F COVID-19 Ag FIA |
FIA | Prospective study on 3160 participants with presumed SARS-CoV-2 infection. Subset of 1263 randomly selected patients. | 1263 | 36 | 11 | 9 | 1207 | 80.0% | 99.1% | 76.6% | 99.3% | 98.4% | 0.774 | |
| 12) Lambert-Niclot et al. (28) | Coris Bioconcept COVID-19 Ag Respi-Strip |
ICT | Retrospective study, random sample (No. 138) from patients admitted to the parent hospital during April, 2020 | 138 | 47 | 0 | 47 | 44 | 50.0% | 100% | 100% | 48.4% | 65.9% | 0.389 |
| 13) Linares et al. [29] | Abbot Diagnostics Panbio COVID-19 Ag Rapid Test device |
ICT | Prospective study on 135 symptomatic patients, 17 asymptomatic patients from ED; 50 symptomatic patients, 55 asymptomatic patients from primary healthcare centers. | 316 | 68 | 0 | 16 | 232 | 81.0% | 100% | 100% | 93.6% | 94.9% | 0.862 |
| 14) Lindner et al. (25) | SD Biosensor STANDARD F COVID-19 Ag FIA |
FIA | Prospective study on 289 adults at high risk for SARS-CoV- 2 infection according to clinical suspicion, 39 of them positive for SARS-COV-2 | 289 | 29 | 2 | 10 | 248 | 74.4% | 99.2% | 93.6% | 96.1% | 95.8% | 0.805 |
| 15) Liotti et al. (30) | SD Biosensor STANDARD F COVID-19 Ag FIA |
FIA | Retrospective study on 359 samples previously sampled and tested | 359 | 49 | 4 | 55 | 251 | 47.1% | 98.4% | 92.5% | 82.0% | 83.6% | 0.533 |
| 16) Mertens et al. (31) | Coris Bioconcept COVID-19 Ag Respi-Strip |
ICT | Retrospective study on specimens from 328 suspected cases | 328 | 76 | 1 | 56 | 195 | 57.6% | 99.5% | 98.7% | 77.7% | 82.6% | 0.612 |
| 17) Nalumansi et al. (39) | SD Biosensor STANDARD F COVID-19 Ag FIA |
FIA | Prospective, cross-section, un-blinded study including 90 COVID-19 cases and 172 controls from regional referral hospitals in Uganda | 267 | 68 | 13 | 27 | 159 | 71.6% | 92.4% | 84.0% | 85.5% | 85.0% | 0.662 |
| 18) Pekosz et al. (32) | BD Life Sciences Veritor Plus System |
ICT | Retrospective study on 38 RT-PCR positive samples and 176 RT-PCR negative samples from a total of 251 samples | 251 | 27 | 3 | 1 | 220 | 96.4% | 98.7% | 90.0% | 99.6% | 98.4% | 0.922 |
| 19) Pilarowski et al. (37) | Abbot Diagnostics BinaxNow COVID-19 Ag Rapid Test device |
ICT | Prospective study including a total 878 volunteers (either symptomatic or not) who presented at a public testing site at community level; 214 randomly selected samples. | 214 | 5 | 9 | 2 | 198 | 71.4% | 95.7% | 35.7% | 99.0% | 94.9% | 0.452 |
| 20) Porte et al. (18) | Bioeasy Biotechnology Co. Bioeasy 2019-Novel Coronavirus (2019-nCoV) Fluorescence Antigen Rapid Test Kit |
FIA | Retrospective study including a total of 127 samples (randomly selected) from a total of 1453 respiratory samples | 127 | 77 | 0 | 5 | 45 | 93.9% | 100% | 100% | 90.0% | 96.1% | 0.916 |
| 21) Porte et al. (33) | SD Biosensor STANDARD F COVID-19 Ag FIA |
FIA | Retrospective study on 32 RT-PCR positive samples and 32 RT-PCR negative samples, randomly selected from an undisclosed number of clinical specimens | 64 | 29 | 1 | 3 | 31 | 90.6% | 96.9% | 96.7% | 91.2% | 93.8% | 0.875 |
| Quidel Corporation SOFIA SARS ANTIGEN FIA |
FIA | 64 | 30 | 1 | 2 | 31 | 93.8% | 96.9% | 96.8% | 93.9% | 95.3% | 0.906 | ||
| 22) Scohy et al. (14) | Coris Bioconcept COVID-19 Ag Respi-Strip |
ICT | Prospective random sample (No. 148) from all patients admitted to the parent hospital during April, 2020 | 148 | 32 | 0 | 74 | 42 | 30.2% | 100% | 100% | 36.2% | 50.0% | 0.197 |
| 23) Van der Moeren et al. (24) | BD Life Sciences Veritor Plus System |
ICT | Prospective study including a total of 354 adults individuals (age ≥ 18 years) presenting at the Breda test centre | 351 | 16 | 2 | 1 | 332 | 94.1% | 99.4% | 88.9% | 99.7% | 99.1% | 0.910 |
| 24) Veyrenche et al. (20) | Coris Bioconcept Veritor Plus System |
ICT | Retrospective study on 45 patients with RT-PCR confirmed COVID-19 and 20 negative controls | 65 | 13 | 0 | 32 | 20 | 28.9% | 100% | 100% | 38.5% | 50.8% | 0.200 |
| 25) Young et al. (19) | BD Life Sciences Veritor Plus System |
ICT | Prospective study including 251 specimens from 260 participants from various geographic areas | 251 | 29 | 1 | 9 | 212 | 76.3% | 99.5% | 96.7% | 95.9% | 96.0% | 0.830 |
(Note: CIA = chemiluminiscence enzyme assay; FIA = fluorescence immunoassay; ICT = immunochromatographic tests; TP = No. of True Positive Cases; FP = No. of False Positive Cases; FN = No. of False Negative Cases; TP = No. of True Positive Cases; Se. = sensitivity; Sp. = specificity; PPV = predicted positive value; PNV = predicted negative value; Cohen’s Kappa values should be interpreted as follows: 0.0–0.20 no agreement, 0.21–0.39 minimal agreement, 0.40–0.59 weak agreement, 0.60–0.79 moderate agreement, 0.80–0.90 strong agreement, >0.90 almost perfect agreement).
Overall, our meta-analysis included a total of 12518 samples: the size of every single estimate ranged from 64 to 1406, and only 3 studies had performed a preventive power analysis (27,35,36). Of the retrieved samples, 3510 were SARS-CoV-2 positive as confirmed by RT-qPCR (28.0%), with a positive rate ranging between 1.9% and 60.6%.
The retrieved estimates reported on a total of 9 different commercially available tests (1 of them was commercialized with two different brand names in North America and Western Europe), all of them targeting the nucleocapsid (N) protein [42], with 18 estimates on ICT (60.3% of the pooled sample) (14,19,20,22–24,27–29,31,32,35,36,38,40,41), 10 on FIA (37.2%) (17,18,21,25,27,30,33,39), while only one report dealt on CIA (2.5%) (26).
A summary of the diagnostic performances of the RAD tests that were included in this systematic review is reported in Table 2.
Table 2.
Summary of the diagnostic performances of the RAD tests included in the systematic review (note: DOR = diagnostic odds ratio; 95%CI = 95% confidence intervals; NLR = negative likelihood ratio; PLR = positive likelihood ratio; Se = sensitivity; Sp = specificity; Ct = cycle threshold)
| Variable | Estimate | 95%CI | Tau2 | P value | Q(df) | I2 |
|---|---|---|---|---|---|---|
| Se | 72.8 | 62.4; 81.3 | 1.582 | < 0.001 | 831.62 (28) | 96.5 |
| < 25 Ct | 97.6 | 94.1; 99.0 | 1.953 | < 0.001 | 102.07 (16) | 80.0 |
| ≥ 25 Ct | 43.6 | 27.6; 61.1 | 1.934 | < 0.001 | 306.61 (16) | 94.8 |
| Sp | 99.4 | 99.0; 99.7 | 1.614 | < 0.001 | 121.87 (28) | 81.0 |
| Kappa | 0.684 | 0.635; 0.733 | 0.018 | < 0.001 | 809931.373 (28) | 99.9 |
| Accuracy | 0.890 | 0.873; 0.907 | 0.002 | < 0.001 | 100310.901 (28) | 99.9 |
| DOR | 288.394 | 153.206; 542.870 | 1.941 | < 0.001 | 118.145 (28) | 76.3 |
| NLR | 0.230 | 0.169; 0.315 | 0.190 | 0.051 | 41.283 (28) | 32.2 |
| PLR | 61.687 | 38.586; 98.620 | 0.899 | < 0.001 | 90.910 (28) | 69.2 |
More precisely, the specificity of reported studies ranged between 94.9% to 100%, with a pooled estimate of 99.4% (95%CI 99.0–99.7). As shown in Figure 2, ICT tests exhibited a pooled specificity of 99.7% (95%CI 99.1 – 99.9), that was slightly but significantly greater than that reported for FIA i.e. (98.9% 95%CI 97.7 – 99.4; chi squared test p value 0.006). The only CIA based study we were able to retrieve scored a specificity of 99.6% (95%CI 97.8-100). The heterogeneity was substantial (I2 81.0%, p < 0.001), for both ICT (I2 83%) and FIA based studies (I2 74%).
Figure 2.

Forest plot representing the estimated specificity of SARS-CoV-2 antigen-based studies. Pooled specificity was 99.4% (95%CI 99.0–99.7), with considerable heterogeneity (I2 81%), and a significant difference between FIA (98.9%, 95%CI 97.7 – 99.4) and ICT based estimates (99.7%, 95%CI 99.1 – 99.9; chi squared test p value < 0.001). Note: A = Coris Bioconcept - COVID-19 Ag Respi-Strip; B = SD Biosensor - STANDARD F COVID-19 Ag FIA; C = Bioeasy Biotechnology Co. - Bioeasy 2019-Novel Coronavirus (2019-nCoV) Fluorescence Antigen Rapid Test Kit; D = BD Life Sciences – Veritor Plus System; E = Fujirebio Inc – Lumipulse G; F = Quidel Corporation – SOFIA SARS ANTIGEN FIA; G = Abbot Diagnostics - Panbio COVID-19 Ag Rapid Test device; H = Abbot Diagnostics - BinaxNow COVID-19 Ag Card; I = AAZ – COVID-Viro; L = SD Biosensor - STANDARD Q COVID-19 Ag.
As shown in Figure 3, the value of sensitivity ranged from 16.9% to 96.4%, with a pooled sensitivity of 72.8% (95%CI 62.4–81.3), that was not significantly greater in FIA (75.3%; 95%CI 58.4-86.9) than in ICT based studies (72.3%; 95%CI 58.0-83.2; p = 0.150), while the study on CIA scored a sensitivity of 55.2% (95%CI 41.5-68.3%). As observed for specificity, heterogeneity was substantial (I2 96%), for both ICT (I2 97%) and FIA based studies (I2 96%).
Figure 3.

Forest plot representing the estimated sensitivity of SARS-CoV-2 antigen-based studies. Pooled sensitivity was 72.8% (95%CI 62.4–81.3), being not significantly greater in FIA based studies (i.e. 75.3%, 95%CI 58.4-86.9) than in ICT based studies (72.3%; 95%CI 58.6-83.2). Heterogeneity was substantial (I2, 97%), for both groups (i.e. I2, 95% in ICT studies, I2 = 96% in FIA studies). Note: A = Coris Bioconcept - COVID-19 Ag Respi-Strip; B = SD Biosensor - STANDARD F COVID-19 Ag FIA; C = Bioeasy Biotechnology Co. - Bioeasy 2019-Novel Coronavirus (2019-nCoV) Fluorescence Antigen Rapid Test Kit; D = BD Life Sciences – Veritor Plus System; E = Fujirebio Inc – Lumipulse G; F = Quidel Corporation – SOFIA SARS ANTIGEN FIA; G = Abbot Diagnostics - Panbio COVID-19 Ag Rapid Test device; H = Abbot Diagnostics - BinaxNow COVID-19 Ag Card; I = AAZ – COVID-Viro; L = SD Biosensor - STANDARD Q COVID-19 Ag.
Assuming a cut-off value of 25 cycle threshold (Ct; i.e. 1.8 x 10^5 viral copies/mL), and dichotomizing samples in those characterized by high (i.e. Ct < 25) and low (i.e. Ct ≥ 25) viral load, a pooled sensitivity of 97.6% (95%CI 94.1–99.0), and 43.6% (95% 27.6-61.1) was identified, respectively (Figure 4).
Figure 4.

Forest plot representing the estimated sensitivity of SARS-CoV-2 antigen-based studies by cycle threshold value, i.e. CT < 25 (left) vs. CT ≥ 25 (right). Pooled sensitivity was 97.6% (95%CI 94.1–99.0) for studies with higher viral load (CT < 25), compared to 43.6% (95% 27.6-61.1) in studies with lower viral load (CT ≥ 25). Heterogeneity was substantial, for both sub-analyses (i.e. I2 80% for samples with high viral load vs. I2 95% in samples with low viral load). Note: Note: A = Coris Bioconcept - COVID-19 Ag Respi-Strip; B = SD Biosensor - STANDARD F COVID-19 Ag FIA; C = Bioeasy Biotechnology Co. - Bioeasy 2019-Novel Coronavirus (2019-nCoV) Fluorescence Antigen Rapid Test Kit; D = BD Life Sciences – Veritor Plus System; F = Quidel Corporation – SOFIA SARS ANTIGEN FIA; G = Abbot Diagnostics - Panbio COVID-19 Ag Rapid Test device; L = SD Biosensor - STANDARD Q COVID-19 Ag.
In other words, RAD tests exhibited a considerably higher sensitivity in samples characterized by a higher viral load compared to samples with low viral load. Interestingly, performances of FIA and ICT tests were similar both with higher viral load (pooled sensitivity of 98.3%, 95%CI 95.0-99.5 vs. 96.6%, 95%CI 90.2-98.8, respectively p = 0.106), while for samples having a Ct ≥ 25 the pooled sensitivity of ICT tests (44.7%, 95% 22.8-68.9) significantly outperformed that of FIA tests (41.0%; 95%CI 21.0-64.5; p < 0.001). Residual heterogeneity was again substantial, for both sub-analyses (i.e. I2 89% for samples with high viral load vs. I2 77% in samples with low viral load).
Visual inspection of contour-enhanced funnel plots (Figure 5), suggested a seemingly considerable asymmetry for all analyses, with subsequent reporting bias. However, regression analysis confirmed a significant reporting bias for overall analysis of specificity (t = 3.504, df = 27, p-value = 0.002), while it was substantially dismissed for sensitivity (t = -0.0329, df = 27, p-value = 0.974).
Figure 5.

Funnel plots for Sensitivity (a), and Specificity (b) of studies included in the metanalysis. Visual inspection suggested a significant asymmetry for all analyses, with subsequent reporting bias. However, regression analysis dismissed a significant reporting bias for overall analysis of sensitivity (t = -0.0329, df = 27, p-value = 0.974), but not for specificity (t = 3.504, df = 27, p-value = 0.002).
Not coincidentally, corresponding radial plot for sensitivity was characterized by a seemingly random distribution of the studies across the regression line for sensitivity, while the radial plot for specificity was characterized by a non-random scattering of studies, suggesting a possible small-study effect on the overall estimates (Figure 6).
Figure 6.

Radial plots for Sensitivity (a), and Specificity (b) of studies included in the metanalysis. Visual inspection suggested the seemingly random distribution of included studies on both sides of the regression line for sensitivity, but not for specificity.
Effectiveness of the diagnostic tests was eventually summarized by calculation of PLR, NLR, DOR and Cohen’s Kappa values. Pooled PLR estimate was 61.687 (95%CI 38.586-98.620), with a correspondent NLR of 0.230 (95%CI 0.169-0.315), i.e., while a positive test was associated with relatively strong evidence of infection, a negative one was associated with a reduced chance of being actually affected by SARS-CoV-2 infection. Correspondent pooled DOR (i.e. 288.394; 95%CI 153.206-542.870) from the retrieved studies is shown in Figure 7. Eventually, the pooled accuracy was 0.890 (95%CI 0.873-0.907) while Cohen’s kappa was estimated in 0.684 (95%CI 0.629; 0.735). In other words, despite a substantial heterogeneity (I2 99.9% for both estimates), the agreement between RAD tests and RT-PCR may be assumed to be moderate.
Figure 7.

Forrest plot representing the pooled diagnostic odds ratio (DOR) of antigen-based tests for SARS-CoV-2. A substantial heterogeneity in reported studies was identified (I2 76.3%, Cochran’s Q: 118.145 (df=28, p < 0.001)).
In order to exclude that the differences in overall performance may have been associated with a different threshold level among studies, sROC of two distinctive models were determined, either using the overall DOR by combining each study’s diagnostic odds ratio (random-effects model, AUC = 0.844), or a fixed (unweighted) method (AUC = 0.867). The small but noticeable difference between the symmetric and asymmetric sROC curves indicates that a threshold effect is actually present (Figure 8).
Figure 8.
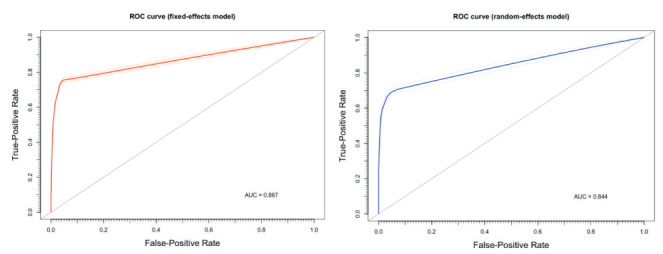
Summary Receiver Operated Characteristics (sROC) curves for antigen tests for SARS-CoV-2 RNA. The small but noticeable differences between estimates from a random-effect model (AUC = 0.844) and a fixed-effect model (AUC = 0.867) are consistent with the hypothesis of a threshold effect in diagnostic performances of assessed tests.
Discussion
Summary of Findings
In the current meta-analysis of 25 studies (29 estimates) on the diagnostic performances of RAD tests, we found a moderate agreement with RT-qPCR tests. Albeit quite specific (pooled estimates 99.4%; 95%CI 99.0–99.7), commercially available diagnostic kits were affected by relatively low sensitivity (i.e. 71.9%, 95%CI 59.8-81.5). In other words, available tests are at risk to incorrectly diagnose around 30% of all SARS-CoV-2 infection cases, being substantially inadequate for an extensive use as screening test. Actually, pooled performances were particularly poor for infections characterized by a very low content of viral copies in the collected specimens, which is often the case of asymptomatic patients suffering of COVID-19 (14,52,53), as substantially confirmed by the comparison of ROC curves. Moreover, estimates for specificity were affected by substantial heterogeneity, with a possible reporting bias (i.e. oversampling of studies characterized by “socially desirable” features), and a noticeable small study effect (i.e. smaller studies showing different performances than larger ones). In other terms, even though our data may hint that false positive to RAD tests are quite rare, the actual performance of antigenic tests in mass screening procedures could be significantly lower than expected.
Pros and Cons of RAD tests in SARS-CoV-2 management
The ongoing SARS-CoV-2 pandemic, and particularly its resurgence during European Winter Season, has urged international health authorities to assess the extensive implementation of RAD tests in the diagnostic procedures for SARS-CoV-2 (13,31,41,43–45). Because of the increasing surge of intensive care during the later stages of COVID-19 syndrome, earlier diagnoses of SARS-CoV-2 infections would spare available medical resources for at-risk patients, improving their chances for an immediate, more intensive assistance, since the early stages of the clinical syndrome. RAD tests may fit very accurately such requirements, finding a number of potential locations and targets for on-site testing, including but not limitedly: Emergency Departments interacting with subjects affected with influenza-like illness in order to rapidly discern COVID-19 vs. non-COVID-19 cases; primary care professionals; nursing homes for staff, resident and visitor screening; occupational settings in order to allow safe return of key workers (45,49). On the other hand, as RAD tests are relatively inexpensive, being also quicker to perform and to analyze, as well as easier and somewhat less invasive than conventional molecular assays on nasal swabs. In other words, they may represent the highly demanded mass “screening test” for SARS-CoV-2 infection that will allow the detection of those paucisymptomatic / asymptomatic patients that, eluding tracing and tracking activities, and therefore avoiding the confinement measures, are critical in maintaining and increasing viral circulation at community level (13,31,41,43–45).
Usability of RAD tests in mass screening procedures
It must be stressed that RAD tests are not a novelty in the diagnosis of respiratory diseases of viral etiology (46–48), and also their shortcoming have been diffusely acknowledged. More precisely, the analytical performances of RAD tests depend on factors such as the viral load; the quality of the specimen and how it is processed; the testing settings (14,45–48). Our results suggest that antigenic tests for SARS-CoV-2 share all such weaknesses, failing to achieve the high level of accuracy, in terms of both specificity and sensitivity otherwise required to be considered a reliable screening tests (45,50,51).
The poor sensitivity we identified, particularly among cases with a Ct ≥ 25, means that an extensive referral to RADs will miss a significant number of cases (50,51), i.e. persons not only potentially at risk to develop the dire consequences of the infection, but also still able to spread SARS-CoV-2 infection, eventually maintaining its endemic state. Furthermore, a large number of false negative results - true cases incorrectly told that they are free of disease - might lead a not negligible amount of people to indulge in at-risk habits and behaviors, contributing to a further spread of the infection at the community level. In other words, from an epidemiological point, RAD tests are not suitable for screening campaigns, unless we could rule out a significant role of asymptomatic patients in the spreading of the SARS-COV-2 virus, scenario which has already been excluded by scientific evidence (54,55). Conversely, it is possible to affirm that this unsatisfactory overall performance becomes somewhat satisfactory when limiting the use of RAD tests to high-viral load patients, which are generally those with a more symptomatic disease course (14,20,23,27,29,35,36,38,49,52–55). As a consequence, from a clinical point of view, RAD tests may be game-changing when reserved to the sole symptomatic patients, and particularly during the “exponential” stages of the epidemics (i.e. when the share of SARS-CoV-2 infected patients with higher viral load is reasonably high), in order to achieve a quick and reliable differential diagnosis with other respiratory infectious diseases. A focused referral to such instruments may therefore spare available diagnostic and clinical resources, eventually guaranteeing an early treatment start for positive cases, possibly at the home of the patient, avoiding delays which often result in hospitalization (31,43,45,49).
Reliability of the estimates
Substantially unsatisfying as they are as screening test when employed in a general population having higher share of patients with low viral load, the diagnostic accuracy of RAD tests we examined may actually be a substantial overestimation of the real one (56,57).
Firstly, we assessed sensitivity and specificity of RADs compared to RT-qPCR analysis on nasopharyngeal specimens. Despite their well acknowledged status, to date we are in the paradoxical situation where “gold standard” testing (i.e. nasopharyngeal swab with RT-qPCR processing) has a sensitivity which is far from satisfactory. In a recent study on 205 patients with confirmed SARS-CoV-2 infection, RT-qPCR positivity rate in nasal swabs accounted to only 63%, well below the 93% in bronchoalveolar lavage specimens, and 72% in sputum, with only a 32% positivity in pharyngeal swabs (58). As ACE2 receptor is reputed to be nearly ubiquitous in human body (59), such differences are reasonably due to an inappropriate timing of sample collection in relation to illness onset and/or last effective contact with an infected person, as well as to the proficiency in sampling technique (14,45–48,58). More precisely, not only oral and respiratory tissues seem to have a different conversion times (60–62), but secretory IgA, either specific for SARS-CoV-2 or maybe targeting other Coronaviruses, might also be able to interfere with the detection of viral antigens (63). Therefore, persistence of detectable viral components may be quite diachronous, with unclear clinical and epidemiological significance. As a consequence, on the one hand, the very same referral of RT-qPCR tests on nasal swabs may fail to recognize the whole of incident cases, particularly for very low viral loads, suggesting an even lower estimate for the “real-world” sensitivity of the assessed RADs. On the other hand, the heterogeneous representation of viral replication in respiratory and oral tissues may impair from their roots the comparisons of RADs with RT-qPCR tests on nasopharyngeal swabs, and particularly the eventual estimation of their actual accuracy (45,58,62).
Second, the large majority of reported studies were performed in clinical and/or laboratory settings, with intrinsic oversampling of positive SARS-CoV-2 compared to the overall sampled population, and eventual overestimation of actual sensitivity. As recently stated by Woloshin et al. (56,57), use of either known positive or contrived samples may lead to overestimates of the actual sensitivity of the assessed test, since the sample collection may miss infected material in the daily practice. In other words, the eventual pooled estimate for sensitivity in cohort studies may be an overestimate of the actual diagnostic performances. Not coincidentally, even though the field study of Pilarowski et al. reported on a diagnostic kit that was industrially analogous to other RADs that had performed particularly well, assessed sensitivity and specificity were far from being satisfying (i.e. 71.4% and 95.7%, respectively) (37).
Limits of our study
Some significant limitations of our study should be then stressed. First and foremost, more than half of sampled studied were retrieved from a pre-print platform (17,20,22–25,27,29,32–37), and corresponding results will require a further validation before being acknowledged as biomedical evidence.
Second, even though we performed a specific sub-analysis of RAD tests sensitivity where the viral load was available, our meta-analysis did not take in account the presumptive delay between test performing and the reported onset of the symptoms, as not regularly available from selected studies. As a consequence, it is possible that most of commercial kits that did not perform particularly well may have been impaired from the source, being employed in an inappropriate timeframe, underestimating their actual sensitivity in optimal settings (64–67). However, as such items have been designed to be deployed as a point-of-care diagnostics, including primary care units and Emergency Departments, it is reasonable that their potential users will refer to RADs in settings quite heterogeneous, forcibly far from optimal sampling windows.
Third, the studies included in the analyses were quite heterogeneous, not only in terms of sample size, but also when dealing with the reference populations, and only a subgroup of estimates reported the actual viral load of the sampled cases (14,18,36,38,20,23,25, 27,29,30,33,35). As viral load is instrumental in influencing the estimated sensitivity of the majority of RAD tests for viral infection (47,48,68), we cannot rule out that the pooled sensitivity we assessed may have been either inflated or flattened by the characteristics of the original population.
Fourth, in the majority of the studies we retrieved, sampled were collected by convenience (27,35,36): therefore, not only the eventual estimates are affected by the aforementioned oversampling of positive cases, failing to be representative of the general population, but also the lack of a preventive power analysis impairs the proper assessment of the tests’ performances. As a consequence, we suggest that our results should be retained cautiously and not as a comparative assessment of commercially available kits.
Conclusions
In conclusion, albeit promising, and potentially useful in certain, well-defined settings (69-70), the use of available RAD tests on suspected SARS-CoV-2 infection cases is currently questionable for clinical purposes. In other words, RAD tests not represent a suitable candidate for mass screening procedures, and they even cannot substitute the conventional collection of nasopharyngeal samples in daily practice. However, given the limitations of the present review, such as the small number of studies, the small sample sizes and the high, statistically significant amount of heterogeneity among studies, further high-quality research in the field is absolutely needed.
Author Contributions:
Conceptualization, M.R. and N.L.B.; methodology, M.R.; software, M.R., G.G.; validation, M.B., F.B, V.G..; formal analysis, M.R., P.F. ; investigation, M.V., C.S., S.R.; resources, P.F., M.R.; data curation, M.V., D.D., M.R., S.P.; writing—original draft preparation, M.R., F.M., M.V., S.P., S.R.; writing—review and editing, S.R., F.B., V.G.; visualization, M.R., S.P., N.L.B., S.R.; supervision, C.S., M.R., N.L.B.; project administration, M.R.; funding acquisition, N/A. All authors have read and agreed to the published version of the manuscript.
Funding:
This research received no external funding.
Conflicts of Interest:
Each author declares that he or she has no commercial associations (e.g. consultancies, stock ownership, equity interest, patent/licensing arrangement etc.) that might pose a conflict of interest in connection with the submitted article. The facts, conclusions, and opinions stated in the article represent the authors’ research, conclusions, and opinions, and are believed to be substantiated, accurate, valid, and reliable. However, as this article includes the results of personal researches of the authors, presenting correspondent, personal conclusions, and opinions, parent employers are not forced in any way to endorse or share its content and its potential implications.
References
- Guan W, Liang W, Zhao Y, et al. Comorbidity and its impact on 1590 patients with Covid-19 in China: A Nationwide Analysis. Eur. Respir. J. 2020;55:2000547. doi: 10.1183/13993003.00547-2020. doi: 10.1183/13993003.00547-2020. [DOI] [PMC free article] [PubMed] [Google Scholar]
- Huang C, Wang Y, Li X, et al. Clinical features of patients infected with 2019 novel coronavirus in Wuhan, China. Lancet. 2020;395:497–506. doi: 10.1016/S0140-6736(20)30183-5. doi: 10.1016/S0140-6736(20)30183-5. [DOI] [PMC free article] [PubMed] [Google Scholar]
- Li Q, Guan X, Wu P, et al. Early Transmission Dynamics in Wuhan, China, of Novel Coronavirus-Infected Pneumonia. N. Engl. J. Med. 2020;382:1199–1207. doi: 10.1056/NEJMoa2001316. doi: 10.1056/NEJMoa2001316. [DOI] [PMC free article] [PubMed] [Google Scholar]
- Riccò M, Ferraro P, Gualerzi G, et al. Point-of-Care diagnostic of SARS-CoV-2: knowledge, attitudes, and beliefs (KAP) of medical workforce in Italy. Acta Biomed. 2020;91:57–67. doi: 10.23750/abm.v91i2.9573. doi: 10.23750/abm.v91i2.9573. [DOI] [PMC free article] [PubMed] [Google Scholar]
- European Centre for Diseases Prevention and Control (ECDC) An overview of the rapid test situation for COVID-19 diagnosis in the EU / EEA; Stockholm. 2020 Available from: https://www.ecdc.europa.eu/en/publications-data/overview-rapid-test-situation-covid-19-diagnosis-eueea. (accessed on November 12th, 2020) [Google Scholar]
- Lippi G, Mattiuzzi C, Bovo C, Plebani M. Current laboratory diagnostics of coronavirus disease 2019 (COVID-19) Acta Biomed. 2019;91:137–145. doi: 10.23750/abm.v91i2.9548. doi: 10.23750/abm.v91i2.9548. [DOI] [PMC free article] [PubMed] [Google Scholar]
- Tang YW, Schmitz JE, Persing DH, Stratton CW. The Laboratory Diagnosis of COVID-19 Infection: Current Issues and Challenges. J. Clin. Microbiol. 2020;58:e00512–20. doi: 10.1128/JCM.00512-20. doi: 10.1128/JCM.00512-20. [DOI] [PMC free article] [PubMed] [Google Scholar]
- Riccò M, Ferraro P, Gualerzi G, et al. Point-of-Care Diagnostic Tests for Detecting SARS-CoV-2 Antibodies : A Systematic Review and Meta-Analysis of Real-World Data. J. Clin. Med. 2020;9:1515. doi: 10.3390/jcm9051515. doi: 10.3390/jcm9051515. [DOI] [PMC free article] [PubMed] [Google Scholar]
- Vashist SK. In Vitro Diagnostic Assays for COVID-19: Recent Advances and Emerging Trends. Diagnostics (Basel, Switzerland) 2020;10:202. doi: 10.3390/diagnostics10040202. doi: 10.3390/diagnostics10040202. [DOI] [PMC free article] [PubMed] [Google Scholar]
- Cassaniti I, Novazzi F, Giardina F, et al. Performance of VivaDiagTM COVID-19 IgM/IgG Rapid Test is inadequate for diagnosis of COVID-19 in acute patients referring to emergency room department. J. Med. Virol. 2020;92:1724–1727. doi: 10.1002/jmv.25800. doi: 10.1002/jmv.25800. [DOI] [PMC free article] [PubMed] [Google Scholar]
- Xu R, Cui B, Duan X, Zhang P, Zhou X, Yuan Q. Saliva: potential diagnostic value and transmission of 2019-nCoV. Int. J. Oral Sci. 2020;12:11. doi: 10.1038/s41368-020-0080-z. doi: 10.1038/s41368-020-0080-z. [DOI] [PMC free article] [PubMed] [Google Scholar]
- World Health Organization (WHO) Antigen-detection in the diagnosis of SARS-CoV-2 infection using rapid immunoassays. 2020 Available from: https://www.who.int/publications/i/item/antigen-detection-in-the-diagnosis-of-sars-cov-2infection-using-rapid-immunoassays ; accessed on Novembre 12th, 2020. [Google Scholar]
- World Health Organization (WHO) Laboratory testing strategy recommendations for COVID-19: interim guidance, 22 March 2020. 2020 World Health Organization. available from https://apps.who.int/iris/handle/10665/331509 , accessed on November 12th, 2020. [Google Scholar]
- Scohy A, Anantharajah A, Bodéus M, Kabamba-Mukadi B, Verroken A, Rodriguez-Villalobos H. Low performance of rapid antigen detection test as frontline testing for COVID-19 diagnosis. J. Clin. Virol. 2020;129:104455. doi: 10.1016/j.jcv.2020.104455. doi: 10.1016/j.jcv.2020.104455. [DOI] [PMC free article] [PubMed] [Google Scholar]
- Moher D, Liberati A, Tetzlaff J, et al. Preferred reporting items for systematic reviews and meta-analyses: The PRISMA statement. PLoS Med. 2009;6:e1000097. doi: 10.1371/journal.pmed.1000097. doi: 10.1371/journal.pmed.1000100. [DOI] [PMC free article] [PubMed] [Google Scholar]
- Bizzaro N, Villalta D, Giavarina D, Tozzoli R. Are anti-nucleosome antibodies a better diagnostic marker than anti-dsDNA antibodies for systemic lupus erythematosus? A systematic review and a study of metanalysis. Autoimmun. Rev. 2012;12:97–106. doi: 10.1016/j.autrev.2012.07.002. doi: doi: 10.1016/j.autrev.2012.07.002. [DOI] [PubMed] [Google Scholar]
- Herrera V, Hsu V, Adewale A, et al. Testing Healthcare Workers Exposed to COVID19 using Rapid Author ’ s Affiliation : medRxiv 2020. 2020;2020:0812.20172726. doi: 10.1101/2020.08.12.20172726. [Google Scholar]
- Porte L, Legarraga P, Vollrath V, Aguilera X. Evaluation of a novel antigen-based rapid detection test for the diagnosis of SARS-CoV-2 in respiratory samples. Int J Infect Dis. 2020;99:328–333. doi: 10.1016/j.ijid.2020.05.098. doi: 10.1016/j.ijid.2020.05.098. [DOI] [PMC free article] [PubMed] [Google Scholar]
- Young S, Taylor SN, Cammarata CL, et al. Clinical evaluation of BD Veritor SARS-CoV-2 point-of-care test performance compared to PCR-based testing and versus the Sofia 2 SARS Antigen point-of-care test. J Clin Microbiol. 2020;59:e02338–20. doi: 10.1128/JCM.02338-20. doi: 10.1128/JCM.02338-20. [DOI] [PMC free article] [PubMed] [Google Scholar]
- Veyrenche N, Bollore K, Pisoni A, et al. Diagnosis value of SARS-CoV-2 antigen/antibody combined testing using rapid diagnostic tests at hospital admission. medRxiv 2020. 2020:09.19.20197855. doi: 10.1002/jmv.26855. doi: 10.1101/2020.09.19.20197855. [DOI] [PMC free article] [PubMed] [Google Scholar]
- Cerutti F, Burdino E, Grazia M, et al. Urgent need of rapid tests for SARS CoV-2 antigen detection: Evaluation of the SD-Biosensor antigen test for SARS-CoV-2. J. Clin. Virol. 2020;132:104654. doi: 10.1016/j.jcv.2020.104654. doi: 10.1016/j.jcv.2020.104654. [DOI] [PMC free article] [PubMed] [Google Scholar]
- Albert E, Torres I, Bueno F, et al. Field evaluation of a rapid antigen test (PanbioTM COVID-19 Ag Rapid Test 2 Device) for the diagnosis of COVID-19 in primary healthcare centers. medRxiv 2020. 2020:10.16.20213850. doi: 10.1101/2020.10.16.20213850. [Google Scholar]
- Gremmels H, Winkel BMF, Schuurman R, et al. Real-life validation of the Panbio COVID-19 Antigen Rapid Test (Abbott) in community-dwelling subjects with symptoms of potential SARS-CoV-2 infection. medRxiv. 2020 doi: 10.1016/j.eclinm.2020.100677. 2020.10.16.20214189 doi: 10.1101/2020.10.16.20214189. [DOI] [PMC free article] [PubMed] [Google Scholar]
- Van der Moeren N, Zwart VF, Lodder EB, et al. Performance evaluation of a sars-cov-2 rapid antigentest: test performance in the community in the netherlands. medRxiv. 2020 2020.10.19.20215202 doi: 10.1101/2020.10.19.20215202. [Google Scholar]
- Lindner AK, Nikolai O, Kausch F, et al. Head-to-head comparison of SARS-CoV-2 antigen-detecting rapid test with self-collected anterior nasal swab versus professional- collected nasopharyngeal swab. medRxiv. 2020 doi: 10.1183/13993003.03961-2020. 2020.10.19.20215202 doi: 10.1101/2020.10.26.20219600. [DOI] [PMC free article] [PubMed] [Google Scholar]
- Hirotsu Y, Maejima M, Shibusawa M, Nagakubo Y. Comparison of automated SARS-CoV-2 antigen test for COVID-19 infection with quantitative RT-PCR using 313 nasopharyngeal swabs, including from seven serially followed patients. Int J Infect Dis. 2020;99:397–402. doi: 10.1016/j.ijid.2020.08.029. doi: 10.1016/j.ijid.2020.08.029. [DOI] [PMC free article] [PubMed] [Google Scholar]
- Krüger LJ, Gaeddert M, Köppel L, et al. Evaluation of the accuracy , ease of use and limit of detection of novel , rapid , antigen- detecting point-of-care diagnostics for SARS-CoV-2. medRxiv. 2020 2020.10.01.20203836 doi: 10.1101/2020.10.01.20203836. [Google Scholar]
- Lambert-Niclot S, Cuffel A, Le Pape S, et al. Evaluation of a Rapid Diagnostic Assay for Detection of SARS-CoV-2 Antigen in Nasopharyngeal Swabs. J. Clin. Microbiol. 2020;58:e00977–20. doi: 10.1128/JCM.00977-20. doi: 10.1128/JCM.00977-20. [DOI] [PMC free article] [PubMed] [Google Scholar]
- Linares M, Pérez Tanoira R, Romanyk J, et al. Panbio antigen rapid test is reliable to diagnose SARS-CoV-2 infection in the first 7 days after the onset of symptoms. medRxiv. 2020 doi: 10.1016/j.jcv.2020.104659. 2020.09.20.20198192. doi: 10.1101/2020.09.20.20198192. [DOI] [PMC free article] [PubMed] [Google Scholar]
- Liotti FM, Menchinelli G, Lalle E, et al. Performance of a novel diagnostic assay for rapid SARS-CoV-2 antigen detection in nasopharynx samples. Clin. Microbiol. Infect. 2021;27:487–488. doi: 10.1016/j.cmi.2020.09.030. doi: 10.1016/j.cmi.2020.09.030. [DOI] [PMC free article] [PubMed] [Google Scholar]
- Mertens P, De Vos N, Martiny D, et al. Development and Potential Usefulness of the COVID-19 Ag Respi-Strip Diagnostic Assay in a Pandemic Context. Front. Med. 2020;7:225. doi: 10.3389/fmed.2020.00225. doi: 10.3389/fmed.2020.00225. [DOI] [PMC free article] [PubMed] [Google Scholar]
- Pekosz A, Cooper CK, Parvu V, et al. Antigen-based testing but not real-time PCR correlates with SARS-CoV-2 virus culture. medRxiv. 2020 2020.10.02.20205708. doi: 10.1101/2020.10.02.20205708. [Google Scholar]
- Porte L, Legarraga P, Iruretagoyena M, et al. Rapid SARS-CoV-2 antigen detection by immunofluorescence – a new tool to detect infectivity. medRxiv. 2020 2020.10.04.20206466. doi: 10.1101/2020.10.04.20206466. [Google Scholar]
- Freymond A, Segura M. Performance evaluation of the Simtomax ¯ CoronaCheck rapid diagnostic test. medRxiv. 2020 doi: 10.1016/j.jviromet.2021.114178. 2020.10.28.20219667. doi: 10.1101/2020.10.28.20219667. [DOI] [PMC free article] [PubMed] [Google Scholar]
- Alemany A, Baro B, Ouchi D, et al. Analytical and Clinical Performance of the Panbio COVID-19 Antigen-Detecting Rapid Diagnostic Test Background. medRxiv. 2020 doi: 10.1016/j.jinf.2020.12.033. 2020.10.30.20223198. doi: 10.1101/2020.10.30.20223198. [DOI] [PMC free article] [PubMed] [Google Scholar]
- Courtellement L, Guinard J, Guillaume C, et al. Real-life performance of a novel antigen detection test on nasopharyngeal specimens for SARS-CoV-2 infection diagnosis: a prospective study. medRxiv. 2020 doi: 10.1002/jmv.26896. 2020.10.28.20220657. doi: 10.1101/2020.10.28.20220657. [DOI] [PMC free article] [PubMed] [Google Scholar]
- Pilarowski G, Lebel P, Sunshine S, et al. Performance characteristics of a rapid SARS-CoV-2 antigen detection assay at a public plaza testing site in San Francisco. medRxiv. 2020 doi: 10.1093/infdis/jiaa802. 2020.11.02.20223891. doi: 10.1101/2020. 11.02.20223891. [DOI] [PMC free article] [PubMed] [Google Scholar]
- Gupta A, Khurana S, Das R, et al. Rapid chromatographic immunoassay-based evaluation of COVID-19: A cross- sectional, diagnostic test accuracy study & its implications for COVID-19 management in India. Indian J Med Res Epub. 2021;153:126–131. doi: 10.4103/ijmr.IJMR_3305_20. doi: 10.4103/ijmr.IJMR_3305_20. [DOI] [PMC free article] [PubMed] [Google Scholar]
- Nalumansi A, Lutalo T, Kayiwa J, et al. Field Evaluation of the Performance of a SARS-CoV-2 Antigen Rapid Diagnostic Test in Uganda using Nasopharyngeal Samples. Int. J. Infect. Dis. 2020;104:282–286. doi: 10.1016/j.ijid.2020.10.073. doi: 10.1016/j.ijid.2020.10.073. [DOI] [PMC free article] [PubMed] [Google Scholar]
- Blairon L, Wilmet A, Beukinga I, Tré-hardy M. Implementation of rapid SARS-CoV-2 antigenic testing in a laboratory without access to molecular methods: Experiences of a general hospital. J Clin Virol. 2020;129:104472. doi: 10.1016/j.jcv.2020.104472. doi: 10.1016/j.jcv.2020.104472. [DOI] [PMC free article] [PubMed] [Google Scholar]
- Fenollar F, Bouam A, Ballouche M, et al. Evaluation of the Panbio Covid-19 rapid antigen detection test device for the screening of patients with Covid-19. J. Clin. Virol. 2020 doi: 10.1128/JCM.02589-20. JCM.02589-20. doi: 10.1128/JCM.02589-20. [DOI] [PMC free article] [PubMed] [Google Scholar]
- Dutta NK, Mazumdar K, Gordy JT. The Nucleocapsid Protein of SARS–CoV-2: a Target for Vaccine Development. J. Virol. 2020;94:e00647–20. doi: 10.1128/JVI.00647-20. doi: 10.1128/JVI.00647-20. [DOI] [PMC free article] [PubMed] [Google Scholar]
- World Health Organization (WHO) Assessment tool for laboratories implementing COVID-19 virus testing. 2020 Available from: https://www.who.int/publications/i/item/assessment-tool-for-laboratories-implementing-covid-19-virus-testing ; accessed on November 12th, 2020. [Google Scholar]
- Harrington A, Cox B, Snowdon J, et al. Comparison of Abbott ID Now and Abbott m2000 methods for the detection of SARS-CoV-2 from nasopharyngeal and nasal swabs from symptomatic patients. J. Clin. Microbiol. 2020;58:e00798–20. doi: 10.1128/JCM.00798-20. doi: 10.1128/JCM.00798-20. [DOI] [PMC free article] [PubMed] [Google Scholar]
- Vandenberg O, Martiny D, Rochas O, van Belkum A, Kozlakidis Z. Considerations for diagnostic COVID-19 tests. Nat. Rev. Microbiol. 2021;19:171–183. doi: 10.1038/s41579-020-00461-z. doi: 10.1038/s41579-020-00461-z. [DOI] [PMC free article] [PubMed] [Google Scholar]
- Lee CK, Cho CH, Woo MK, Nyeck AE, Lim CS, Kim WJ. Evaluation of Sofia fluorescent immunoassay analyzer for influenza A/B virus. J. Clin. Virol. 2012;55:239–243. doi: 10.1016/j.jcv.2012.07.008. doi: 10.1016/j.jcv.2012.07.008. [DOI] [PubMed] [Google Scholar]
- Hurt AC, Alexander R, Hibbert J, Deed N, Barr IG. Performance of six influenza rapid tests in detecting human influenza in clinical specimens. J. Clin. Virol. 2007;39:132–135. doi: 10.1016/j.jcv.2007.03.002. doi: 10.1016/j.jcv.2007.03.002. [DOI] [PubMed] [Google Scholar]
- Uyeki TM, Prasad R, Vukotich C, et al. Low sensitivity of rapid diagnostic test for influenza. Clin. Infect. Dis. 2009;48:e89–92. doi: 10.1086/597828. doi: 10.1086/597828. [DOI] [PubMed] [Google Scholar]
- Cui Z, Chang H, Wang H, et al. Development of a rapid test kit for SARS-CoV-2: an example of product design. Bio-Design Manuf. 2020 doi: 10.1007/s42242-020-00075-7. epub ahead of print. doi: 10.1007/s42242-020-00075-7. [DOI] [PMC free article] [PubMed] [Google Scholar]
- Miller AB. Fundamental issues in screening for cancer. In: Schottenfeld D, Fraumeni J, editors. In Cancer epidemiology and prevention. Second edition. New York: Oxford University Press; 1996. [Google Scholar]
- Wilson J, Jungne G. 1st. Vol. 34. Geneva: World Health Organization; 1968. Principles and practice of screening for disease. [Google Scholar]
- Salvatore P, Dawson P, Wadhwa A, et al. Epidemiological Correlates of PCR Cycle Threshold Values in the Detection of SARS-CoV-2. Clin Infect Dis. 2020:ciaa1469. doi: 10.1093/cid/ciaa1469. doi: 10.1093/cid/ciaa1469. [DOI] [PMC free article] [PubMed] [Google Scholar]
- Riva E, Sainaghi PP, Turriziani O, Antonelli G, Patti G. SARS-CoV-2 infection: diagnostic testing results occasionally require special attention. Emerg. Microbes Infect. 2020;9:1955–1957. doi: 10.1080/22221751.2020.1814165. doi: 10.1080/22221751.2020.1814165. [DOI] [PMC free article] [PubMed] [Google Scholar]
- Yanes-Lane M, Winters N, Fregonese F, et al. Proportion of asymptomatic infection among COVID-19 positive persons and their transmission potential: A systematic review and meta-analysis. PLoS One. 2020;15:e0241536. doi: 10.1371/journal.pone.0241536. doi: 10.1371/journal.pone.0241536. [DOI] [PMC free article] [PubMed] [Google Scholar]
- Bellato V, Konishi T, Pellino G, et al. Screening policies, preventive measures and in-hospital infection of COVID-19 in global surgical practices. J. Glob. Health. 2020;10:020507. doi: 10.7189/jogh.10.020507. doi: 10.7189/jogh.10.020507. [DOI] [PMC free article] [PubMed] [Google Scholar]
- Mutti A. Occupational Medicine in the time of COVID-19. Med Lav. 2020;111:83–86. doi: 10.23749/mdl.v111i2.9546. doi: 10.23749/mdl.v111i2.9546. [DOI] [PMC free article] [PubMed] [Google Scholar]
- Woloshin S, Patel N. Kesselheim AS. False Negative Tests for SARS-CoV-2 Infection. N Eng J Med. 2020;383(6):e38. doi: 10.1056/NEJMp2015897. doi: 10.1056/NEJMp2015897. [DOI] [PubMed] [Google Scholar]
- Patel U, Malik P, Mehta D, et al. Early epidemiological indicators, outcomes, and interventions of COVID-19 pandemic: A systematic review. J Glob Health. 2020;10:020506. doi: 10.7189/jogh.10.020506. doi: 10.7189/jogh.10.020506. [DOI] [PMC free article] [PubMed] [Google Scholar]
- Bourgonje A.R, Abdulle A.E, Timens W, Hillebrands J, Navis G.J, Gordijn S.J, et al. Angiotensin-converting enzyme-2 (ACE2), SARS-CoV -2 and pathophysiology of coronavirus disease 2019 (COVID -19) J. Pathol. 2020;251:228–248. doi: 10.1002/path.5471. doi: 10.1002/path.5471. [DOI] [PMC free article] [PubMed] [Google Scholar]
- Fang Z, Zhang Y, Hang C, Ai J, Li S, Zhang W. Comparisons of viral shedding time of SARS-CoV-2 of different samples in ICU and non-ICU patients. J. Infect. 2020;81:147–178. doi: 10.1016/j.jinf.2020.03.013. doi: 10.1016/j.jinf.2020.03.013. [DOI] [PMC free article] [PubMed] [Google Scholar]
- Azzi L, Carcano G, Gianfagna F, et al. Saliva is a reliable tool to detect SARS-CoV-2. J. Infect. 2020;81:e45–e50. doi: 10.1016/j.jinf.2020.04.005. doi: 10.1016/j.jinf.2020.04.005. [DOI] [PMC free article] [PubMed] [Google Scholar]
- Riccò M, Ranzieri S, Peruzzi S, et al. RT-qPCR assays based on saliva rather than on nasopharyngeal swabs are possible but should be interpreted with caution: Results from a systematic review and metaanalysis. Acta Biomed. 2020;91:e2020025. doi: 10.23750/abm.v91i3.10020. doi: 10.23750/abm.v91i3.10020. [DOI] [PMC free article] [PubMed] [Google Scholar]
- Padoan A, Zuin S, Cosma C, Basso D, Plebani M, Bonfante F. Clinical performances of an ELISA for SARS-CoV-2 antibody assay and correlation with neutralization activity. Clin. Chim. Acta. 2020;510:654–655. doi: 10.1016/j.cca.2020.08.024. doi: 10.1016/j.cca.2020.08.024. [DOI] [PMC free article] [PubMed] [Google Scholar]
- Reusken CB, Buiting A, Bleeker-Rovers C, et al. Rapid assessment of regional SARS-CoV-2 community transmission through a convenience sample of healthcare workers, the Netherlands, March 2020. Eurosurveillance. 2020;25:2000334. doi: 10.2807/1560-7917.ES.2020.25.12.2000334. doi: 10.2807/1560-7917.ES.2020.25.12.2000334. [DOI] [PMC free article] [PubMed] [Google Scholar]
- To KKW, Tsang OTY, Leung WS, et al. Temporal profiles of viral load in posterior oropharyngeal saliva samples and serum antibody responses during infection by SARS-CoV-2: an observational cohort study. Lancet Infect. Dis. 2020;20:565–574. doi: 10.1016/S1473-3099(20)30196-1. doi: 10.1016/S1473-3099(20)30196-1. [DOI] [PMC free article] [PubMed] [Google Scholar]
- Ceron JJ, Lamy E, Martinez-Subiela S, et al. Use of Saliva for Diagnosis and Monitoring the SARS-CoV-2: A General Perspective. J. Clin. Med. 2020;9:1491. doi: 10.3390/jcm9051491. doi: 10.3390/jcm9051491. [DOI] [PMC free article] [PubMed] [Google Scholar]
- Hirotsu Y, Maejima M, Shibusawa M, et al. Pooling RT-PCR test of SARS-CoV-2 for large cohort of “healthy” and infection-suspected patients: A prospective and consecutive study on 1,000 individuals. medRxiv. 2020 202005.04.20088146. doi: 10.1101/2020.05.04.20088146. [Google Scholar]
- Chartrand C, Leeflang MMG, Minion J, Brewer T, Pai M. Review Accuracy of Rapid Influenza Diagnostic Tests. Ann. Intern. Med. 2012;156:500–511. doi: 10.7326/0003-4819-156-7-201204030-00403. doi: 10.7326/0003-4819-156-7-201204030-00403. [DOI] [PubMed] [Google Scholar]
- Riccò M, Ranzieri S, Marchesi F. Rapid antigen tests for large-scale diagnostic campaigns: A case study from North-Eastern Italy. J Infect. 2021;82:e39–e40. doi: 10.1016/j.jinf.2021.01.011. doi: 10.1016/j.jinf.2021.01.011. [DOI] [PMC free article] [PubMed] [Google Scholar]
- Riccò M. A systematic review on rapid antigen test devices for SARS-CoV-2 in nursing homes: Useful, but handle with care. Enferm Infecc Microbiol Clin. 2022 doi: 10.1016/j.eimc.2022.02.012. epub ahead of print. doi: 10.1016/j.eimc.2022.02.012. [DOI] [PMC free article] [PubMed] [Google Scholar]