Abstract
Background
Transforming growth factor (TGF)-β signaling functions importantly in regulating tumor microenvironment (TME). This study developed a prognostic gene signature based on TGF-β signaling-related genes for predicting clinical outcome of patients with lung adenocarcinoma (LUAD).
Methods
TGF-β signaling-related genes came from The Molecular Signature Database (MSigDB). LUAD prognosis-related genes were screened from all the genes involved in TGF-β signaling using least absolute shrinkage and selection operator (LASSO) Cox regression analysis and then used to establish a risk score model for LUAD. ESTIMATE and CIBERSORT analyzed infiltration of immune cells in TME. Immunotherapy response was analyzed by the TIDE algorithm.
Results
A LUAD prognostic 5-gene signature was developed based on 54 TGF-β signaling-related genes. Prognosis of high-risk patients was significantly worse than low-risk patients. Both internal validation and external dataset validation confirmed a high precision of the risk model in predicting the clinical outcomes of LUAD patients. Multivariate Cox analysis demonstrated the model independence in OS prediction of LUAD. The risk model was significantly related to the infiltration of 9 kinds of immune cells, matrix, and immune components in TME. Low-risk patients tended to respond more actively to anti-PD-1 treatment, while high-risk patients were more sensitive to chemotherapy and targeted therapy.
Conclusions
The 5-gene signature based on TGF-β signaling-related genes showed potential for LUAD management.
Supplementary Information
The online version contains supplementary material available at 10.1186/s12957-022-02595-1.
Keywords: TGF-β signaling, Lung adenocarcinoma, Risk model, Prognosis, Tumor microenvironment, Immunotherapy
Background
Lung cancer is the second most commonly diagnosed cancer and a leading cause of cancer death in 2020, accounting for approximately 11.4 and 18.0% of all cancer cases and cancer of the year [1]. Lung adenocarcinoma refers to a type of lung cancer resulted from epithelial cells of glands or adenoid structures and is the most frequently diagnosed subtype in patients who do not have a smoking habit [2]. Though LUAD treatment has been greatly improved, its 5-year survival rate is approximately 15% [3]. Some studies have shown that biomarker-driven treatment can improve the survival rate of patients with advanced and metastatic LUAD [5–7]. Earlier, Zhang et al. [8] found that the high expression of CCT6A is related to the poor prognosis of non-small cell lung cancer (LUSC). Li et al. [9] reported that moesin can be used as a prognostic marker of lung adenocarcinoma, and it improves patients’ prognosis by enhancing immune lymphocyte infiltration. Cai et al. [10] identified TCN1 as a prognostic and diagnostic biomarker for lung adenocarcinoma by using a variety of bioinformatics methods. Similarly, Wu et al. [11] identified DPYSL2 as a diagnostic and prognostic potential in LUAD and an immunotherapeutic target based on a variety of public databases and verified that it is effective to screen biomarkers of single gene of lung adenocarcinoma by using public database data. In addition, a multi-gene joint model has also achieved great success. Jia et al. [12] used m6A-related gene set to determine 3-gene signature using various bioinformatics methods to evaluate the prognosis and immune response of LUSC. Xu et al. [13] applied protein interaction network mining to identify seven key genes in LUAD and validated that the high expression of these genes is related to adverse prognosis and may improve the response to immunotherapy. Peng et al. [14] integrated gene expression and mutation characteristics and developed a 14-gene prognostic model to evaluate tumor progression in LUAD. Although there have been a large number of biomarkers, they are rarely used in clinic practice, which suggests that effective biomarkers need to be further verified to better guide the treatment of LUAD.
The transforming growth factor (TGF)-β signaling pathway plays a dual role in tumorigenesis. In early cancer cells, the TGF-β signaling pathway could inhibit tumor growth and promote cell cycle arrest and apoptosis. However, its activation in advanced cancer stimulates tumorigenesis, facilitating cancer cell escape from immune surveillance and inducing metastasis and chemical resistance [15]. TGF-β signaling inhibition is an emerging strategy in cancer therapy, several small and large molecule compounds have been developed to inhibit TGF-β signaling [16]. For example, TGF-β antibodies, antisense oligonucleotides, and small molecules inhibitors of TGF-β receptor-1 (TGF-βR1) have shown great potential in inhibiting TGF-β signaling [17, 18]. Recent development of the TGF-β signaling pathway with related gene expression prognostic tools and response biomarkers may provide alternative means to select patients suitable for receiving the anti-TGF-β intervention [19]. However, at present, the development of effective TGF-β signaling inhibitors faces many clinical challenges, especially deciding the timing of treatment and selecting effective biomarkers for patient selection [20].
In the precision oncology era, new predictive tools have been developed to study tumor progression at a molecular level, providing new possibilities for the development of diagnosis, prognosis, and targeted therapy for cancer management [21]. In this study, 54 TGF-β signaling-related genes were identified, and a prognostic model based on TGF-β signaling-related genes was established and verified in 6 independent meta-cohorts. This study established a prognostic model and applied it to analyze the immune cell infiltration and response of LUAD patients with different risks to immunotherapy, chemotherapy, and targeted therapy. In clinical practice, the prognostic model will help to distinguish LUAD patients who could benefit from receiving TGF-β signaling inhibition treatment.
Methods
Acquisition of public data and processing
RNA-seq and corresponding clinical data of LUAD samples, including age, gender, T stage, N stage, M stage, AJCC stage, OS, and smoking history, were downloaded from TCGA (https://tcga-data.nci.nih.gov/tcga/). Transcriptome profiling data of LUAD patients in independent Meta-Cohorts (GSE31210, GSE30219, GSE50081, GSE13213, GSE19188, GSE41271) were downloaded from Gene Expression Omnibus (GEO) database. Patients’ clinical data are listed in Table 1. Supplementary Fig. 1 shows the workflow of this study.
Table 1.
Clinical characteristics of patients in training and validation sets
| Clinical features | TCGA-LUAD | GSE31210 | GSE30219 | GSE50081 | GSE13213 | GSE19188 | GSE41271 |
|---|---|---|---|---|---|---|---|
| OS | |||||||
| 0 | 318 | 191 | 40 | 76 | 68 | 16 | 112 |
| 1 | 182 | 35 | 43 | 51 | 49 | 24 | 70 |
| T stage | |||||||
| T1 | 167 | 69 | 43 | ||||
| T2 | 267 | 12 | 82 | ||||
| T3 | 45 | 2 | 2 | ||||
| T4 | 18 | ||||||
| TX | 3 | ||||||
| N stage | |||||||
| N0 | 324 | 80 | 94 | ||||
| N1 | 94 | 3 | 33 | ||||
| N2 | 69 | ||||||
| N3 | 2 | ||||||
| NX | 11 | ||||||
| M stage | |||||||
| M0 | 332 | 83 | 127 | ||||
| M1 | 24 | ||||||
| MX | 144 | ||||||
| Stage | |||||||
| I | 268 | 168 | 92 | 79 | 101 | ||
| II | 119 | 58 | 35 | 13 | 28 | ||
| III | 80 | 25 | 49 | ||||
| IV | 25 | 4 | |||||
| X | 8 | ||||||
| Gender | |||||||
| Male | 230 | 121 | 65 | 60 | 25 | 92 | |
| Female | 270 | 105 | 18 | 57 | 15 | 90 | |
| Age | |||||||
| ≤ 65 | 237 | 176 | 60 | 40 | 78 | ||
| > 65 | 253 | 50 | 23 | 87 | 39 | ||
| NA | 10 | ||||||
| Smoking | |||||||
| 1 | 71 | ||||||
| 2 | 119 | ||||||
| 3 | 129 | ||||||
| 4 | 163 | ||||||
| 5 | 4 | ||||||
| 7 | 14 | ||||||
Annotation: Lifelong non-smoker (less than 100 cigarettes smoked in lifetime) = 1; current smoker (includes daily smokers and non-daily smokers or occasional smokers) = 2; current reformed smoker for > 15 years (greater than 15 years) = 3; current reformed smoker for ≤ 15 years (less than or equal to 15 years) = 4; current reformed smoker, duration not specified = 5; smoking history not documented = 7
Identification of TGF-β signaling-related genes
The TGF-β signaling-related data set was retrieved from MSigDB (https://www.gsea-msigdb.org/gsea/msigdb/index.jsp) [22], and 54 TGF-β signaling-related genes were identified and collated.
Prognostic gene signature construction
Univariate Cox analysis was employed to identify genes affecting OS of patients with LUAD from 54 TGF-β signaling-related genes. After that, the prognostic genes were further identified by LASSO and multivariate Cox regression to establish a prediction model. Patients in TCGA and GEO were grouped into low-risk and high-risk groups according to the risk score. The survival status plot, risk heatmap, and Kaplan–Meier curve were employed to compare the survival difference between the two groups. The receiver operating characteristic curve (ROC) was used to evaluate the accuracy and specificity of the model.
Independent prognostic value analysis
Univariate Cox analysis was applied to analyze the prediction of the risk model and clinical parameters such as age, gender, T stage, N stage, M stage, and AJCC stage. To determine whether the risk model was affected by other clinical factors, multivariate Cox regression survival analysis was employed.
GO and KEGG analyses for risk score-related genes
Genes showing a significant negative correlation with risk score were identified by cut-off criteria of Pearson | R |> 0.4 and P < 0.05 and then analyzed with GO [23] and KEGG [24] using the R package “clusterProfiler” [25].
Comparison of immune-related characteristics between high- and low-risk score
ESTIMATE was used to calculate immune score and stromal score to determine the ratio of immune components to matrix components in TME. In addition, the infiltration score of immune cells in TME of the high-risk group and low-risk group was calculated by CIBERSORT [26].
Prediction of immune/chemotherapy response
Immunotherapy and chemotherapy responses of LUAD cases were assessed by the Genomics of Drug Sensitivity in Cancer (GDSC) [27]. The Tumor Immune Dysfunction and Exclusion (TIDE) algorithm was employed to assess the response of each LUAD sample to immunotherapy. Unsupervised subclass mapping method SubMap [28] was used to evaluate the correspondence or similarity between risk groups in the TCGA dataset and patients receiving immunotherapy in the GSE78220 dataset. The diversity of chemosensitivity between high- and low-risk scores was analyzed by the Wilcoxon test.
Statistical analysis
Statistical analyses were performed in R software (version 3.6.3). Chi-squared tests and Fischer’s exact tests were conducted for comparing inter-group discrete variables. Continuous variables within the two groups were compared using the Wilcoxon test. A comparison of more than two groups of continuous variables was performed using the Kruskal–Wallis test. Bilateral P < 0.05 was seen as statistically significant.
Results
Establishment of a prognostic gene signature with TGF-β signaling-related genes for LUAD patients
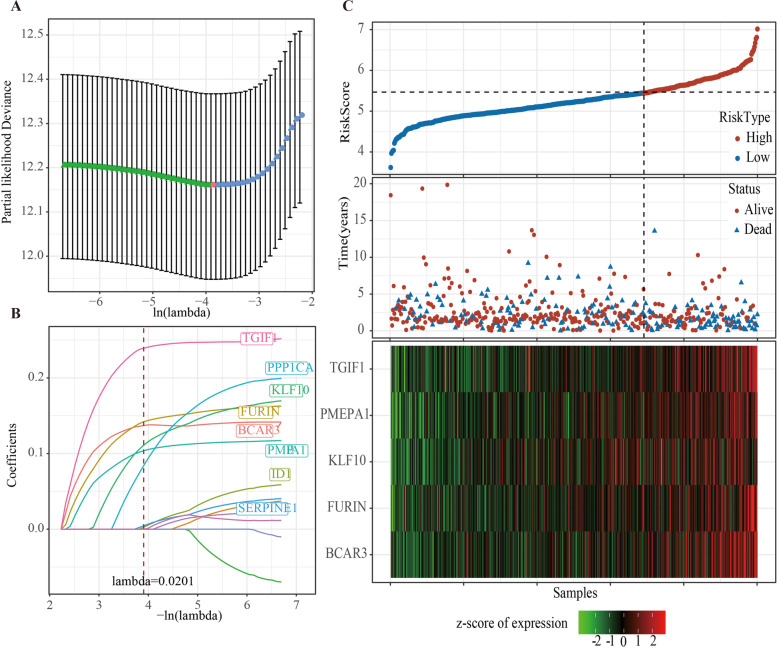
The univariate Cox regression OS analysis showed that 13 TGF-β signaling-related genes were closely associated with the OS of LUAD patients (Supplementary Table S1). Eight genes were screened by LASSO and multivariate Cox regression and used to develop risk score signature (Fig. 1A, B). To reduce unnecessary component genes in the model, the stepAIC method was used to optimize the model. The risk score formula of LUAD patients was obtained: risk score = 0.126*PMEPA1 + 0.294*TGIF1 + 0.184*FURIN + 0.162*BCAR3 + 0.187*KLF10. The TCGA samples were arranged in ascending order according to the value of the risk score. We analyzed the survival times of samples in the high- and low-risk groups and found that the mean survival probability for patients with high-risk scores was lower than that for those with low-risk scores. The expression profiles of the five genes were shown in a heatmap, which revealed that the expression of the five genes was upregulated with the increase of risk score (Fig. 1C). In addition, we also compared the expression differences of these five genes in cancer and adjacent tumors. It can be observed that except BCAR3, PMEPA1, TGIF1, FURIN, and KLF10 were significantly overexpressed in tumor samples (Supplementary Fig. 2A). Survival analysis showed that the samples with a high expression of these genes had a poor prognosis (Supplementary Fig. 2B-F).
Fig. 1.
Establishment of a prognostic gene signature for LUAD patients based on TGF-β signaling-related genes. A LASSO Cox regression was applied to screen the optimal parameter with cross-validation. B The coefficients for each gene during the training process. C The risk score of each LUAD patient in TCGA was ranked in ascending order, survival status, and heat map of 5 TGF-β signaling-related gene expression profiles
Validation of the risk score signature
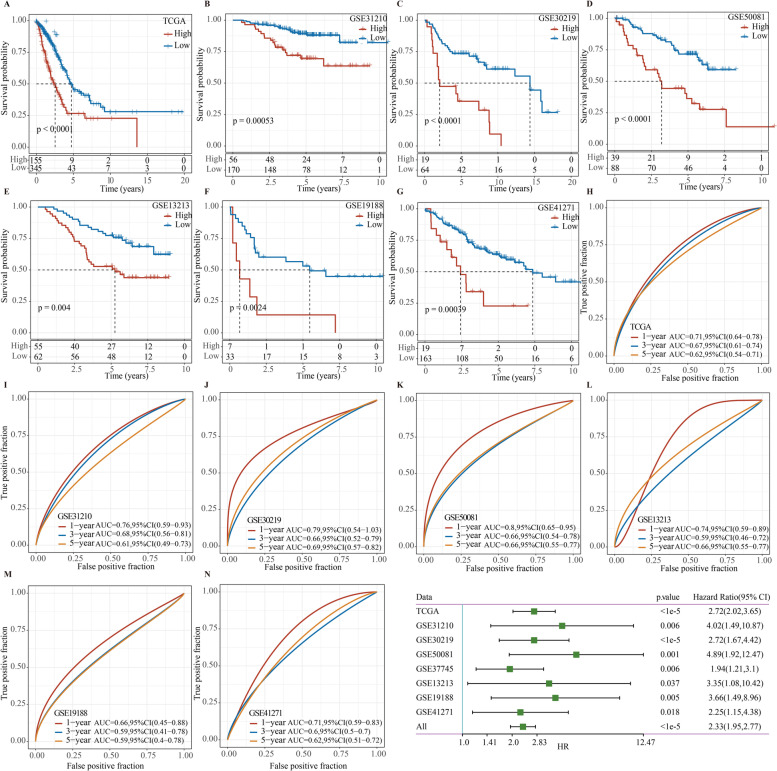
Survival analysis on the training set (TCGA-LUAD cohort) and external validation sets (GSE31210, GSE30219, GSE50081, GSE13213, GSE19188, and GSE41271 cohort) revealed that higher risk scores were closely linked to worse prognosis (Fig. 2A–G). The AUCs of the risk model for predicting 1-, 3-, and 5-year OS were 0.71, 0.67, and 0.62 in the training set, respectively (Fig. 2H). The AUCs of ROC curves in the validation sets were 0.76, 0.79, 0.8, 0.74, 0.66, and 0.71 for predicting 1-year OS, respectively. The AUCs of the ROC curves for 5-year OS in the validation sets were 0.61, 0.69, 0.66, 0.66, 0.59, and 0.62, respectively (Fig. 2I–N). Subsequently, univariate Cox analysis further confirmed the correlation between each cohort and LUAD prognosis (Fig. 2O). Overall, the results indicated the effectiveness of the prediction model.
Fig. 2.
Verification of the effectiveness of the prediction model. Kaplan–Meier survival curve of different cohorts, including training set (A), GSE31210 (B), GSE30219 (C), GSE50081 (D), GSE13213 (E), GSE19188 (F), and GSE41271 (G) cohorts. Kaplan–Meier curve between high- and low-risk groups in TCGA-LUAD (H), GSE31210 (I), GSE30219 (J), GSE50081 (K), GSE13213 (L), GSE19188 (M), and GSE41271 (N) cohorts. O Univariate Cox analysis was employed to evaluate the correlation between risk score and prognosis of LUAD in each cohort
Association between the risk score and clinical characteristics
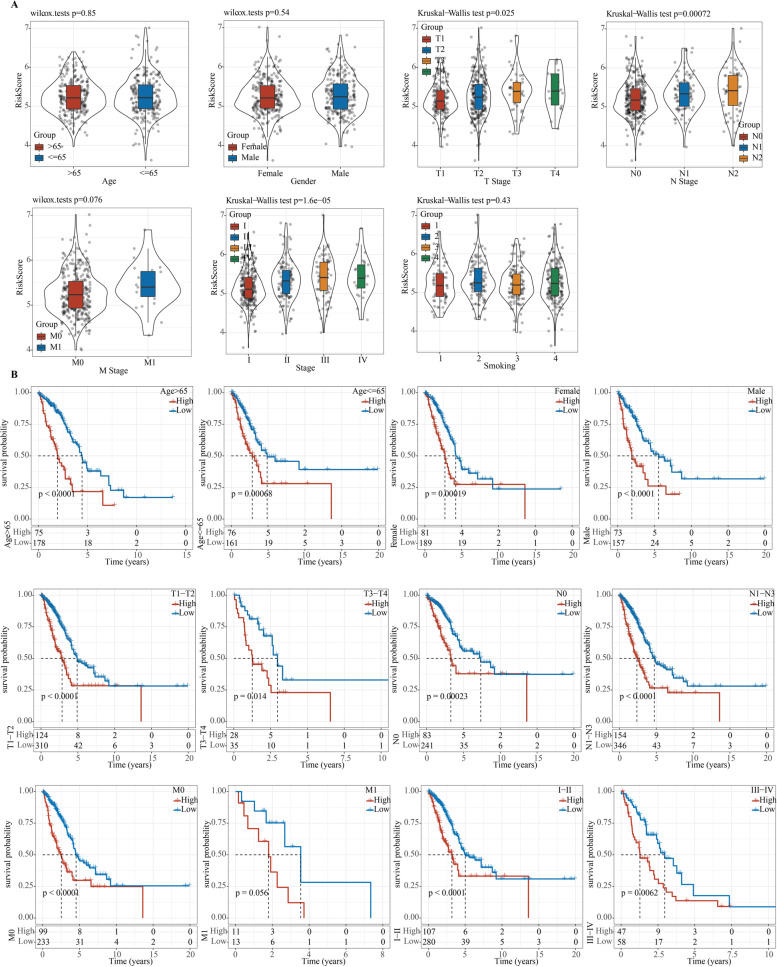
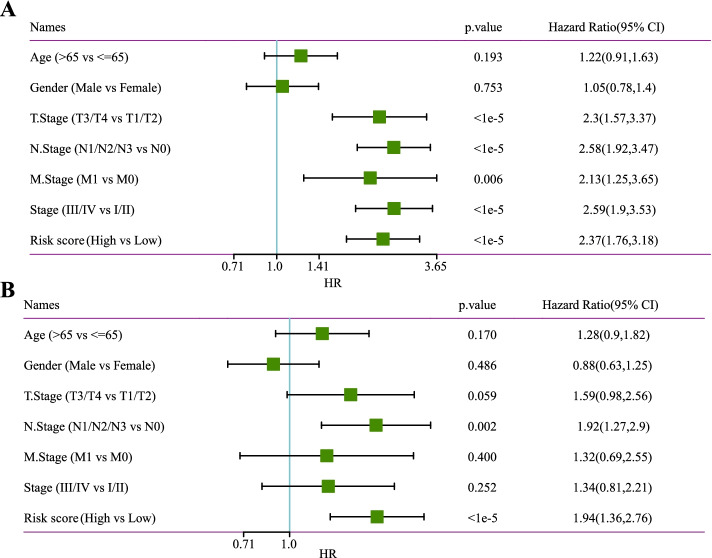
We explored the risk scores in different subgroups stratified by age, gender, T stage, N stage, M stage, AJCC stage, and smoking history, respectively, and found that risk scores were not significantly linked to age, gender, M stage, or smoking, but were significantly related to T stage, N stage, and AJCC stage. Moreover, patients with advanced LUAD had noticeably higher risk scores than those with early LUAD (Fig. 3A). To better assess the prognostic ability of the risk model, we conducted a stratified OS analysis based on clinical risk factors. The model performed well in stratifying age > 65 and ≤ 65, male and female, T1–T2 and T3–4, N0 and N1–N3, M0, and AJCC stages I–II and III–IV (Fig. 3B). Furthermore, univariate and multivariate Cox regression analyses revealed that the N stage and the current model were independent predictors for LUAD prognosis (Fig. 4A, B). Taken together, the risk model established in this study had a high precision in predicting the OS of LUAD patients with different clinical characteristics.
Fig. 3.
Correlation between the risk score and clinical characteristics. A Relationship between risk score and age, gender, T stage, N stage, M stage, AJCC stage, and smoking history. B OS Kaplan–Meier curves for LUAD samples stratified by age, gender, T stage, N stage, M stage, and AJCC stage
Fig. 4.
Recognition of independent prognostic factors. A Univariate Cox regression analysis on patients’ OS in the TCGA-LUAD cohort. B Multivariable Cox regression to analyze the correlation between risk score and clinical characteristics
Identification and functional annotation of risk score-related genes
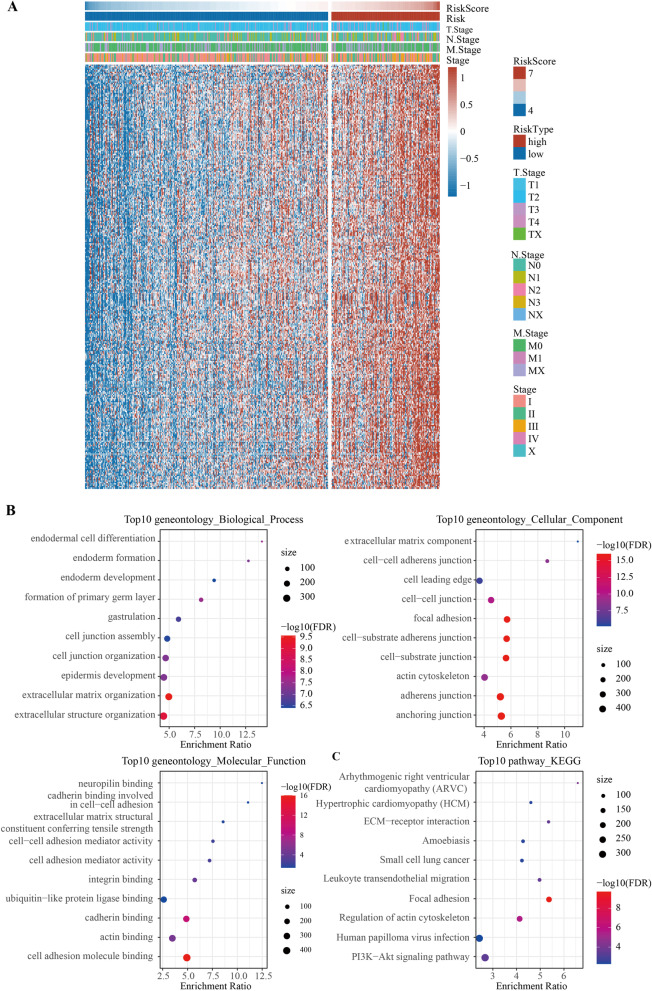
A total of 299 genes with a significant negative correlation with risk score were identified by Pearson correlation analysis (Supplementary Table S2), and the heatmap of their expression is shown in Fig. 5A. To detect signal pathways of risk score-related genes, GO and KEGG enrichment analysis was carried out. In biological process (BP), enriched pathways such as endodermal cell differentiation, endoderm formation, and endoderm development were closely related to tissue development. The results showed that cellular component (CC) and molecular function (MF) of the risk score-related genes were involved in cancer cell migration (Fig. 5B). Moreover, KEGG enrichment analysis demonstrated that 299 genes were closely associated with ECM − receptor interaction, small cell lung cancer, and leukocyte transendothelial migration and so on (Fig. 5C).
Fig. 5.
Identification and functional annotation of risk score-related genes. A Heat map showed the expression of risk score-related genes. B The bubble chart showed the result of the GO analysis of risk score-related genes. C KEGG enrichment analysis of ARGs. Top 10 significant KEGG signal pathways of risk score-related genes
Immune cell infiltration and inflammation between high- and low-risk score
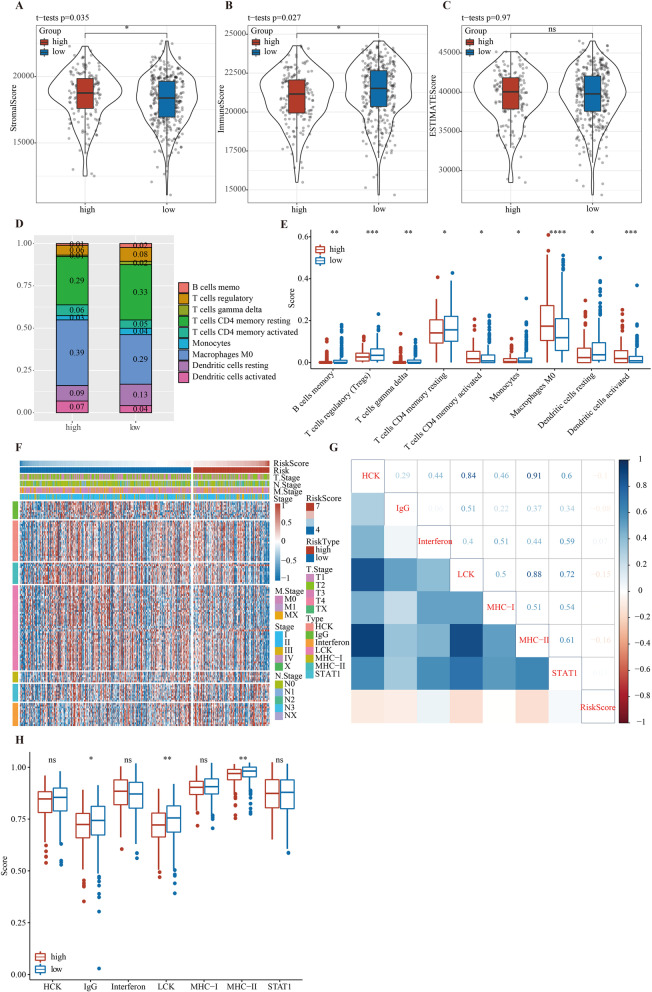
To determine the difference of TME status between the high-risk group and low-risk group, ESTIMATE analysis was carried out. The stromal score of the high-risk group was higher than that of the low-risk group (Fig. 6A). The low-risk score group showed a higher immune score (Fig. 6B), and there was no prominent diversity in ESTIMATE score between the two groups (Fig. 6C). Furthermore, in TME, 9 out of 22 immune cells, including memory B cells, regulatory T cells, gamma delta T cells, resting memory CD4 T cells, activated memory CD4 T cells, monocytes, macrophages M0, resting dendritic cells, and activated dendritic cells, showed significantly different infiltration ratios between high- and low-risk groups. Among these 9 kinds of cells, resting memory CD4 T cells and macrophages M0 accounted for the high proportion of TME in both high-risk and low-risk groups (Fig. 6D). The infiltration score of activated memory CD4 T cells, macrophages M0, and activated dendritic cells was significantly higher in the high-risk group, but that of memory B cells, regulatory T cells, gamma delta T cells, resting memory CD4 T cells, and monocytes and resting dendritic cells was significantly lower in the high-risk group than the low-risk group (Fig. 6E). To investigate the characteristics of tumor inflammation associated with risk score, we used 7 metagenes, including 104 genes linked to different types of inflammation and immune responses [29]. The heatmap presented the relationship between these genes and the risk score (Fig. 6F). The expression data of these metagenes were converted into enrichment scores by GSVA, and correlograms were generated based on comparisons between the risk score and the 7 metagenes. The results showed that risk score was negatively associated with MHC II, LCK, IgG, and HCK, which also scored higher in the low-risk score group (Fig. 6G, H).
Fig. 6.
Immune cell infiltration and inflammation between high- and low-risk scores. A–C Stromal score, immune score, and ESTIMATE score between the high-risk score group and low-risk score group. D Boxplot showed the infiltration ratio of 9 immune cells in high- and low-risk groups. E Boxplot of infiltration scores of 9 kinds of immune cells in high- and low-risk groups. F Heat map displayed the relationship between risk score and 7 metagenes. G Correlation matrix of risk score and the seven metagenes. H Boxplot of the correlation between risk score and 7 metagenes
Prediction of response to immunotherapy, chemotherapy, and targeted therapy based on the risk model
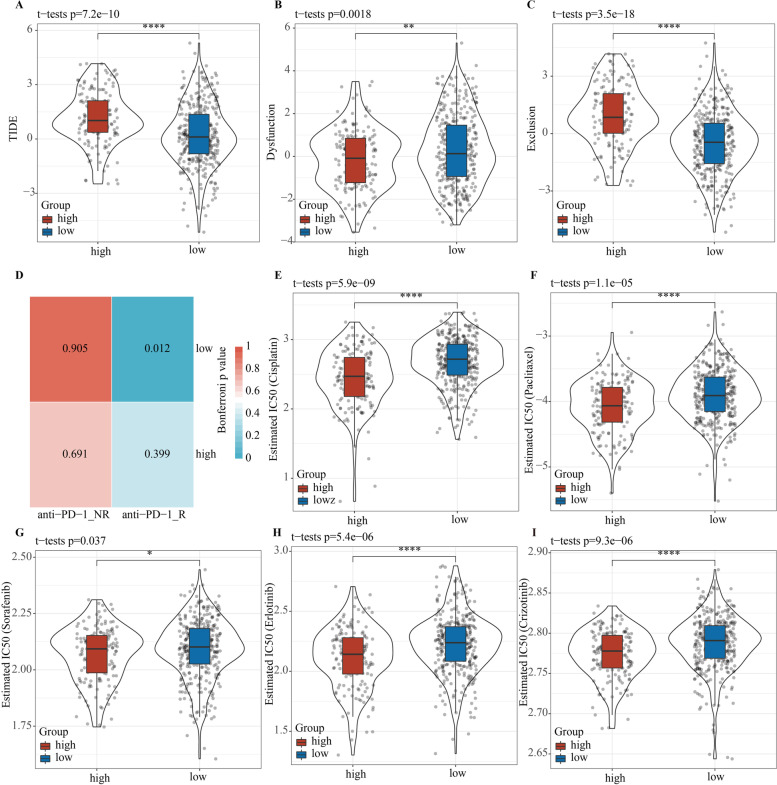
We also explored the risk score in predicting the outcome of patients receiving immunotherapy, chemotherapy, and targeted therapy. Firstly, the TIDE algorithm was used to estimate the response of each risk group to immunotherapy. The low-risk group showed lower TIDE score and T cell exclusion score and higher T cell dysfunction score when compared with the high-risk group, suggesting that the immunotherapy response of low-risk patients may be more active (Fig. 7A–C). Submap analysis results indicated that the low-risk in melanoma patients from GSE78220 had a greater tendency to respond to anti-PD-1 treatment (Fig. 7D). At present, targeted therapy and chemotherapy are still the main treatment options for treating LUAD [30]; we therefore evaluated the sensitivity of the two risk groups to chemotherapeutic agents (cisplatin and paclitaxel) and targeted agents (erlotinib, sorafenib, and crizotinib). A comparison of the estimated IC50 values of each sample demonstrated that patients in the high-risk group were more sensitive to cisplatin, paclitaxel, erlotinib, sorafenib, and crizotinib (Fig. 7E–I). Hence, the risk score model can be used to predict the response of patients with LUAD to immunotherapy, chemotherapy, and targeted therapy.
Fig. 7.
Predictive value of risk score for immunotherapy, chemotherapy, and targeted therapies. A Violin plots visualized the TIDE score between high- and low-risk groups. B Differences in T cell exclusion among patients with different risks. C Violin plots of the T cell dysfunction value for high- and low-risk groups. D Subclass mapping analyzed the response to anti-PD-1 treatment between high- and low-risk groups. Violin plots exhibited the diversity in estimated IC50 values of cisplatin (E), paclitaxel (F), erlotinib (G), sorafenib (H), and crizotinib (I) between high- and low-risk groups
Discussion
The treatment of LUAD patients is mainly based on clinical indicators such as the TNM stage. However, increasing available treatment options also makes it difficult to decide on treatment plans [31]. In recent years, bioinformatics analysis using microarray technology has been proven to be an important tool in facilitating clinical decision-making [32]. Up to now, establishing and verifying predictive models allows studies to apply transcriptomic data and bioinformatics to improve the diagnosis, treatment, and prognosis of cancer [33–35]. It is reported that TGF-β signal transduction disorder is common in tumors and that inhibition of TGF-β signal is considered to be a prerequisite and a main way to improve the efficacy of immunotherapy, including in tumors with non-TGF-β-responsive cancer cells [36]. Accordingly, a comprehensive understanding of the expression profile of TGF-β signaling-related genes in LUAD may improve the diagnosis, treatment, and prognosis of patients.
In view of the biological effects of TGF-β signaling in cancer, we selected TGF-β signaling-related genes expressed in LUAD and developed a prognostic score model on the basis of 5 TGF-β signaling-related genes. LUAD patients with high-risk scores had shorter OS times than patients with low-risk scores. The same result was also found in the external data, reflecting the precision of the risk model in distinguishing LUAD with different prognoses. In addition, stratified analysis and multivariate Cox analysis confirmed that the risk score model also had a strong and independent predictive capacity when LUAD patients were re-grouped according to different clinicopathological characteristics.
It should be noted that most of the genes in the risk model have been identified to be associated with TGF-β signaling and are involved in regulating cancer progression. PMEPA1 is a direct target gene for TGF-β signaling and controls the duration and intensity of TGF-β/Smad signal transduction via a negative feedback loop [37]. It is reported that TMEPAI is high-expressed in many types of cancers except prostate cancer and is concerned with a poor prognosis [38]. PMEPA1 promotes EMT-mediated metastasis by activating TGF-β non-classical signal cascades in colorectal cancer [39]. The TMEPAI expression in lung cancer is positively correlated with mesenchymal phenotype and migration potential [40]. We found that TMEPAI was a risk gene in LUAD, which was consistent with the previous conclusion. It has been revealed that TGIF1 is abnormally high-expressed in LUAD tissues, and this is closely related to a high proliferative activity of tumor tissues and poor prognosis of patients with LUAD [41]. FURIN has been shown to be high-expressed in various cancer types, including in lung cancer; moreover, the mRNA and protein levels of FURIN are associated with the invasiveness of lung cancer cell lines [42]. Furthermore, FURIN expression is a potential marker of lung cancer and therapeutic target [43, 44]. As a protective factor for multiple myeloma, high-expressed BCAR3 indicates a favorable prognosis [45]. However, in primary breast tumors, a relatively low level of BCAR3 expression is associated with poor distant metastasis-free survival and recurrence-free survival [46]. Similarly, our analysis showed that BCAR3 was a risk factor for LUAD. Previous studies of Vivek Kumar Mishra found that in non-small cell lung cancer, KLF10 suppresses TGF-β-induced EMT via a negative feedback mechanism [47]. The above evidence suggested that all the five TGF-β signaling-related genes were associated with malignant processes of many kinds of cancers, including LUAD.
According to a previous report, TGF-β signaling regulates inflammatory/immune cell infiltration in TME [48]. We found differences in TME status among LUAD patients with different risks not only in immune and matrix scores, but also in immune cell infiltration, which could further affect patients’ response to immune checkpoint blocking therapy. Recent studies have indicated that TME regulates tumor response to immunotherapy [49]. We therefore predicted the response of LUAD patients with different risks to immunotherapy and observed that low-risk patients had a higher tendency to respond to anti-PD-1 treatment and were more sensitive to chemotherapy and targeted therapy.
Conclusions
This study developed a 5-gene signature on the basis of TGF-β signaling-related genes for predicting the prognosis of LUAD. It was proven that the risk scoring model had a strong and independent prediction ability. The current risk model can characterize the TME and can be used to predict the response of LUAD patients to immunotherapy, chemotherapy, and targeted therapy. A larger sample size is needed to further study the risk prediction model to validate its use in the clinical management of LUAD.
Supplementary Information
Additional file 1: Supplementary Figure 1. Work flow chart.
Additional file 2: Supplementary Figure 2. Expression and prognosis of five genes. A: Differential expression distribution of five genes in cancer and adjacent samples. B-F: Prognostic K-M curve of high expression samples and low expression samples of 5 genes, The best cut-off value was obtained by maxstat to group the patients.
Additional file 3: Supplementary Table S1. Univariate Cox regression analysis of 54 TGFβ signaling-related genes.
Additional file 4: Supplementary Table S2. The genes identified by Pearson correlation analysis were significantly negatively correlated with risk score.
Acknowledgements
Not applicable.
Abbreviations
- TME
Tumor microenvironment
- LUAD
Lung adenocarcinoma
- MSigDB
Molecular Signature Database
- LASSO
Least absolute shrinkage and selection operator
- OS
Overall survival
- GEO
Gene Expression Omnibus
- ROC
Receiver operating characteristic curve
- GDSC
Genomics of Drug Sensitivity in Cancer
Authors’ contributions
XHH, QB, and XPL designed the study. YL contributed to the literature research, and XYC analyzed and interpreted the data. QY, LZ, and XXY wrote the initial draft of the manuscript. XHH, QB, and XPL reviewed and edited the manuscript. The authors read and approved the final manuscript.
Funding
Not applicable.
Availability of data and materials
The datasets generated during and/or analyzed during the current study are available in the [GSE31210] repository, [https://www.ncbi.nlm.nih.gov/geo/query/acc.cgi?acc=GSE31210]; in the [GSE30219] repository, [https://www.ncbi.nlm.nih.gov/geo/query/acc.cgi?acc=GSE30219]; in the [GSE50081] repository, [https://www.ncbi.nlm.nih.gov/geo/query/acc.cgi?acc=GSE50081]; in the [GSE13213] repository, [https://www.ncbi.nlm.nih.gov/geo/query/acc.cgi?acc=GSE13213]; in the [GSE19188] repository, [https://www.ncbi.nlm.nih.gov/geo/query/acc.cgi?acc=GSE19188]; in the [GSE41271] repository, [https://www.ncbi.nlm.nih.gov/geo/query/acc.cgi?acc=GSE41271]; in the [GSE31210] repository, [https://www.ncbi.nlm.nih.gov/geo/query/acc.cgi?acc=GSE31210]; in the [GSE30219] repository, [https://www.ncbi.nlm.nih.gov/geo/query/acc.cgi?acc=GSE30219]; in the [GSE50081] repository, [https://www.ncbi.nlm.nih.gov/geo/query/acc.cgi?acc=GSE50081]; in the [GSE13213] repository, [https://www.ncbi.nlm.nih.gov/geo/query/acc.cgi?acc=GSE13213]; in the [GSE19188] repository, [https://www.ncbi.nlm.nih.gov/geo/query/acc.cgi?acc=GSE19188]; and in the [GSE41271] repository, [https://www.ncbi.nlm.nih.gov/geo/query/acc.cgi?acc=GSE41271].
Declarations
Ethics approval and consent to participate
Not applicable.
Consent for publication
Not applicable.
Competing interests
The authors declare that they have no competing interests.
Footnotes
Publisher’s Note
Springer Nature remains neutral with regard to jurisdictional claims in published maps and institutional affiliations.
Qian Yu, Liang Zhao, and Xue-xin Yan contributed equally to this work.
Contributor Information
Xiao-hua Hu, Email: gxykdhxh@sina.com.
Qing Bu, Email: buqing1993@163.com.
Xiao-ping Lv, Email: 450100.lxxp58@hotmail.com.
References
- 1.Sung H, Ferlay J, Siegel RL, Laversanne M, Soerjomataram I, Jemal A, et al. Global Cancer Statistics 2020: GLOBOCAN estimates of incidence and mortality worldwide for 36 cancers in 185 countries. CA Cancer J Clin. 2021;71(3):209–249. doi: 10.3322/caac.21660. [DOI] [PubMed] [Google Scholar]
- 2.Mullangi S, Lekkala MR. Adenocarcinoma. StatPearls. Treasure Island (FL) 2021. [Google Scholar]
- 3.Spella M, Stathopoulos GT. Immune resistance in lung adenocarcinoma. Cancers (Basel). 2021;13(3):384. [DOI] [PMC free article] [PubMed]
- 4.Arbour KC, Riely GJ. Systemic therapy for locally advanced and metastatic non-small cell lung cancer: a review. JAMA. 2019;322(8):764–774. doi: 10.1001/jama.2019.11058. [DOI] [PubMed] [Google Scholar]
- 5.Liu Q, Zhang Y, Liu M, Xu R, Yi F, Wei Y, et al. The benefits and risks of pembrolizumab in combination with chemotherapy as first-line therapy in small-cell lung cancer: a single-arm meta-analysis of noncomparative clinical studies and randomized control trials. World J Surg Oncol. 2021;19(1):298. doi: 10.1186/s12957-021-02410-3. [DOI] [PMC free article] [PubMed] [Google Scholar]
- 6.Xu X, Li R, Zhu P, Zhang P, Chen J, Lin Y, et al. Clinical efficacy and safety of maintenance therapy for advanced non-small cell lung cancer: a retrospective real-world study. World J Surg Oncol. 2021;19(1):231. doi: 10.1186/s12957-021-02340-0. [DOI] [PMC free article] [PubMed] [Google Scholar]
- 7.Takashima S, Imai K, Atari M, Matsuo T, Nakayama K, Sato Y, et al. Clinical benefits of adjuvant chemotherapy with carboplatin and gemcitabine in patients with non-small cell lung cancer: a single-center retrospective study. World J Surg Oncol. 2020;18(1):263. doi: 10.1186/s12957-020-02041-0. [DOI] [PMC free article] [PubMed] [Google Scholar]
- 8.Zhang T, Shi W, Tian K, Kong Y. Chaperonin containing t-complex polypeptide 1 subunit 6A correlates with lymph node metastasis, abnormal carcinoembryonic antigen and poor survival profiles in non-small cell lung carcinoma. World J Surg Oncol. 2020;18(1):156. doi: 10.1186/s12957-020-01911-x. [DOI] [PMC free article] [PubMed] [Google Scholar]
- 9.Li YQ, Zheng Z, Liu QX, Lu X, Zhou D, Zhang J, et al. Moesin as a prognostic indicator of lung adenocarcinoma improves prognosis by enhancing immune lymphocyte infiltration. World J Surg Oncol. 2021;19(1):109. doi: 10.1186/s12957-021-02229-y. [DOI] [PMC free article] [PubMed] [Google Scholar]
- 10.Li H, Guo L, Cai Z. TCN1 is a potential prognostic biomarker and correlates with immune infiltrates in lung adenocarcinoma. World J Surg Oncol. 2022;20(1):83. doi: 10.1186/s12957-022-02556-8. [DOI] [PMC free article] [PubMed] [Google Scholar]
- 11.Wu YJ, Nai AT, He GC, Xiao F, Li ZM, Tang SY, et al. DPYSL2 as potential diagnostic and prognostic biomarker linked to immune infiltration in lung adenocarcinoma. World J Surg Oncol. 2021;19(1):274. doi: 10.1186/s12957-021-02379-z. [DOI] [PMC free article] [PubMed] [Google Scholar]
- 12.Jia E, Ren N, Guo B, Cui Z, Zhang B, Xue J. Construction and validation of a novel prognostic model for lung squamous cell cancer based on N6-methyladenosine-related genes. World J Surg Oncol. 2022;20(1):59. doi: 10.1186/s12957-022-02509-1. [DOI] [PMC free article] [PubMed] [Google Scholar]
- 13.Xu Z, Wang S, Ren Z, Gao X, Xu L, Zhang S, et al. An integrated analysis of prognostic and immune infiltrates for hub genes as potential survival indicators in patients with lung adenocarcinoma. World J Surg Oncol. 2022;20(1):99. doi: 10.1186/s12957-022-02543-z. [DOI] [PMC free article] [PubMed] [Google Scholar]
- 14.Li G, Wang G, Guo Y, Li S, Zhang Y, Li J, et al. Development of a novel prognostic score combining clinicopathologic variables, gene expression, and mutation profiles for lung adenocarcinoma. World J Surg Oncol. 2020;18(1):249. doi: 10.1186/s12957-020-02025-0. [DOI] [PMC free article] [PubMed] [Google Scholar]
- 15.Colak S, Ten Dijke P. Targeting TGF-beta signaling in cancer. Trends Cancer. 2017;3(1):56–71. doi: 10.1016/j.trecan.2016.11.008. [DOI] [PubMed] [Google Scholar]
- 16.Seoane J, Gomis RR. TGF-beta family signaling in tumor suppression and cancer progression. Cold Spring Harb Perspect Biol. 2017;9(12). [DOI] [PMC free article] [PubMed]
- 17.Syed V. TGF-beta signaling in cancer. J Cell Biochem. 2016;117(6):1279–1287. doi: 10.1002/jcb.25496. [DOI] [PubMed] [Google Scholar]
- 18.Imai K, Minamiya Y, Goto A, Nanjo H, Saito H, Motoyama S, et al. Bronchioloalveolar invasion in non-small cell lung cancer is associated with expression of transforming growth factor-beta1. World J Surg Oncol. 2013;11:113. doi: 10.1186/1477-7819-11-113. [DOI] [PMC free article] [PubMed] [Google Scholar]
- 19.Massague J. TGFbeta in cancer. Cell. 2008;134(2):215–230. doi: 10.1016/j.cell.2008.07.001. [DOI] [PMC free article] [PubMed] [Google Scholar]
- 20.Neuzillet C, Tijeras-Raballand A, Cohen R, Cros J, Faivre S, Raymond E, et al. Targeting the TGFbeta pathway for cancer therapy. Pharmacol Ther. 2015;147:22–31. doi: 10.1016/j.pharmthera.2014.11.001. [DOI] [PubMed] [Google Scholar]
- 21.Barger JF, Nana-Sinkam SP. MicroRNA as tools and therapeutics in lung cancer. Respir Med. 2015;109(7):803–812. doi: 10.1016/j.rmed.2015.02.006. [DOI] [PMC free article] [PubMed] [Google Scholar]
- 22.Liberzon A, Birger C, Thorvaldsdottir H, Ghandi M, Mesirov JP, Tamayo P. The Molecular Signatures Database (MSigDB) hallmark gene set collection. Cell Syst. 2015;1(6):417–425. doi: 10.1016/j.cels.2015.12.004. [DOI] [PMC free article] [PubMed] [Google Scholar]
- 23.Gene Ontology C The Gene Ontology (GO) project in 2006. Nucleic Acids Res. 2006;34(Database issue):D322–6. doi: 10.1093/nar/gkj021. [DOI] [PMC free article] [PubMed] [Google Scholar]
- 24.Ogata H, Goto S, Sato K, Fujibuchi W, Bono H, Kanehisa M. KEGG: Kyoto Encyclopedia of Genes and Genomes. Nucleic Acids Res. 1999;27(1):29–34. doi: 10.1093/nar/27.1.29. [DOI] [PMC free article] [PubMed] [Google Scholar]
- 25.Yu G, Wang LG, Han Y, He QY. clusterProfiler: an R package for comparing biological themes among gene clusters. OMICS. 2012;16(5):284–287. doi: 10.1089/omi.2011.0118. [DOI] [PMC free article] [PubMed] [Google Scholar]
- 26.Newman AM, Liu CL, Green MR, Gentles AJ, Feng W, Xu Y, et al. Robust enumeration of cell subsets from tissue expression profiles. Nat Methods. 2015;12(5):453–457. doi: 10.1038/nmeth.3337. [DOI] [PMC free article] [PubMed] [Google Scholar]
- 27.Yang W, Soares J, Greninger P, Edelman EJ, Lightfoot H, Forbes S, et al. Genomics of Drug Sensitivity in Cancer (GDSC): a resource for therapeutic biomarker discovery in cancer cells. Nucleic Acids Res. 2013;41(Database issue):D955–61. doi: 10.1093/nar/gks1111. [DOI] [PMC free article] [PubMed] [Google Scholar]
- 28.Hoshida Y, Brunet JP, Tamayo P, Golub TR, Mesirov JP. Subclass mapping: identifying common subtypes in independent disease data sets. PLoS One. 2007;2(11):e1195. doi: 10.1371/journal.pone.0001195. [DOI] [PMC free article] [PubMed] [Google Scholar]
- 29.Rody A, Holtrich U, Pusztai L, Liedtke C, Gaetje R, Ruckhaeberle E, et al. T-cell metagene predicts a favorable prognosis in estrogen receptor-negative and HER2-positive breast cancers. Breast Cancer Res. 2009;11(2):R15. doi: 10.1186/bcr2234. [DOI] [PMC free article] [PubMed] [Google Scholar]
- 30.Yang S, Zhang Z, Wang Q. Emerging therapies for small cell lung cancer. J Hematol Oncol. 2019;12(1):47. doi: 10.1186/s13045-019-0736-3. [DOI] [PMC free article] [PubMed] [Google Scholar]
- 31.Oberije C, De Ruysscher D, Houben R, van de Heuvel M, Uyterlinde W, Deasy JO, et al. A validated prediction model for overall survival from stage III non-small cell lung cancer: toward survival prediction for individual patients. Int J Radiat Oncol Biol Phys. 2015;92(4):935–944. doi: 10.1016/j.ijrobp.2015.02.048. [DOI] [PMC free article] [PubMed] [Google Scholar]
- 32.Fountzilas E, Tsimberidou AM. Overview of precision oncology trials: challenges and opportunities. Expert Rev Clin Pharmacol. 2018;11(8):797–804. doi: 10.1080/17512433.2018.1504677. [DOI] [PMC free article] [PubMed] [Google Scholar]
- 33.Meng D, Jin H, Zhang X, Yan W, Xia Q, Shen S, et al. Identification of autophagy-related risk signatures for the prognosis, diagnosis, and targeted therapy in cervical cancer. Cancer Cell Int. 2021;21(1):362. doi: 10.1186/s12935-021-02073-w. [DOI] [PMC free article] [PubMed] [Google Scholar]
- 34.Song W, He X, Gong P, Yang Y, Huang S, Zeng Y, et al. Glycolysis-related gene expression profiling screen for prognostic risk signature of pancreatic ductal adenocarcinoma. Front Genet. 2021;12:639246. doi: 10.3389/fgene.2021.639246. [DOI] [PMC free article] [PubMed] [Google Scholar]
- 35.Du Y, Wang B, Jiang X, Cao J, Yu J, Wang Y, et al. Identification and validation of a stromal EMT related LncRNA signature as a potential marker to predict bladder cancer outcome. Front Oncol. 2021;11:620674. doi: 10.3389/fonc.2021.620674. [DOI] [PMC free article] [PubMed] [Google Scholar]
- 36.Derynck R, Turley SJ, Akhurst RJ. TGFbeta biology in cancer progression and immunotherapy. Nat Rev Clin Oncol. 2021;18(1):9–34. doi: 10.1038/s41571-020-0403-1. [DOI] [PMC free article] [PubMed] [Google Scholar]
- 37.Watanabe Y, Itoh S, Goto T, Ohnishi E, Inamitsu M, Itoh F, et al. TMEPAI, a transmembrane TGF-beta-inducible protein, sequesters Smad proteins from active participation in TGF-beta signaling. Mol Cell. 2010;37(1):123–134. doi: 10.1016/j.molcel.2009.10.028. [DOI] [PubMed] [Google Scholar]
- 38.Wang B, Zhong JL, Li HZ, Wu B, Sun DF, Jiang N, et al. Diagnostic and therapeutic values of PMEPA1 and its correlation with tumor immunity in pan-cancer. Life Sci. 2021;277:119452. doi: 10.1016/j.lfs.2021.119452. [DOI] [PubMed] [Google Scholar]
- 39.Zhang L, Wang X, Lai C, Zhang H, Lai M. PMEPA1 induces EMT via a non-canonical TGF-beta signalling in colorectal cancer. J Cell Mol Med. 2019;23(5):3603–3615. doi: 10.1111/jcmm.14261. [DOI] [PMC free article] [PubMed] [Google Scholar]
- 40.Hu Y, He K, Wang D, Yuan X, Liu Y, Ji H, et al. TMEPAI regulates EMT in lung cancer cells by modulating the ROS and IRS-1 signaling pathways. Carcinogenesis. 2013;34(8):1764–1772. doi: 10.1093/carcin/bgt132. [DOI] [PubMed] [Google Scholar]
- 41.Zhang T, Song X, Zhang Z, Mao Q, Xia W, Xu L, et al. Aberrant super-enhancer landscape reveals core transcriptional regulatory circuitry in lung adenocarcinoma. Oncogenesis. 2020;9(10):92. doi: 10.1038/s41389-020-00277-9. [DOI] [PMC free article] [PubMed] [Google Scholar]
- 42.Bassi DE, Mahloogi H, Al-Saleem L, De LopezCicco R, Ridge JA, Klein-Szanto AJ. Elevated furin expression in aggressive human head and neck tumors and tumor cell lines. Mol Carcinog. 2001;31(4):224–32. doi: 10.1002/mc.1057. [DOI] [PubMed] [Google Scholar]
- 43.Demidyuk IV, Shubin AV, Gasanov EV, Kurinov AM, Demkin VV, Vinogradova TV, et al. Alterations in gene expression of proprotein convertases in human lung cancer have a limited number of scenarios. PLoS One. 2013;8(2):e55752. doi: 10.1371/journal.pone.0055752. [DOI] [PMC free article] [PubMed] [Google Scholar]
- 44.Jaaks P, Bernasconi M. The proprotein convertase furin in tumour progression. Int J Cancer. 2017;141(4):654–663. doi: 10.1002/ijc.30714. [DOI] [PubMed] [Google Scholar]
- 45.Zhang W, Lin Y, Liu X, He X, Zhang Y, Fu W, et al. Prediction and prognostic significance of BCAR3 expression in patients with multiple myeloma. J Transl Med. 2018;16(1):363. doi: 10.1186/s12967-018-1728-8. [DOI] [PMC free article] [PubMed] [Google Scholar]
- 46.Guo J, Canaff L, Rajadurai CV, Fils-Aime N, Tian J, Dai M, et al. Breast cancer anti-estrogen resistance 3 inhibits transforming growth factor beta/Smad signaling and associates with favorable breast cancer disease outcomes. Breast Cancer Res. 2014;16(6):476. doi: 10.1186/s13058-014-0476-9. [DOI] [PMC free article] [PubMed] [Google Scholar]
- 47.Mishra VK, Subramaniam M, Kari V, Pitel KS, Baumgart SJ, Naylor RM, et al. Kruppel-like transcription factor KLF10 suppresses TGFbeta-induced epithelial-to-mesenchymal transition via a negative feedback mechanism. Cancer Res. 2017;77(9):2387–2400. doi: 10.1158/0008-5472.CAN-16-2589. [DOI] [PMC free article] [PubMed] [Google Scholar]
- 48.Yang L, Pang Y, Moses HL. TGF-beta and immune cells: an important regulatory axis in the tumor microenvironment and progression. Trends Immunol. 2010;31(6):220–227. doi: 10.1016/j.it.2010.04.002. [DOI] [PMC free article] [PubMed] [Google Scholar]
- 49.Zhang J, Shi Z, Xu X, Yu Z, Mi J. The influence of microenvironment on tumor immunotherapy. FEBS J. 2019;286(21):4160–4175. doi: 10.1111/febs.15028. [DOI] [PMC free article] [PubMed] [Google Scholar]
Associated Data
This section collects any data citations, data availability statements, or supplementary materials included in this article.
Supplementary Materials
Additional file 1: Supplementary Figure 1. Work flow chart.
Additional file 2: Supplementary Figure 2. Expression and prognosis of five genes. A: Differential expression distribution of five genes in cancer and adjacent samples. B-F: Prognostic K-M curve of high expression samples and low expression samples of 5 genes, The best cut-off value was obtained by maxstat to group the patients.
Additional file 3: Supplementary Table S1. Univariate Cox regression analysis of 54 TGFβ signaling-related genes.
Additional file 4: Supplementary Table S2. The genes identified by Pearson correlation analysis were significantly negatively correlated with risk score.
Data Availability Statement
The datasets generated during and/or analyzed during the current study are available in the [GSE31210] repository, [https://www.ncbi.nlm.nih.gov/geo/query/acc.cgi?acc=GSE31210]; in the [GSE30219] repository, [https://www.ncbi.nlm.nih.gov/geo/query/acc.cgi?acc=GSE30219]; in the [GSE50081] repository, [https://www.ncbi.nlm.nih.gov/geo/query/acc.cgi?acc=GSE50081]; in the [GSE13213] repository, [https://www.ncbi.nlm.nih.gov/geo/query/acc.cgi?acc=GSE13213]; in the [GSE19188] repository, [https://www.ncbi.nlm.nih.gov/geo/query/acc.cgi?acc=GSE19188]; in the [GSE41271] repository, [https://www.ncbi.nlm.nih.gov/geo/query/acc.cgi?acc=GSE41271]; in the [GSE31210] repository, [https://www.ncbi.nlm.nih.gov/geo/query/acc.cgi?acc=GSE31210]; in the [GSE30219] repository, [https://www.ncbi.nlm.nih.gov/geo/query/acc.cgi?acc=GSE30219]; in the [GSE50081] repository, [https://www.ncbi.nlm.nih.gov/geo/query/acc.cgi?acc=GSE50081]; in the [GSE13213] repository, [https://www.ncbi.nlm.nih.gov/geo/query/acc.cgi?acc=GSE13213]; in the [GSE19188] repository, [https://www.ncbi.nlm.nih.gov/geo/query/acc.cgi?acc=GSE19188]; and in the [GSE41271] repository, [https://www.ncbi.nlm.nih.gov/geo/query/acc.cgi?acc=GSE41271].


