

Abstract
Adoptive transfer of antigen-specific T cells represents a major advance in cancer immunotherapy, with robust clinical outcomes in some patients1. Both the number of transferred T cells and their differentiation state are critical determinants of effective responses2,3. T cells can be expanded with T cell receptor (TCR)-mediated stimulation and IL-2, but this can lead to differentiation into effector T cells4,5 and lower therapeutic efficacy6, whereas maintenance of a more stem-like state prior to adoptive transfer is beneficial7. Here, we show that H9T, an engineered IL-2 partial agonist, promoted T-cell expansion without driving terminal differentiation. H9T exhibited altered STAT5 signaling and mediated distinctive downstream transcriptional, epigenetic, and metabolic programs. H9T sustained expression of T cell transcription factor 1 (TCF-1) and promoted mitochondrial fitness, facilitating the maintenance of a stem cell-like state. Moreover, TCR transgenic and CAR-modified CD8+ T cells expanded with H9T displayed robust anti-tumor activity in vivo in models of melanoma and acute lymphoblastic leukemia. Thus, using engineered cytokine variants with distinctive properties is a promising strategy, with broad translational potential.
Interleukin-2 (IL-2), originally discovered as T cell growth factor, is experiencing a resurgence of interest in cancer immunotherapy8,9, but its broad actions can limit its effectiveness and cause toxicity10. IL-2 can promote the expansion of T cells, but it also drives terminal differentiation5 and induces expression of co-inhibitory receptors including TIM-3 and PD-111,12, which are hallmarks of T cell exhaustion in chronic viral infection and cancer13,14. Thus, harnessing desirable properties of IL-2 while minimizing detrimental ones are important immunotherapeutic goals.
H9T restricts CD8+ T-cell exhaustion
IL-2 signals via intermediate-affinity receptors comprising IL-2Rβ and IL-2Rγ (also known as the common cytokine receptor γ chain, γc) and high-affinity receptors that additionally contain IL-2Rα9. Previously, an IL-2 “superkine” (denoted H9) was generated that efficiently binds IL-2Rβ and signals even in the absence of IL-2Rα15. H9-based antagonists of IL-2 and IL-15 were also generated by introducing mutations at the H9-IL-2Rγ interface16. Here we focus on H9T, a partial agonist with a single mutation (glutamine-126 to threonine) in H9 at the H9-IL-2Rγ interface (Fig. 1a)16–18 that reduced binding to IL-2Rγ (Fig. 1b) and phosphorylation of STAT5 but not of ERK (Extended Data Fig. 1a–c)16,18. H9T could expand activated mouse CD8+ T cells to a similar extent as IL-2 and H9, although a higher H9T concentration was required for maximal proliferation (Fig. 1c, d). Interestingly, in contrast to IL-2 and H9, H9T induced much less TIM-3 even after long-term culture (Fig. 1e–g, Extended Data Fig. 1d, e) and similarly for other exhaustion markers, including PD-1, LAG-3, and 2B4 (Fig. 1h–j, Extended Data Fig. 1f–h). H9T also promoted CD62L expression (Extended Data Fig. 2a, b), consistent with a stem cell-like phenotype, while subsequently culturing with IL-2 decreased CD62L expression (Extended Data Fig. 2c).
Fig. 1. Differential effects of H9T versus IL-2 and H9 on CD8+ T cells.

a, IL-2/IL-2R diagram showing the mutations to generate H9T. b, Binding of H9-IL-2Rβ and H9T-IL-2Rβ complexes to IL-2Rγ, analyzed by surface plasmon resonance (see Methods). c, d, Proliferation of preactivated CD8+ T cells expanded with 10 nM IL-2, H9, or H9T, n= 8 mice (c) or with a range of concentrations of these cytokines for 8 days, n= 3 mice (d). e-f, CD8+ T cells were treated as in panel c to assess TIM-3 expression (e, n= 4 mice), or treated as in panel d (f, n= 3 mice). g-j, Expression of TIM-3 (g), PD-1 (h), LAG-3 (i), and 2B4 (j) on CD8+ T cells treated with 10 nM of each cytokine for 8 days. One-way ANOVA test with Dunnett’s correction. g, h, j, n= 3 mice; i, n= 6 mice. k-n, pmel-1 CD8+ T cells were expanded as in panel g and stimulated with 100 nM gp100 or control peptide for 1 hour followed with for 5 μg/ml Brefeldin A for 6 h intracellular staining of IFN-γ (k), TNF-α (l), IL-2 (m), and IL-10 (n). o, Cells were treated as in panel m but stained for TIM-3 and IL-2. p, Pre-activated CD8+ T cells were expanded as in panel g, and analyzed by western blotting (on the same gel). Uncropped gel in Supplementary Fig. 1a. Data are mean +/− SEM (c-j). Data are from two (c, d, k-n, p), three (e-j), or four (o) independent experiments.
Because of H9T’s distinctive effects on exhaustion markers, we next examined its effect on cytokine production. As compared to IL-2 or H9, H9T-expanded pmel-1 CD8+ T cells produced less intracellular IFN-γ in response to antigen (gp10025-33 peptide) stimulation but similar levels of TNF-α (Fig. 1k, l, Extended Data Fig. 2d, e). Moreover, H9T-expanded cells produced more IL-2 (Fig. 1m, Extended Data Fig. 2f), a cytokine produced by early differentiated, stem cell-like CD8+ T cells19, but less IL-10 (Fig. 1n, Extended Data Fig. 2g), which is associated with T-cell exhaustion13,20. IL-2 production inversely correlated with TIM-3 expression (Fig. 1o), consistent with findings in tumor infiltrating T cells14. Moreover, effector molecules perforin and granzyme B were only minimally expressed by H9T-expanded cells (Fig. 1p).
H9T modulates CD8+ T-cell transcription
RNA-seq analysis revealed major differences in CD8+ T cells cultured with H9T versus IL-2 or H9 (Fig. 2a, Supplementary Table 1), with 80 genes up-regulated and 219 genes down-regulated at day 6 by H9T versus IL-2 (Fig. 2b, Extended Data Fig. 3a, Supplementary Table 2) and similar findings for H9T versus H9 (Extended Data Fig. 3b, c, Supplementary Table 3). IL-2 and H9, but not H9T, induced genes encoding immune checkpoints, including Havcr2, Cd244, Lag3, and Prdm1, and effector molecules including Prf1, Gzmb, and Il10 (Fig. 2c). In contrast, H9T-cultured cells had higher expression of Ccr7, Cxcr3, and Cd27, characteristic of stem cell-like CD8+ T cells19, and of transcription factor Tcf7, a marker of T-cell stemness21 (Fig. 2c). Gene Set Enrichment Analysis (GSEA) indicated that the transcriptional pattern induced by H9T was similar to that of “stem-cell memory” CD8+ T cells generated in vivo (Fig. 2d, Extended Data Fig. 3d). We confirmed higher TCF-1 and CXCR3 but lower BLIMP1 expression in cells treated with H9T compared to IL-2 or H9 (Fig. 2e–g, Extended Data Fig. 3e–g). Importantly, based on experiments using Tcf7 conditional knock-out mice, TCF-1 was required for higher CD62L expression in H9T-expanded cells (Extended Data Fig. 3h), and TIM-3 expression was increased in Tcf7-deficient cells (Extended Data Fig. 3i).
Fig. 2. Transcriptional profile and epigenetic landscape of H9T-expanded CD8+ T cells.

a-d, RNA-seq analysis of IL-2-, H9-, or H9T-expanded CD8+ T cells. PCA analysis (a), differentially expressed genes (b), heat map of selected genes (c), and GSEA (d) with Kolmogorov-Smirnov test are shown. e-g, Level of TCF-1, CXCR3, and BLIMP1 protein on IL-2-, H9-, or H9T-expanded CD8+ T cells, n= 3 mice. Data are mean +/− SEM, one-way ANOVA test with Dunnett’s correction. h-j, PCA of ATAC-seq (h); ATAC-seq at the Tcf7 (i) or Havcr2 (j) loci are shown. Data are from two (a-d, h-j) or three (e-g) independent repeats.
To bettern understand the transcriptomic differences, we next performed ATAC-seq, which revealed distinctive chromatin accessibility patterns at the Tcf7 and Havcr2 loci in cells cultured with H9T as compared to IL-2 or H9 (Fig. 2h–j, Supplementary Table 4), correlating with the RNA-seq data (Extended Data Fig. 3j). Interestingly, our ATAC-seq chromatin accessibility data from H9T-expanded cells more closely resembled in vivo generated memory populations22 at the Havcr2 gene, with lower peaks in cells stimulated with H9T than IL-2 and H9, and at the Il10 locus, where the most upstream ATAC-seq peak found in exhausted cells was absent only with H9T (Extended Data Fig. 3k, l).
H9T reprograms CD8+ T-cell metabolism
Besides distinctive transcriptional and epigenetic profiles and production of effector molecules, effector CD8+ T-cell differentiation is characterized by metabolic reprogramming with augmented glycolysis 23,24. Interestingly, the medium color for H9T-expanded CD8+ T cells indicated a higher pH and reduced glycolysis (Extended Data Fig. 4a). Metabolomics analysis for H9T was distinctive (Fig. 3a, b, Supplementary Table 5, 6), with lower glucose and lactate levels (Extended Data Fig. 4b, c). Moreover, as opposed to IL-2 or H9, H9T-stimulated CD8+ T cells had lower basal extracellular acidification rate (ECAR) (Fig. 3c), glucose uptake (Fig. 3d, Extended Data Fig. 4d), mRNA expression of glucose transporters Slc2a1 and Slc2a3 (Fig. 3e, f), and mitochondrial membrane potential (ΔΨm) based on tetramethylrhodamine (TMRM) staining (Fig. 3g, Extended Data Fig. 4e), but higher spare respiratory capacity (SRC)(Fig. 3h, i), indicative of enhanced mitochondrial fitness25. Inhibiting glycolysis with 2-deoxyglucose (2-DG) increased expression of TCF-1 and CD62L (Fig. 3j, k, Extended Data Fig. 4f, g), indicating that restricting glycolysis promoted T-cell stemness24. Interestingly, 2-DG impaired STAT5 phosphorylation (Fig. 3l, Extended Data Fig. 4h), indicating crosstalk between STAT5 signaling and metabolism. RNA-seq analysis further confirmed that inhibiting glycolysis suppressed T-cell exhaustion related genes and promoted stemness (Fig. 3m, n, Extended Data Fig. 4i, Supplementary Table 7), collectively indicating that lower glycolysis contributed to the stemness phenotype observed with H9T.
Fig. 3. Altered metabolism in H9T-expanded CD8+ T cells.

a-b, Heat map (a) and PCA (b) analysis of metabolomic data prepared with 8 day expanded CD8+ T cells (see Methods). c, Seahorse-based ECAR analysis, n= 7 mice, one-way ANOVA test with Dunnett’s correction. Shown is mean +/− SEM. d, 2-NBDG uptake assay prepared with 8 day expanded CD8+ T cells. e-f, qPCR analysis of Slc2a1 (e) and Slc2a3 (f) expression. g, TMRM assay showing mitochondrial membrane potential. h, Seahorse-based mitochondrial stress test , n= 3 mice, data are mean +/− SEM. i, Spare respiratory capacity, n= 7 mice. One-way ANOVA test with Dunnett’s correction, data are mean +/− SEM. j-l, Level of TCF-1, CD62L and pSTAT5 after 2 day 2-DG treatment. m-n, RNA-seq analysis (3 biological replicates) of 2-DG treated CD8+ T cells (m) and GSEA of PBS versus 2-DG treated cells (n), Kolmogorov-Smirnov test. Data are from two (a-g, j-l) or four (h-i) independent experiments.
H9T induces distinctive STAT5 signaling
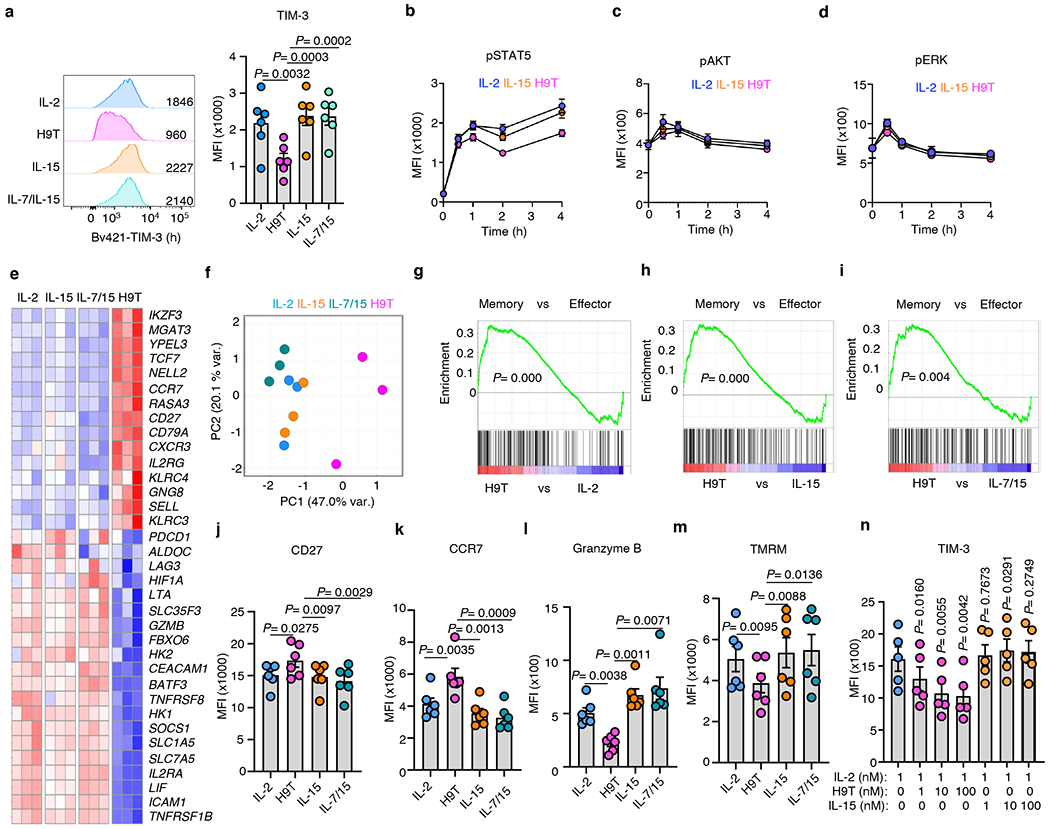
Several other γc family cytokines (IL-15, IL-15+IL-7, and IL-21) can also induce memory-cell like phenotypes in mouse CD8+ T cells25–27. However, neither IL-7 nor IL-21 alone sustained cell expansion comparable to IL-2 or H9T in mouse or human CD8+ T cells (Extended Data Fig. 5a, b). Interestingly, in mouse CD8+ T cells, like H9T, both IL-15 and IL-7+IL-15 treatment resulted in lower TIM-3 and pSTAT5 compared to IL-2 (Extended Data Fig. 5c, d), but no substantial differences were observed for pAKT or pERK (Extended Data Fig. 5e, f). RNA-seq profiling confirmed that the IL-2 transcriptomic pattern was distinct from those observed with H9T, IL-15, or IL-7+IL-15 (Extended Data Fig. 5g, h, Supplementary Table 8).
In contrast to our findings in mouse cells, in human CD8+ T cells, only H9T resulted in lower TIM-3 expression (Extended Data Fig. 6a). H9T also induced lower pSTAT5 compared to IL-2, IL-15, and IL-7+IL-15 (Extended Data Fig. 6b), but similar levels of pAKT and pERK compared to IL-2 or IL-15 (Extended Data Fig. 6c, d). GSEA showed that H9T-treated human CD8+ T cells had distinctive gene signatures and were more memory-like (Extended Data Fig. 6e–i, Supplementary Table 9), consistent with modestly higher CD27 and CCR7 but lower granzyme B and ΔΨm (Extended Data Fig. 6j–m). Interestingly, H9T but not IL-15 suppressed TIM-3 expression even in the presence of IL-2 (Extended Data Fig. 6n), suggesting that H9T can promote T-cell stemness in both human and mouse CD8+ T cells, and this was associated with lower pSTAT5 induction. H9T induced less TIM-3 and Granzyme B (Extended Data Fig. 7a, b) than did IL-2 or IL-15 over a range of doses but still sustained cell proliferation, indicating that H9T has distinctive properties from these natural cytokines (Extended Data Fig. 7c). Culturing human CD8+ T cells at 1 nM H9T also resulted in higher TCF7 and CD27 but lower SLC2A1 mRNA expression as compared to IL-2 and IL-15 (Extended Data Fig. 7d–f). We also assessed the effect of H9T on human CD4+ T cells and found that it maintained lower mitochrondrial membrane potential and TIM-3 expression but higher CCR7 and CD27 expression on these cells as well (Extended Data Fig. 8a–d).
STAT5 mediates CD8+ T-cell exhaustion
To further explore the role of STAT5 related to CD8+ T-cell exhaustion, we analyzed previously generated ChIP-seq data and found that both STAT5A and STAT5B bound to the Havcr2 locus in mouse T cells (Extended Data Fig. 9a). Correspondingly, TIM-3 expression was lower in Stat5a and Stat5b knock-out mice than in wild-type controls (Extended Data Fig. 9b, c). We observed weaker STAT5 binding at the HAVCR2 locus in human CD8+ T cells stimulated with H9T compared to IL-2 (Extended Data Fig. 9d). Binding of STAT5 at other memory/effector or glycolysis-related gene loci, including GZMB, TCF7, CCR7, SLC2A1, and SLC2A3, was also less strongly induced by H9T (Extended Data Fig. 9d). STAT5A-1*6, a constitutively-active mutant of STAT5A28, strongly increased pSTAT5 but only modestly affected pAKT (Extended Data Fig. 9e, f). STAT5A-1*6 augmented TIM-3 but lowered TCF-1 expression (Extended Data Fig. 9g, h), and RNA-seq analysis showed STAT5A-1*6 promoted T-cell differentiation toward effector and exhaustion states, with upregulation of genes encoding cytotoxic molecules (Gzma, Gzmb and Prf1), exhaustion markers (Havcr2, Pdcd1, Lag3, Ctla4), and glycolytic enzymes (Eno1, Ldha, Pgk1, and Pkm)(Extended Data Fig. 9i, j, Supplementary Table 10). GSEA showed that STAT5A-1*6 promoted IL-2-STAT5 rather than PI3K-AKT-MTOR signaling and induced T-cell exhaustion (Extended Data Fig. 9k–m). Moreover, by ATAC-seq, as compared to H9T-expanded cells, H9T/STAT5A-1*6 cells clustered closer to IL-2 and H9, with altered chromatin accessibility (Supplementary Table 11, Extended Data Fig. 9n–p), further suggesting that hyperactive STAT5 signaling can induce T-cell exhaustion and that STAT5 signaling contributes to the differences between IL-2 and H9T.
H9T enhances CD8+ T-cell anti-tumor activity
Because H9T maintained T cells in a more stem cell-like state that favors engraftment, expansion, and anti-tumor efficacy in adoptive immunotherapy7, we investigated whether H9T enhanced CD8+ T-cell survival and accumulation after transfer. Indeed, in wild type mice not implanted with tumor, there was greater persistence of CD8+ T-cells expanded with H9T as compared to IL-2 or H9 (Fig. 4a–c). In melanoma-bearing mice, H9T-expanded cells infiltrated better than IL-2-expanded cells in tumor and draining lymph nodes (Fig. 4d–f). Importantly, mice adoptively transferred with H9T-expanded pmel-1 CD8+ T cells showed greater B16 melanoma clearance than cells expanded with IL-2 or H9 (Fig. 4g, h, Extended Data Fig. 10a), with improved survival and elimination of tumors only in animals receiving H9T-expanded cells (Fig. 4i, j). Transferred H9T-expanded cells persisted long-term after tumor clearance (Extended Data Fig. 10b), protecting mice from a second tumor challenge (Fig. 4k). Moreover, H9T-expanded cells could eliminate tumor without IL-2 administration after cell transfer (Extended Data Fig. 10c, d).
Fig. 4. Augmented anti-tumor activity of H9T-expanded CD8+ T cells.

a-c, Splenocytes from mice receiving cytokine-expanded CD8+ T cells were analyzed for persistence of donor cells after transfer. n= 5 mice, Shown is mean +/− SEM, one-way ANOVA test with Dunnett’s correction. d-f, CD45.1+ or CD90.1+ pmel-1 CD8+ T cells were expanded with IL-2 or H9T separately for 8 days, mixed at a 1:1 ratio, transferred into B16KVP tumor bearing mice, and infiltration efficacy assessed. n = 4 mice, shown is mean +/− SEM with two-sided t-test. g-j, Expanded pmel-1 CD8+ T cells were transferred to treat B16KVP tumor-bearing mice (g). Representative measured tumor area (h) is shown, n= 5 mice with two-sided t-test (day 27). Mouse survival analyzed with Log-rank test (i) and percentage of cured mice from 3 independent repeats were assessed (j); shown are mean +/− SEM with two-sided t-test. k, Wild-type mice (1st challenge, n= 10 mice) or cured mice (as in j) (2nd challenge, n= 7 mice) were inoculated with B16KVP melanoma tumor. Tumor size was measured one week later, shown are mean +/− SEM with two-sided t-test. l, Phenotype of pmel-1 cells 7 days after transfer. m-n, CD8+ T cells with or without chimeric anti-CD19 receptor transduction were expanded with IL-2, H9 or H9T for 8 days and transferred into E2a-PBX leukemia-bearing mice for survival analysis. n= 5 mice with Log-rank test. Data are from two (a-f, k, m-n), three (g-j, l) independent experiments.
While H9T-expanded pmel-1 CD8+ T cells expressed similar exhaustion marker levels in the tumor niche to cells expanded with IL-2, they were less exhausted in the draining lymph nodes, with a higher percentage of PD-1−TIM-3− cells (Fig. 4l, Extended Data Fig. 10e–j), suggesting that H9T-treated cells partially maintained stemness after adoptive transfer. RNA-seq analysis of pmel-1 cells isolated from lymph nodes showed that H9T-expanded cells expressed a more memory-like signature with lower Pdcd1 and Tox29, with lower exhaustion as confirmed by GSEA (Extended Data Fig. 10k–m, Supplementary Table 12), helping to explain the augmented anti-tumor activity of these cells. We also used an anti-CD19 CAR-T model targeting syngeneic B-cell acute lymphoblastic leukemia (ALL)(Fig. 4m). H9T-expanded CD8+ CAR-T cells exhibited greater anti-tumor capacity than cells expanded with IL-2 or H9 (Fig. 4n).
In summary, we have characterized H9T, an IL-2 partial agonist that helps to maintain activated CD8+ T cells in a stem cell-like status, with greater anti-tumor activity. By modulating the signals induced by IL-2, we provide evidence of distinctive properties for H9T as an engineered cytokine that could support T cell proliferation while limiting glycolysis and exhaustion. More broadly, these findings underscore the ability to engineer new cytokine variants with distinctive properties and translational potential.
Methods
Mice and cell lines
All animal experiments were performed with the approval of the NHLBI and NCI Animal Care and Use Committees and housed in pathogen-free mouse facilities. B6 (C57BL/6J), CD45.1 (B6.SJL-PtprcaPepcb/BoyJ), pmel-1 (B6.Cg-Thy1a/Cy Tg(TcraTcrb)8Rest/J), CD4Cre (B6.Cg-Tg(Cd4-cre)1Cwi/BfluJ) and Tcf7GFP flox (B6(Cg)-Tcf7tm1Hhx/J)30 were obtained from Jackson Laboratory. Stat5a−/−31 and Stat5b−/−32 mice were provided by Drs. Alejandro Villarino and John O’Shea, NIAMS. pmel-1 CD45.1 mice were obtained by crossing pmel-1 mice with CD45.1 mice. B16(H-2Db) mouse melanoma was transduced to express mouse gp100 containing human residues 25-27 (EGS to KVP), as previously reported33,34. Cells were maintained in DMEM medium containing 10% FBS, 1% glutamine, and 1% penicillin-streptomycin (ThermoFisher).
Protein production
The human IL-2 cDNA coding region was cloned into the pAcGP67-A vector with a C-terminal 8x HIS tag. L80F, R81D, L85V, I86V, and I92F on IL-2 helix C were mutated to generate H9 and Q126T in helix D was additionally mutated to generate H9T15,16. Mouse serum albumin (MSA) was inserted at the N-terminus to generate a plasmid encoding MSA-IL-2 fusion protein, which augments its half-life in vivo35,36. Mutagenesis was performed using the In-Fusion HD Cloning Plus (Takara, #638910). Baculovirus was produced by transfection of Spodotera frugiperda (Sf9) insect cells with Cellfectin II (Gibco) and Sapphire Baculovirus DNA (Allele) followed by viral amplification in Sf9. High titer virus was used to infect Trichopulsia ni (High-Five) cells (Invitrogen). The supernatant was clarified by filtration using either 0.22 or 0.45 micron filters, and secreted MSA-IL-2, MSA-H9, and MSA-H9T protein was bound to a Ni-NTA affinity column (Marvelgent), eluted with 150 mM imidazole, and subjected to gel filtration chromatography using a Superdex-200 column (GE Healthcare). Endotoxin was removed (VivaProducts, GEN-NoE12HC) and confirmed with Pierce LAL Chromogenic Endotoxin Quantification Kit (ThermoFisher). For binding studies, the extracellular domains of IL2Rβ (amino acids 27-240) and γc (amino acids 23-254) fused to a C-terminal biotin acceptor peptide (N-GLNDIFEAQKIEWHE-C) were cloned into the pAcGP67-A vector with an N-terminal gp67 signal peptide and a C-terminal 6xHis tag. IL-2Rβ was purified from supernatant by NiNTA affinity chromatography followed by size exclusion chromatography (SEC) using Superdex-200 column. For biotinylation, human γc was expressed, purified by Ni-NTA affinity chromatography, and incubated with soluble BirA ligase in buffer containing 0.5 mM Bicine (pH 8.3), 100 mM ATP, 100mM magnesium acetate and 500 μM biotin overnight at 4°C. Biotinylated γc was purified by SEC as described above.
Surface Plasmon Resonance
Interactions between IL-2 muteins and γc were assessed by surface plasmon resonance (SPR) on a BIAcore T100 instrument. Biotinylated human γc was immobilized on a SA sensor chip (GE) at low density (< 150 RU). To facilitate measurement of complex assembly, IL-2 muteins were precomplexed with equimolar human IL-2Rβ. Pre-complexed IL-2Rβ and IL-2 were flowed over the coated sensor chip at 1μM. Specific interaction was determined by subtracting from the traces the background binding to an unrelated biotinylated protein immobilized in the reference channel.
B16 tumor model and adoptive cell transfer immunotherapy
B16 tumor models was previously described33. 0.5 million B16KVP melanoma cells were subcutaneously injected into C57BL/6 mice. Ten days later, mice were sub-lethally irradiated (600 cGy), randomized, and injected intravenously with 10 million, 8 day IL-2, H9 or H9T expanded pmel-1 CD45.1 (Ly5.1) cells and then injected i.p. with clinical grade IL-2 (180,000 IU; Proleukin, Chiron Corporation) daily for three days unless specified. In certain experiments, irradiation or i.p. administration of IL-2 was omitted in order to compare the effects of H9T under different conditions. Tumor area was measured every 2 or 3 days by an independent investigator in a double-blinded fashion and calculated as length × width. Mice with tumors approaching 400 mm2 were defined as being at the endpoint and euthanized. Accordingly, we did not include the average tumor size once animals had been euthanized as it could be misleading. To analyze the persistence of expanded CD8+ T cells, 3 million IL-2, H9 or H9T expanded pmel-1 CD45.1+ CD8+ T cells were adoptive transferred into C57BL/6 mice. One week later, mice were euthanized, splenocytes isolated and donor cells identified by gating on cells expressing Vβ13 and CD45.1.
Murine leukemia model and CAR-T therapy
The E2a-PBX mouse pre-B acute lymphocytic leukemia model and related CD19 CAR-T immunotherapy was previously reported37–39. Briefly, mice were injected i.v. with 106 CD19+ E2a-PBX leukemia cells. Three days later, tumor-bearing mice were irradiated (500 cGy), and the next day the indicated number of anti-CD19 CAR-transduced or control non-transduced T cells were adoptively transferred into the mice, and survival of mice was recorded in a double-blinded fashion.
Primary cell isolation, activation, culture, and retroviral transduction
Mouse CD8+ T lymphocytes were isolated using the EasySep Mouse CD8+ T cell isolation kit (STEMCELL #19853) and cultured in RPMI-1640 medium (ATCC) supplemented with 10% FBS and 50 μM β-mercaptoethanol. Purified cells were activated using plate-bound anti-CD3 (2 μg/ml) plus soluble anti-CD28 (1 μg/ml) monoclonal antibodies for two days. For human CD8+ T cells related assays, naïve CD8+ T cells were isolated with EasySep™ Human Naïve CD8+ T Cell Isolation Kit II (STEMCELL, #17968), and activated with Dynabeads Human T-Activator CD3/CD28 (Thermo Fisher Scientific, #111.31D) for two days, and cells were isolated by a magnet per the manufacturer’s protocol. After resting overnight in the absence of cytokine, cells were washed and cultured with 1 μg/ml MSA conjugated IL-2, H9 or H9T (unless otherwise specified). For comparing H9T with natural cytokines, mouse or human CD8+ T cells were expanded with 10 nM human IL-2, IL-15, IL-7, IL-21, IL-7 + IL-15, or H9T. Cells were split 1:2 or 1:3 fold and supplied with fresh cytokine every day as previously described40. T cell transduction of anti-CD19 CAR (MSCV-1D3-28Z) was performed as previously described39,41. Briefly, 24 h after TCR stimulation, CD8+ T cells were spin-transduced with retroviral supernatant in the presence of plate-coated Retronectin (Takara) and 1 μg/ml of MSA-conjugated IL-2, H9, or H9T. Transduction was repeated the next day, and cells were expanded with cytokines for 6 additional days before being collected for adoptive transfer. For STAT5A-1*6 related experiments, preactivated mouse CD8+ T cells were transduced with retroviral plasmids expressing STAT5-1*6-GFP or empty vector with GFP (EV) and three days later, GFP+ cells were sorted and cultured with 10 nM H9T for an additional 4 days followed by the indicated analysis. For 2-Deoxy-D-glucose (2-DG) related assays, preactivated mouse CD8+ T cells were rested overnight and stimulated with 10 nM IL-2 with or without 1 mM 2-DG for 2 days followed by the indicated assays.
Metabolic assays
Seahorse assays were performed as described42,43. Mouse CD8+ T cells were loaded to Seahorse assay plates precoated with Cell-Tak (Corning) and centrifuged at 400 x g at room temperature for 5 min. Seahorse medium was added to the cells and incubated for 30 min before loading to Seahorse XFe96 Analyzer. After calibration, metabolic profiles were analyzed by injection of oligomycin (1 μM), carbonyl cyanide-4-(trifluoromethoxy) phenylhydrazone (FCCP, 1.5 μM), and rotenone (10 mM) plus antimycin A (5 mM). Spare respiratory capacity (SRC) was calculated by subtracting the basal OCR from the maximal OCR level. Glucose uptake analysis were performed as previously described 24 using the Glucose Update Cell-Based Assay Kit (Cayman). In brief, cells were washed three times, resuspended in Glucose free 1640 medium (Gibco) with 10% FBS and 100 μg/ml 2-(N-(7-Nitrobenz-2-oxa-1,3-diazol-4-yl)Amino)-2-Deoxyglucose (2-NBDG), cultured for 2 h, washed three times, and analyzed by flow cytometry.
Mitochondrial membrane potential was analyzed as previously described44 using tetramethylrhodamine methyl ester (TMRM) per instructions from ThermoFisher. Cells were washed three times, cultured in RPMI 1640 medium containing 20 nM TMRM for 30 min, washed three more times, and analyzed by flow cytometry.
Targeted metabolite analysis with LC-MS/MS
Targeted metabolite analysis was performed with liquid-chromatography tandem mass spectrometry (LC-MS/MS). Metabolites from cells or snap-frozen xenograft tumor tissue were extracted with 80% (v/v) methanol solution equilibrated at –80 °C, and the metabolite-containing supernatants were dried under nitrogen gas. Dried samples were re-suspended in 50% (v/v) acetonitrile solution and 4 μl of each sample was injected and analyzed on a 5500 QTRAP triple quadrupole mass spectrometer (AB Sciex) coupled to a Prominence ultra-fast liquid chromatography (UFLC) system (Shimadzu). The instrument was operated in selected reaction monitoring (SRM) with positive and negative ion-switching mode as described. This targeted metabolomics method allows for analysis of more than 200 metabolites from a single 25-min LC-MS acquisition with a 3-ms dwell time, and these analyzed metabolites cover all major metabolic pathways. The optimized MS parameters were: ESI voltage was +5,000V in positive ion mode and −4,500V in negative ion mode; dwell time was 3 ms per SRM transition and the total cycle time was 1.57 seconds. Hydrophilic interaction chromatography (HILIC) separations were performed on a Shimadzu UFLC system using an amide column (Waters XBridge BEH Amide, 2.1 × 150 mm, 2.5μm). The LC parameters were as follows: column temperature, 40 °C; flow rate, 0.30 ml/min. Solvent A, Water with 0.1% formic acid; Solvent B, Acetonitrile with 0.1% formic acid; A non-linear gradient from 99% B to 45% B in 25 minutes with 5min of post-run time. Peak integration for each targeted metabolite in SRM transition was processed with MultiQuant software (v2.1, AB Sciex). The preprocessed data with integrated peak areas were exported from MultiQuant and re-imported into Metaboanalyst software for further data analysis.
RNA-seq library preparation and sequencing
RNA was extracted using the Zymo RNA miniprep kit (Zymo Research), and 500 ng RNA was used for RNA-Seq library preparation with the Kapa mRNA HyperPrep Kit (KK8580, Kapa Biosystems) and indexed with NEXTflex DNA Barcodes-24, as previously reported45. After the final amplification, samples were loaded onto 2% E-Gel pre-cast gels (ThermoFisher), and 250 to 400 bp DNA fragments were recovered and purified with Zymoclean Gel DNA Recovery Kit (Zymo Research). After quantification by Qubit (Invitrogen), barcoded samples were mixed and sequenced on an Illumina Hi Seq3000 system. For RNA-seq using cells isolated from lymph nodes, CD90.1+ CD8 + cells were sorted and cell libraries were prepared with SMART-Seq Ultra low Input RNA kit (Takara, #634889).
ChIP-seq library preparation and sequencing
ChIP-seq libraries were prepared as previously described46. Briefly, 10 million CD8+ T cells were fixed with 1% formaldehyde at 37 °C for 10 min, sonicated, and fragmented chromatin was immunoprecipitated with anti-STAT5B or anti-H3K27ac antibodies that were coupled to Magna ChIP protein A/G magnetic beads (EMD Millipore, 16-663). ChIP-seq DNA libraries were prepared with the KAPA LTP Library Preparation Kit and barcoded with NEXTflex DNA barcodes, quantified, and sequenced on an Illumina HiSeq 3000 system.
ATAC-seq library preparation and sequencing
ATAC-seq libraries were prepared as previously described47. In brief, 50,000 cells were lysed in cold lysis buffer (10 mM Tris-HCl, pH 7.4, 10 mM NaCl, 3 mM MgCl2, 0.1% NP-40). Nuclei were then used for the transposition reaction with the Nextera DNA Library Preparation kit at 37°C for 30 min. DNA was purified with the Zymo DNA recovery kit. After amplification and barcoding, DNA was purified (e.g., from dNTPs, salts, primers, and primer dimers) with Agencourt AMPure XP (Beckman Coulter), quantified, and then sequenced on an Illumina HiSeq 3000 system.
Bioinformatics analyses
Sequenced reads (50 bp, single end) were obtained with the Illumina CASAVA pipeline and mapped to the mouse genome mm10 (GRCm38, Dec. 2011) using Bowtie 2.2.648 and Tophat 2.2.149. Only uniquely mapped reads were retained. The mapped outputs were converted to browser-extensible data files, which were then converted to binary tiled data files (TDFs) using IGVTools 2.4.1350 for viewing on the IGV browser (http://www.broadinstitute.org/igv/home). TDFs represent the average alignment or feature density for a specified window size across the genome. For ChIP-seq data, reads were mapped into non-overlapping 20 bp windows for transcription factors STAT5A and STAT5B. The reads were shifted 100 bp from their 5′ starts to represent the center of the DNA fragment associated with the reads. For RNA-seq data, raw counts that fell on exons of each gene were calculated and normalized by using RPKM (Reads Per Kilobase per Million mapped reads). Differentially expressed genes were identified with the R Bioconductor package “edgeR”51, and expression heat maps were generated with the R package “pheatmap”. For GSEA analysis, RNA-seq based gene expression data were compared with molecular signature gene sets using GSEA (v4.1)19,52–54. Previously published ATAC-seq data22 (https://www.ncbi.nlm.nih.gov/geo/query/acc.cgi?acc=GSE88987) for exhausted, effector, and memory populations were downloaded and compared to our ATAC-seq data.
Flow cytometric analysis
PBS containing 1% BSA, 1 mM EDTA, and 0.1% sodium azide (FACS buffer) was used for surface staining with fluorescent conjugated antibodies. For intracellular staining of phospho-specific antibodies, cells were pre-stained using the Live/Dead Fixable Dead Cell stain kit (ThermoFisher Scientific) according to the manufacturer’s instructions. Cells were then fixed with 1.5% PFA for 10 min at room temperature, centrifuged, thoroughly resuspended in pre-chilled methanol, and incubated for 20 min at 4°C for permeabilization. Cells were washed twice with FACS buffer and then stained with phospho-specific antibodies. For intracellular cytokine staining, cells were stimulated with 100 nM human gp100 peptide (25-33) or influenza A NP (366-374) as a control for 1 h, followed by the addition of 5 μg/ml Brefeldin A for 6 h. Cells were then pre-stained using the Live/Dead Fixable Dead Cell stain kit (ThermoFisher) and for surface markers. After the last wash, cells were fixed, permeabilized, and stained using the eBioscience Intracellular Fixation and permeabilization buffer set (ThermoFisher) according to the manufacturer’s instructions. For intracellular staining of transcription factors, cells were pre-stained with Live/Dead Fixable Dead Cell stain kit (ThermoFisher) and then fixed and stained using the eBioscience Foxp3/Transcription Factor Staining Buffer Set (ThermoFisher). Representative gating strategies are provided in Supplementary Figure 2.
Immunoprecipitation
To conjugate antibody to protein G dynabeads, 5 μg of STAT5A antibody (Santa Cruz, sc-166479) or STAT5B antibody (Invitrogen, 13-5300) was incubated with 50 μL of Protein G dynabeads (Invitrogen, 10003D) for 1 hour at room temperature. Beads were then washed three times with RIPA lysis buffer (sc-24948, Santa Cruz). Preactivated mouse CD8+ T cells were rested overnight and stimulated with 10 nM of IL-2 or H9T for 20 min and then lysed in RIPA lysis buffer on ice for 30 min and spun at 13,000 rpm for 20 minutes. The supernatant was incubated with the antibody-conjugated dynabeads over-night at 4 °C. The dynabeads were then washed three times with RIPA buffer and then Protein Sample Loading Buffer (Li-COR Biosciences) was added before incubating for 5 min at 95°C.
Western blotting
After washing with PBS, whole cell lysates were prepared with RIPA buffer, Protein Sample Loading Buffer (Li-COR Biosciences) was added, and samples were incubated for 5 min at 95°C. Samples were loaded onto NuPAGE Bis-Tris Gels for SDS-PAGE (ThermoFisher). After transfer onto Immobilon-FL PVDF Membranes (Millipore Sigma) using NuPAGE transfer buffer (ThermoFisher), membranes were blocked in PBS containing 5% BSA and then incubated with primary antibody and fluorescent-conjugated secondary antibodies. The image data were acquired with an Odyssey CLx system (LI-COR) and processed with ImageStudio (LI-COR).
Antibodies and chemicals
For flow cytometric analysis, anti-TIM-3 (RMT3-23, 1:100), anti-CXCR3 (CXCR3-173, 1:100), anti-2B4 (m2B4(b6)458.1, 1:100), anti-LAG3 (C987W, 1:100), anti-PD1(29F.1A12, 1:100), anti-CD44 (IM7, 1:100), anti-CD45.1 (A20, 1:100), anti-CD62L (MEL-14, 1:100), anti-CD8a (53-6.7, 1:100), anti-CD90.1 (OX7, 1:1000), anti-IFNγ (XMG1.2, 1:1000), anti-IL-10 (JES5-16E3, 1:50), anti-IL-2 (JES-5H4, 1:200), anti-TNFα (MP6-XT22, 1:1000), anti-vβ13 (MR12-4, 1:100), anti-human CCR7 (G043H7, 1:100), anti-CD27 (LG.3A10, 1:100), anti-human TIM-3 (F38-2E2), anti-human Granzyme B (GB12, 1:100) and anti-BLIMP1 (5E7, 1:100) were from Biolegend and used at the dilutions shown in parentheses. Anti-STAT5-pY694 (47/STAT5, 1:50), anti-AKT-pS473 (M89-61, 1:20) and anti-ERK-pT202/pY204 (20A, 1:20) were from BD Bioscience. Anti-TCF-1 antibody (C63D9, 1:100) was from Cell Signaling.
For immunoprecipitation, anti-STAT5A (Sc-166479) was from Santa Cruz, and anti-STAT5B (#13-530) was from Invitrogen.
For western blotting analysis, anti-Granzyme B (#674301) was from BioLegend; anti-Perforin (#3693S, 1:1000), anti-H3 (#14269, 1:1000), anti-STAT5-pY694 (#9351, 1:1000), anti-STAT5-pY694 (#9356S, 1:1000), and anti-ERK1/2-pT202-pY204 (D13.14.4E, 1:1000) were from Cell Signaling, anti-STAT5 (#610192) was from BD, and anti-ERK1/2 (MAB15761, 1:1000) was from R & D Systems. Anti-STAT5A (sc-1081, 1:1000) and anti-STAT5B (Sc-1656, 1:1000) were from Santa Cruz. Fluorescence conjugated anti-Mouse IgG (Cat#35519) and anti-Rabbit IgG (Cat#35569) secondary antibodies (Invitrogen) were used at a 1:20,000 dilution.
For Chip-seq analyses, anti-STAT5B antibodies were from Invitrogen (Cat#13-5300) and anti-H3K27ac antibody (Cat#C15410196) was from Diagenode.
Real time qPCR
RNA was extracted and purified with Direct-zol RNA kits from Zymo Research. 0.5 μg of RNA was subjected to reverse transcription using iScript Reverse Transcription Supermix from BIO-RAD. The products were tested for gene expression using PrimeTime qPCR Probe Assays from Integrated DNA Technologies (Mm.PT.58.7590689 for Slc2a1, Mm.PT.58.30464830 for Slc2a3, Mm.PT.58.8951520 for Rpl7, Hs.PT.39a.22214824 for RPLP0, Hs.PT.56a.27441991 for CD27, Hs.PT.58.19831504 for TCF7 and Hs.PT.58.25872862 for SLC2A1). Quantitative results were normalized to mouse Rpl7 or human RPLP0 expression.
Statistical analyses
Statistics were processed with GraphPad Prism v9.0 unless otherwise specified, and statistics test and exact P-values are provided in the Figures whenever available (when P-values are lower than 0.0001, P< 0.0001 is shown as exact P-value is not available by GraphPad Prism). For GSEA analysis, data were processed with GSEA v4.0, and P-value are calculated by Kolmogorov-Smirnov test as previously described55.
Data availability
Our ATAC-seq, ChIP-seq, and RNA-seq data are at Gene Expression Omnnibus (GEO) under accession GSE138698 (https://www.ncbi.nlm.nih.gov/geo/query/acc.cgi?acc=GSE138698). Publically-available previously generated ChIP-seq56 (https://www.ncbi.nlm.nih.gov/geo/query/acc.cgi?acc=GSE36890) and ATAC-seq22 (https://www.ncbi.nlm.nih.gov/geo/query/acc.cgi?acc=GSE88987 ) data were also used in this study.
Extended Data
Extended Data Fig. 1 |. Characterization of H9T-expanded CD8+ T cells.

a, Preactivated CD8+ T cells were rested overnight and cultured with PBS, IL-2, H9, or H9T as indicated for 10 min, and western blotted for phospho-STAT5 (pSTAT5) and pERK. Total STAT5 and ERK were included as controls (on the same gel of pSTAT5 and pERK). Data are representative of two independent experiments. Relative densitometry is shown below each panel (normalized to the IL-2 condition). For gel source data, see Supplementary Fig. 1b
b, Preactivated CD8+ T cells were rested overnight and stimulated with 10 nM IL-2 or H9T, lysed, and immunoprecipitated with anti-STAT5A or anti-STAT5B antibodies followed with western blotting analysis for pSTAT5 and STAT5A or STAT5B as loading controls (on the same gel). Data are representative of two independent experiments. Relative densitometry is shown below each panel (normalized to the IL-2 condition). For gel source data, see Supplementary Fig. 1c. Data are from two independent repeats.
c, Preactivated CD8+ T cells were rested overnight, cultured with PBS, IL-2, H9, or H9T for 6 days, fixed, permeabilized and intracellularly stained for pSTAT5, n= 4 mice. Data are presented as mean values +/− SEM, one-way ANOVA test with Dunnett’s correction. Data are from two independent repeats.
d, Pre-activated mouse CD8+ T cells were rested overnight and then cultured in medium containing serial dilutions of IL-2, H9, or H9T for 8 days and analyzed for TIM-3 expression. Data are representative of three independent experiments.
e-h, Pre-activated CD8+ T cells were cultured with 10 nM IL-2, H9, or H9T for 8 days, and surface expression of TIM-3 (e), PD-1 (f), LAG-3 (g), and 2B4 (h) was analyzed by flow cytometry. Data are representative of four independent experiments.
Extended Data Fig. 2 |. Functional analysis of CD8+ T cells expanded with IL-2, H9, or H9T.

a-b, Expression of CD62L and the percentage of memory-like cells (CD62L+CD44+). Pre-activated CD8+ T cells were cultured with 10 nM IL-2, H9, or H9T for 8 days, and stained for CD44 and CD62L. Data are mean values +/− SEM, n= 6 mice, one-way ANOVA test with Dunnett’s correction. Data are representative of three independent experiments.
c, Expression of CD62L in IL-2- or H9T-cultured cells or cells switched from H9T-containing medium to IL-2-containing medium for 2 days. Pre-activated CD8+ T cells were cultured with 10 nM IL-2 or H9T, and on day 6, a fraction of the H9T-expanded cells was washed and subsequently cultured with 10 nM IL-2. Cells were collected two days later and analyzed by flow cytometry. Data are presented as mean values +/− SEM, n= 4 mice, one-way ANOVA test with Dunnett’s correction. Data are representative of two independent experiments.
d-g, Cytokine production and memory population in CD8+ T cells expanded with IL-2, H9, or H9T. Preactivated CD8+ T cells were expanded for 8 days with IL-2, H9, or H9T, stimulated with 100 nM gp100 or control peptide for 1 h, and then treated with 5 μg/ml Brefeldin A for 5 h. Cells were then fixed for intracellular staining of IFN-γ, n= 5 mice (d); TNF-α, n= 5 mice (e); IL-2, n= 3 mice (f); and IL-10, n= 5 mice (g); Data are presented as mean values +/− SEM, one-way ANOVA test with Dunnett’s correction. Data are representative of two independent experiments.
Extended Data Fig. 3 |. RNA-seq and ATAC-seq analysis of CD8+ T cells expanded with IL-2, H9, or H9T.

a, Volcano plots of RNA-Seq data from preactivated CD8+ T cells that were expanded for 6 days with IL-2, H9, or H9T. Shown are gene expression differences between cells expanded with IL-2 versus H9T (a) or H9 versus H9T (b). Data are representative of two independent experiments.
c, Differentially expressed genes for CD8+ T cells expanded for 6 days with H9 versus H9T. Data are representative of two independent experiments.
d, GSEA analysis of RNA-seq data compared with endogenous memory versus exhausted populations of cells, with Kolmogorov-Smirnov test. Data are representative of two independent experiments.
e-g, Preactivated CD8+ T cells were expanded for 8 days with IL-2, H9, or H9T and then either permeabilized for intracellular staining of TCF-1 (e) and BLIMP1 (f) or analyzed for surface expression of CXCR3 (g). Data are representative of three independent experiments.
h-i, Expression of CD62L and TIM-3 in control or Tcf7-deficient CD8+ T cells. CD8+ T cells were isolated from Tcf7 conditional knock-out mice (Tcf7−/−)) or control littermates (Tcf7fl/fl ) and activated for 2 days, rested overnight, followed with expansion in IL-2- or H9T-containing medium. Surface staining of CD62L (h) and TIM-3 (i) is shown. Data are mean +/− SEM, n= 3 mice, two-sided t-test. Data are representative of two independent experiments.
j, Differentially expressed genes from RNA-Seq were aligned to ATAC-seq plots. Data are representative of two independent experiments.
k-l, ATAC-seq data from CD8+ T cells expanded for 6 days were aligned with in vivo generated effector, exhausted, and memory populations. Shown is chromatin accessibility at the Havcr2 (k) and Il10 (l) loci. Data are representative of two independent experiments.
Extended Data Fig. 4 |. Metabolic profiling of IL-2-, H9-, and H9T-expanded CD8+ T cells.

a, Photograph showing media color of CD8+ T cells expanded for 8 days with IL-2, H9, or H9T. Data are representative of two independent experiments.
b-c, CD8+ T cells were isolated and expanded for 8 days with IL-2, H9, or H9T, and 5 million cells were collected for metabolomics analysis. Relative levels of glucose (b) and lactate (c) are presented as mean values +/− SEM, one-way ANOVA test with Dunnett’s correction, n= 3 mice. Data are representative of two independent experiments.
d, 8 day IL-2, H9, or H9T expanded CD8+ T cells were incubated with or without 2-NBDG to assess glucose uptake. Data are presented as mean values +/− SEM, one-way ANOVA test with Dunnett’s correction, n= 4 mice. Data are representative of two independent experiments.
e, 8 day IL-2, H9, or H9T expanded CD8+ T cells were incubated with or without TMRM to assess mitochondrial membrane potential. Data are presented as mean values +/− SEM, one-way ANOVA test with Dunnett’s correction, n= 8 mice. Data are representative of two independent experiments.
f-h, Preactivated CD8+ T cells were treated with control or 1 mM 2-DG in the presence of IL-2 for 2 days. Cells were subsequently stained with antibodies to TCF-1 (n= 3 mice), CD62L (n= 3 mice), or pSTAT5 (n= 6 mice). Data are presented as mean values +/− SEM, with two-tailed, paired t-test. Data are representative of two independent experiments.
i, PCA plot of RNA-seq data from 2-DG and control treated cells. Preactivated CD8+ T cells were treated with 10 nM IL-2 with or without 2-DG for 2 days, and RNA was extracted for library preparation. Data are from three mice.
Extended Data Fig. 5 |. Comparison of actions of H9T versus natural cytokines on murine CD8+ T cells.

a, b Pre-activated mouse (a) or human (b) CD8+ T cells were rested and cultured with 10 nM of the indicated cytokines for 6 days, and cell density was counted by beads-based flow cytometry. Data are mean +/− SEM, one-way ANOVA test with Dunnett’s correction. a, n= 6 mice; b, n = 6 donors. Data are representative of two independent experiments.
c, Pre-activated mouse CD8+ cells were rested and cultured with 10 nM of the indicated cytokines for 6 days, and TIM-3 expression was examined by flow cytometry. Data are mean +/− SEM, one-way ANOVA test with Dunnett’s correction, n= 4 mice. Data are representative of two independent experiments.
d-f, Preactivated mouse CD8+ T cells were rested overnight and cultured with 10 nM of the indicated cytokines for 0, 0.5, 1, 2, or 4 hours. Cells were then fixed, permeabilized, and stained for STAT5-pY694 (d), AKT-pS473 (e) and ERK-pT202/pY204 (f). Data are mean +/− SEM, n= 6 mice, Data are representative of two independent experiments.
g-h, Pre-activated mouse CD8+ T cells were rested and cultured with 10 nM of the indicated cytokines for 1 day and collected for RNA-seq. PCA analysis (g) and selected gene expression (h) are shown. Data are combined from two biological repeats.
Extended Data Fig. 6 |. Comparison of H9T with natural cytokines on human CD8+ T cells.
a, Pre-activated human CD8+ cells were rested and cultured with 10 nM indicated cytokines for 6 days, and TIM-3 expression was examined. Data are mean +/− SEM, one-way ANOVA test with Dunnett’s correction, n= 6 donors. Data are from two independent experiments.
b-d, Pre-activated human CD8+ T cells were rested and cultured with 10 nM indictaed cytokines for 0, 0.5, 1, 2 and 4 hours and stained with anti-pSTAT5, pAKT, and pERK. Data are mean +/− SEM, n= 6 donors. Data are from two independent experiments.
e-i, Pre-activated human CD8+ T cells were rested and cultured with 10 nM of the indicated cytokines for 24 hours and cells were collected for RNA-seq. Selected genes expression (e), PCA analysis (f) and GSEA were shown, Kolmogorov-Smirnov test. Data are from three donors.
j-l, Pre-activated human CD8+ T cells were rested and cultured with 10 nM of the indicated cytokines for 6 days, and stained with anti-CD27, CCR7 and Granzyme B antibodies. Data are mean +/− SEM, one-way ANOVA test with Dunnett’s correction, n= 6 donors. Data are from two independent experiments.
m, Pre-activated human CD8+ cells were rested and cultured with 10 nM of the indicated cytokines for 6 days, followed by TMRM analysis. Data are mean +/− SEM, one-way ANOVA test with Dunnett’s correction, n= 5 donors. Data are from two independent experiments.
n, Pre-activated human CD8+ T cells were rested and cultured with 1 nM IL-2 alone or in the presence of 1, 10 and 100 nM H9T or IL-15. TIM-3 expression was analyzed by flow cytometry after 2 days. Data are mean +/− SEM, one-way ANOVA test with Dunnett’s correction, n= 5 donors. Data are from two independent experiments.
Extended Data Fig. 7 |. Dose response of IL-2, IL-15 and H9T on CD8+ T cells.

a-c, Dose response of IL-2, IL-15, and H9T in human CD8+ T cells. Pre-activated human CD8+ cells were rested and cultured with 0-100 nM of IL-2, IL-15, or H9T for 6 days and stained for surface expression of TIM-3 (a) or permeabilized and stained for intracellular granzyme B (b). Cell expansion rate (c) was assessed using flow cytometry based counting beads. Data are mean +/− SEM, n= 2 donors. Data are representative of two independent experiments.
d-f, mRNA levels of TCF7, SLC2A1 and CD27 in human CD8+ T cells. Pre-activated human CD8+ cells were rested and stimulated with 1 nM of IL-2, IL-15, or H9T for 24 hours. Cells were collected and mRNA extracted for qPCR analysis of TCF7 (d), CD27 (e) and SLC2A1 (f). The mRNA expression was normalized to that of RPLP0. Data are representative of two independent experiments.
Extended Data Fig. 8 |. Effects of H9T on human CD4+ T cells.

a-d, Phenotypic analysis of expanded human CD4+ T cells. Pre-activated human CD4+ cells were cultured with 10 nM H9T, IL-2, IL-15, or IL-7 + IL-15 for 6 days, and mitochondria membrane potential (a) and surface expression of TIM-3 (b) , CCR7(c), and CD27 (d) were examined by flow cytometry analysis after staining. Data are presented as mean values +/− SEM, n= 5 donors, with paired two-sided t-test. Data are representative of two independent experiments.
Extended Data Fig. 9 |. Effects of STAT5 activation on T cell exhaustion and stemness.

a, ChIP-seq analysis of STAT5A and STAT5B binding sites at the Havcr2 locus from previously published datasets (GSE36890).
b-c, TIM-3 expression on CD8+ T cells from Stat5a (b) and Stat5b (c) knock-out mice versus wild-type littermate controls. Cells were expanded for 8 days with 10 nM of IL-2 as described above, and TIM-3 expression analyzed by flow cytometry. Data are mean +/− SEM, n= 4 mice, two-sided t-test. Data are from two independent repeats.
d, ChIP-seq analysis of STAT5 binding sites at HAVCR, GZMB, TCF7, SLC2A1, and SLC2A3 loci. Human CD8+ T cells were preactivated with anti-CD3/anti-CD28 beads for 2 days, rested overnight, incubated with 10 nM IL-2 or H9T for 2 hours, and then fixed and lysed for ChIP-Seq. Data are from two independent experiments.
e-h, Mouse CD8+ T cells expressing empty vector (EV)-GFP or STAT5A-1*6 vector-GFP were sorted and expanded in H9T-containing medium for an additional four days prior to staining with the indicated antibodies. Data are representative of two independent experiments.
i-m, RNA-seq analysis of the effects of STAT5A-1*6 expression. Mouse CD8+ T cells were treated as above, and cells were collected for RNA-seq. PCA analysis (i) and expression of selected genes (j) are shown. GSEA analysis of IL-2-STAT5 signaling (k), PI3K-AKT-MTOR signaling (l) and exhaustion versus memory (m) are also shown, Kolmogorov-Smirnov test. Data are from two biological repeats.
n-p, ATAC-seq analysis of the effect of STAT5A-1*6 expression. Mouse CD8+ T cells were treated as described above, and cells were collected for ATAC-seq. Shown are PCA analysis to compare IL-2-, H9-, and H9T-expanded cells (n), and ATAC-seq data at the Havcr2 (o) and Tcf7 (p) loci.
Extended Data Fig. 10 |. Efficacy of H9T in adoptive cell immunotherapy.

a, Tumor growth after transfer of pmel-1 cells that expanded with IL-2, H9 or H9T for 8 days into B16 melanoma-bearing mice, with PBS as a control. n= 14 for H9 group and n= 15 mice for all other groups, data are from three independent repeats.
b, Blood cells from mice cured of B16 melanoma tumor after adoptive transfer of H9T-expanded CD8+ pmel-1 cells were stained for CD8 and CD90.1. Data are from two independent experiments.
c-d, IL-2- or H9T-expanded CD8+ pmel-1 cells were transferred into B16 melanoma-bearing mice, with PBS as a control. Mice were irradiated one day before cell transfer but not injected i.p. with IL-2 after cell transfer (no IP) or not irradiated but injected with 180,000 IU IL-2 i.p. daily for 3 days beginning on the day of transfer (no IR). Data are mean +/− SEM, n= 5 mice. Data are from two independent repeats.
e-g, TIM-3 and PD1 profiling of pmel-1 cells in tumor and draining lymph nodes 7 days after adoptive transfer. Data are mean +/− SEM, n= 5 mice, one-way ANOVA test with Dunnett’s correction. Gating strategy is shown (g). Data are from three independent repeats.
h, B16 tumor size 8 days after pmel-1 CD8+ T cells infusion. Data are mean +/− SEM, n= 5 mice. Data are from three independent repeats.
i-j, Phenotype of pmel-1 cells in tumor and draining lymph nodes 5 or 10 days after adoptive transfer. Data are from two independent experiments.
k-m, 7 days after adoptive transfer, CD8+CD90.1+ cells was sorted from draining lymph nodes and analyzed by RNA-seq. Selected gene expression (k and l) and GSEA analysis of memory versus exhausted cells (m) with Kolmogorov-Smirnov test are shown. Data are from two independent repeats.
Supplementary Material
Supplementary Fig. 1. Uncropped gels of western blotting data. Related to Fig. 1p and Extended Data Fig. 1a, b.
Supplementary Fig. 2. Flow cytometry gating strategies.
Supplementary Table 1. All RefSeq genes from RNA-Seq data related to Fig. 2a.
Supplementary Table 2. Differentially expressed genes between IL-2 and H9T. Related to Fig. 2b,c, and Extended Data Fig. 3a.
Supplementary Table 3. Differentially expressed genes between H9 and H9T. Related to Fig. 2c and Extended Data Fig. 3b,c.
Supplementary Table 4. ATAC-Seq peaks of mouse CD8+ T cells expanded for 6 days as indicated. Related to Fig. 2h.
Supplementary Table 5. Significant metabolites. Related to Fig. 3a.
Supplementary Table 6. All detected metabolites. Related to Fig. 3b.
Supplementary Table 7. RNA-seq of mouse CD8+ T cells treated with IL-2 or IL-2 plus 2-DG for 2 days. Related to Fig. 3m.
Supplementary Table 8. RNA-seq of mouse CD8+ T cells treated with H9T, IL-2, IL-15 or IL-7/15 for 24 hours. Related to Extended Data Fig. 5h.
Supplementary Table 10. RNA-seq of mouse CD8+ T cells over-expressing STAT5A-1*6 or a control vector. Related to Extended Data Fig. 9j.
Supplementary Table 9. RNA-seq of human CD8+ T cells treated with H9T, IL-2, IL-15 or IL-7/15 for 24 hours. Related to Extended Data Fig. 6e.
Supplementary Table 11. ATAC-seq of mouse CD8+ T cells over-expressing STAT5A-1*6 or a control vector. Related to Extended Data Fig. 9n.
Supplementary Table 12. RNA-seq of CD90.1+ mouse CD8+ T cells purified from draining lymph nodes 7 days after transfer. Related to Extended Data Fig. 10k.
Acknowledgments
We thank Dr. Rafi Ahmed (Emory University) for critical comments, and Drs. Wei Yang (NIDDK) and Chuan Wu (NCI) for valuable discussions. We thank the NHLBI DIR Flow Cytometry Core, DNA Sequencing and Genomics Core for assistance on cell sorting and DNA sequencing. The work was supported by the Division of Intramural Research, National Heart, Lung, and Blood Institute, and the Division of Intramural Research, National Cancer Institute. K.C.G. was supported by NIH AI51321, the Parker Institute of Cancer Immunotherapy, the Ludwig Foundation, the Mathers Foundation, and the Howard Hughes Medical Institute.
Footnotes
Competing interests
W.J.L., K.C.G., and S.M. are inventors on patents and patent applications that include H9T. L.G. is an inventor on a patent describing methods for the generation and isolation of Tscm cells. L.G. has consulting agreements with Lyell Immunopharma, AstraZeneca, Turnstone Biologics, Xcelcyte, and Advaxis Immunotherapies. L.G. is on the scientific advisory board of Poseida Therapeutics, and Kiromic and stockholder of Poseida Therapeutics.
Reference
- 1.Rosenberg SA & Restifo NP Adoptive cell transfer as personalized immunotherapy for human cancer. Science 348, 62–68, doi: 10.1126/science.aaa4967 (2015). [DOI] [PMC free article] [PubMed] [Google Scholar]
- 2.Shah NN & Fry TJ Mechanisms of resistance to CAR T cell therapy. Nat Rev Clin Oncol 16, 372–385, doi: 10.1038/s41571-019-0184-6 (2019). [DOI] [PMC free article] [PubMed] [Google Scholar]
- 3.Crompton JG, Sukumar M & Restifo NP Uncoupling T-cell expansion from effector differentiation in cell-based immunotherapy. Immunol Rev 257, 264–276, doi: 10.1111/imr.12135 (2014). [DOI] [PMC free article] [PubMed] [Google Scholar]
- 4.Pipkin ME et al. Interleukin-2 and inflammation induce distinct transcriptional programs that promote the differentiation of effector cytolytic T cells. Immunity 32, 79–90, doi: 10.1016/j.immuni.2009.11.012 (2010). [DOI] [PMC free article] [PubMed] [Google Scholar]
- 5.Kalia V et al. Prolonged interleukin-2Ralpha expression on virus-specific CD8+ T cells favors terminal-effector differentiation in vivo. Immunity 32, 91–103, doi: 10.1016/j.immuni.2009.11.010 (2010). [DOI] [PubMed] [Google Scholar]
- 6.Gattinoni L, Speiser DE, Lichterfeld M & Bonini C T memory stem cells in health and disease. Nat Med 23, 18–27, doi: 10.1038/nm.4241 (2017). [DOI] [PMC free article] [PubMed] [Google Scholar]
- 7.Gattinoni L, Klebanoff CA & Restifo NP Paths to stemness: building the ultimate antitumour T cell. Nat Rev Cancer 12, 671–684, doi: 10.1038/nrc3322 (2012). [DOI] [PMC free article] [PubMed] [Google Scholar]
- 8.Silva DA et al. De novo design of potent and selective mimics of IL-2 and IL-15. Nature 565, 186–191, doi: 10.1038/s41586-018-0830-7 (2019). [DOI] [PMC free article] [PubMed] [Google Scholar]
- 9.Spolski R, Li P & Leonard WJ Biology and regulation of IL-2: from molecular mechanisms to human therapy. Nat Rev Immunol 18, 648–659, doi: 10.1038/s41577-018-0046-y (2018). [DOI] [PubMed] [Google Scholar]
- 10.Leonard WJ, Lin JX & O’Shea JJ The gammac Family of Cytokines: Basic Biology to Therapeutic Ramifications. Immunity 50, 832–850, doi: 10.1016/j.immuni.2019.03.028 (2019). [DOI] [PubMed] [Google Scholar]
- 11.Kinter AL et al. The common gamma-chain cytokines IL-2, IL-7, IL-15, and IL-21 induce the expression of programmed death-1 and its ligands. J Immunol 181, 6738–6746 (2008). [DOI] [PubMed] [Google Scholar]
- 12.Mujib S et al. Antigen-independent induction of Tim-3 expression on human T cells by the common gamma-chain cytokines IL-2, IL-7, IL-15, and IL-21 is associated with proliferation and is dependent on the phosphoinositide 3-kinase pathway. J Immunol 188, 3745–3756, doi: 10.4049/jimmunol.1102609 (2012). [DOI] [PubMed] [Google Scholar]
- 13.Jin HT et al. Cooperation of Tim-3 and PD-1 in CD8 T-cell exhaustion during chronic viral infection. Proc Natl Acad Sci U S A 107, 14733–14738, doi: 10.1073/pnas.1009731107 (2010). [DOI] [PMC free article] [PubMed] [Google Scholar]
- 14.Sakuishi K et al. Targeting Tim-3 and PD-1 pathways to reverse T cell exhaustion and restore anti-tumor immunity. J Exp Med 207, 2187–2194, doi: 10.1084/jem.20100643 (2010). [DOI] [PMC free article] [PubMed] [Google Scholar]
- 15.Levin AM et al. Exploiting a natural conformational switch to engineer an interleukin-2 ‘superkine’. Nature 484, 529–533, doi: 10.1038/nature10975 (2012). [DOI] [PMC free article] [PubMed] [Google Scholar]
- 16.Mitra S et al. Interleukin-2 activity can be fine tuned with engineered receptor signaling clamps. Immunity 42, 826–838, doi: 10.1016/j.immuni.2015.04.018 (2015). [DOI] [PMC free article] [PubMed] [Google Scholar]
- 17.Wang X, Rickert M & Garcia KC Structure of the quaternary complex of interleukin-2 with its alpha, beta, and gammac receptors. Science 310, 1159–1163, doi: 10.1126/science.1117893 (2005). [DOI] [PubMed] [Google Scholar]
- 18.Liu DV, Maier LM, Hafler DA & Wittrup KD Engineered interleukin-2 antagonists for the inhibition of regulatory T cells. J Immunother 32, 887–894, doi: 10.1097/CJI.0b013e3181b528da (2009). [DOI] [PMC free article] [PubMed] [Google Scholar]
- 19.Gattinoni L et al. A human memory T cell subset with stem cell-like properties. Nat Med 17, 1290–1297, doi: 10.1038/nm.2446 (2011). [DOI] [PMC free article] [PubMed] [Google Scholar]
- 20.McLane LM, Abdel-Hakeem MS & Wherry EJ CD8 T Cell Exhaustion During Chronic Viral Infection and Cancer. Annu Rev Immunol 37, 457–495, doi: 10.1146/annurev-immunol-041015-055318 (2019). [DOI] [PubMed] [Google Scholar]
- 21.Im SJ et al. Defining CD8+ T cells that provide the proliferative burst after PD-1 therapy. Nature 537, 417–421, doi: 10.1038/nature19330 (2016). [DOI] [PMC free article] [PubMed] [Google Scholar]
- 22.Scott-Browne JP et al. Dynamic Changes in Chromatin Accessibility Occur in CD8(+) T Cells Responding to Viral Infection. Immunity 45, 1327–1340, doi: 10.1016/j.immuni.2016.10.028 (2016). [DOI] [PMC free article] [PubMed] [Google Scholar]
- 23.Wang R & Green DR Metabolic checkpoints in activated T cells. Nat Immunol 13, 907–915, doi: 10.1038/ni.2386 (2012). [DOI] [PubMed] [Google Scholar]
- 24.Sukumar M et al. Inhibiting glycolytic metabolism enhances CD8+ T cell memory and antitumor function. J Clin Invest 123, 4479–4488, doi: 10.1172/JCI69589 (2013). [DOI] [PMC free article] [PubMed] [Google Scholar]
- 25.van der Windt GJ et al. Mitochondrial respiratory capacity is a critical regulator of CD8+ T cell memory development. Immunity 36, 68–78, doi: 10.1016/j.immuni.2011.12.007 (2012). [DOI] [PMC free article] [PubMed] [Google Scholar]
- 26.Manjunath N et al. Effector differentiation is not prerequisite for generation of memory cytotoxic T lymphocytes. J Clin Invest 108, 871–878, doi: 10.1172/JCI13296 (2001). [DOI] [PMC free article] [PubMed] [Google Scholar]
- 27.Hinrichs CS et al. IL-2 and IL-21 confer opposing differentiation programs to CD8+ T cells for adoptive immunotherapy. Blood 111, 5326–5333, doi: 10.1182/blood-2007-09-113050 (2008). [DOI] [PMC free article] [PubMed] [Google Scholar]
- 28.Onishi M et al. Identification and characterization of a constitutively active STAT5 mutant that promotes cell proliferation. Mol Cell Biol 18, 3871–3879, doi: 10.1128/mcb.18.7.3871 (1998). [DOI] [PMC free article] [PubMed] [Google Scholar]
- 29.Blank CU et al. Defining ‘T cell exhaustion’. Nat Rev Immunol 19, 665–674, doi: 10.1038/s41577-019-0221-9 (2019). [DOI] [PMC free article] [PubMed] [Google Scholar]
- 30.Yang Q et al. TCF-1 upregulation identifies early innate lymphoid progenitors in the bone marrow. Nat Immunol 16, 1044–1050, doi: 10.1038/ni.3248 (2015). [DOI] [PMC free article] [PubMed] [Google Scholar]
- 31.Liu X et al. Stat5a is mandatory for adult mammary gland development and lactogenesis. Genes Dev 11, 179–186, doi: 10.1101/gad.11.2.179 (1997). [DOI] [PubMed] [Google Scholar]
- 32.Udy GB et al. Requirement of STAT5b for sexual dimorphism of body growth rates and liver gene expression. Proc Natl Acad Sci U S A 94, 7239–7244, doi: 10.1073/pnas.94.14.7239 (1997). [DOI] [PMC free article] [PubMed] [Google Scholar]
- 33.Vodnala SK et al. T cell stemness and dysfunction in tumors are triggered by a common mechanism. Science 363, doi: 10.1126/science.aau0135 (2019). [DOI] [PMC free article] [PubMed] [Google Scholar]
- 34.Hanada KI, Yu Z, Chappell GR, Park AS & Restifo NP An effective mouse model for adoptive cancer immunotherapy targeting neoantigens. JCI Insight 4, doi: 10.1172/jci.insight.124405 (2019). [DOI] [PMC free article] [PubMed] [Google Scholar]
- 35.Zhu EF et al. Synergistic innate and adaptive immune response to combination immunotherapy with anti-tumor antigen antibodies and extended serum half-life IL-2. Cancer Cell 27, 489–501, doi: 10.1016/j.ccell.2015.03.004 (2015). [DOI] [PMC free article] [PubMed] [Google Scholar]
- 36.Sockolosky JT et al. Selective targeting of engineered T cells using orthogonal IL-2 cytokine-receptor complexes. Science 359, 1037–1042, doi: 10.1126/science.aar3246 (2018). [DOI] [PMC free article] [PubMed] [Google Scholar]
- 37.Bijl J, Sauvageau M, Thompson A & Sauvageau G High incidence of proviral integrations in the Hoxa locus in a new model of E2a-PBX1-induced B-cell leukemia. Genes Dev 19, 224–233, doi: 10.1101/gad.1268505 (2005). [DOI] [PMC free article] [PubMed] [Google Scholar]
- 38.Jacoby E et al. Murine allogeneic CD19 CAR T cells harbor potent antileukemic activity but have the potential to mediate lethal GVHD. Blood 127, 1361–1370, doi: 10.1182/blood-2015-08-664250 (2016). [DOI] [PMC free article] [PubMed] [Google Scholar]
- 39.Yamamoto TN et al. T cells genetically engineered to overcome death signaling enhance adoptive cancer immunotherapy. J Clin Invest 130, doi: 10.1172/JCI121491 (2019). [DOI] [PMC free article] [PubMed] [Google Scholar]
- 40.Ya Z, Hailemichael Y, Overwijk W & Restifo NP Mouse model for pre-clinical study of human cancer immunotherapy. Curr Protoc Immunol 108, 20 21 21–43, doi: 10.1002/0471142735.im2001s108 (2015). [DOI] [PMC free article] [PubMed] [Google Scholar]
- 41.Kochenderfer JN, Yu Z, Frasheri D, Restifo NP & Rosenberg SA Adoptive transfer of syngeneic T cells transduced with a chimeric antigen receptor that recognizes murine CD19 can eradicate lymphoma and normal B cells. Blood 116, 3875–3886, doi: 10.1182/blood-2010-01-265041 (2010). [DOI] [PMC free article] [PubMed] [Google Scholar]
- 42.van der Windt GJ, Chang CH & Pearce EL Measuring Bioenergetics in T Cells Using a Seahorse Extracellular Flux Analyzer. Curr Protoc Immunol 113, 3 16B 11-13 16B 14, doi: 10.1002/0471142735.im0316bs113 (2016). [DOI] [PMC free article] [PubMed] [Google Scholar]
- 43.Hermans D et al. Lactate dehydrogenase inhibition synergizes with IL-21 to promote CD8(+) T cell stemness and antitumor immunity. Proc Natl Acad Sci U S A 117, 6047–6055, doi: 10.1073/pnas.1920413117 (2020). [DOI] [PMC free article] [PubMed] [Google Scholar]
- 44.Sukumar M et al. Mitochondrial Membrane Potential Identifies Cells with Enhanced Stemness for Cellular Therapy. Cell Metab 23, 63–76, doi: 10.1016/j.cmet.2015.11.002 (2016). [DOI] [PMC free article] [PubMed] [Google Scholar]
- 45.Lin JX et al. Critical functions for STAT5 tetramers in the maturation and survival of natural killer cells. Nat Commun 8, 1320, doi: 10.1038/s41467-017-01477-5 (2017). [DOI] [PMC free article] [PubMed] [Google Scholar]
- 46.Li P et al. BATF-JUN is critical for IRF4-mediated transcription in T cells. Nature 490, 543–546, doi: 10.1038/nature11530 (2012). [DOI] [PMC free article] [PubMed] [Google Scholar]
- 47.Buenrostro JD, Wu B, Chang HY & Greenleaf WJ ATAC-seq: A Method for Assaying Chromatin Accessibility Genome-Wide. Curr Protoc Mol Biol 109, 21 29 21–29, doi: 10.1002/0471142727.mb2129s109 (2015). [DOI] [PMC free article] [PubMed] [Google Scholar]
- 48.Langmead B, Trapnell C, Pop M & Salzberg SL Ultrafast and memory-efficient alignment of short DNA sequences to the human genome. Genome Biol 10, R25, doi: 10.1186/gb-2009-10-3-r25 (2009). [DOI] [PMC free article] [PubMed] [Google Scholar]
- 49.Trapnell C, Pachter L & Salzberg SL TopHat: discovering splice junctions with RNA-Seq. Bioinformatics 25, 1105–1111, doi: 10.1093/bioinformatics/btp120 (2009). [DOI] [PMC free article] [PubMed] [Google Scholar]
- 50.Robinson JT et al. Integrative genomics viewer. Nat Biotechnol 29, 24–26, doi: 10.1038/nbt.1754 (2011). [DOI] [PMC free article] [PubMed] [Google Scholar]
- 51.Robinson MD, McCarthy DJ & Smyth GK edgeR: a Bioconductor package for differential expression analysis of digital gene expression data. Bioinformatics 26, 139–140, doi: 10.1093/bioinformatics/btp616 (2010). [DOI] [PMC free article] [PubMed] [Google Scholar]
- 52.Wherry EJ et al. Molecular signature of CD8+ T cell exhaustion during chronic viral infection. Immunity 27, 670–684, doi: 10.1016/j.immuni.2007.09.006 (2007). [DOI] [PubMed] [Google Scholar]
- 53.Doering TA et al. Network analysis reveals centrally connected genes and pathways involved in CD8+ T cell exhaustion versus memory. Immunity 37, 1130–1144, doi: 10.1016/j.immuni.2012.08.021 (2012). [DOI] [PMC free article] [PubMed] [Google Scholar]
- 54.Wu T et al. The TCF1-Bcl6 axis counteracts type I interferon to repress exhaustion and maintain T cell stemness. Sci Immunol 1, doi: 10.1126/sciimmunol.aai8593 (2016). [DOI] [PMC free article] [PubMed] [Google Scholar]
- 55.Subramanian A et al. Gene set enrichment analysis: a knowledge-based approach for interpreting genome-wide expression profiles. Proc Natl Acad Sci U S A 102, 15545–15550, doi: 10.1073/pnas.0506580102 (2005). [DOI] [PMC free article] [PubMed] [Google Scholar]
- 56.Lin JX et al. Critical Role of STAT5 transcription factor tetramerization for cytokine responses and normal immune function. Immunity 36, 586–599, doi: 10.1016/j.immuni.2012.02.017 (2012). [DOI] [PMC free article] [PubMed] [Google Scholar]
Associated Data
This section collects any data citations, data availability statements, or supplementary materials included in this article.
Supplementary Materials
Supplementary Fig. 1. Uncropped gels of western blotting data. Related to Fig. 1p and Extended Data Fig. 1a, b.
Supplementary Fig. 2. Flow cytometry gating strategies.
Supplementary Table 1. All RefSeq genes from RNA-Seq data related to Fig. 2a.
Supplementary Table 2. Differentially expressed genes between IL-2 and H9T. Related to Fig. 2b,c, and Extended Data Fig. 3a.
Supplementary Table 3. Differentially expressed genes between H9 and H9T. Related to Fig. 2c and Extended Data Fig. 3b,c.
Supplementary Table 4. ATAC-Seq peaks of mouse CD8+ T cells expanded for 6 days as indicated. Related to Fig. 2h.
Supplementary Table 5. Significant metabolites. Related to Fig. 3a.
Supplementary Table 6. All detected metabolites. Related to Fig. 3b.
Supplementary Table 7. RNA-seq of mouse CD8+ T cells treated with IL-2 or IL-2 plus 2-DG for 2 days. Related to Fig. 3m.
Supplementary Table 8. RNA-seq of mouse CD8+ T cells treated with H9T, IL-2, IL-15 or IL-7/15 for 24 hours. Related to Extended Data Fig. 5h.
Supplementary Table 10. RNA-seq of mouse CD8+ T cells over-expressing STAT5A-1*6 or a control vector. Related to Extended Data Fig. 9j.
Supplementary Table 9. RNA-seq of human CD8+ T cells treated with H9T, IL-2, IL-15 or IL-7/15 for 24 hours. Related to Extended Data Fig. 6e.
Supplementary Table 11. ATAC-seq of mouse CD8+ T cells over-expressing STAT5A-1*6 or a control vector. Related to Extended Data Fig. 9n.
Supplementary Table 12. RNA-seq of CD90.1+ mouse CD8+ T cells purified from draining lymph nodes 7 days after transfer. Related to Extended Data Fig. 10k.
Data Availability Statement
Our ATAC-seq, ChIP-seq, and RNA-seq data are at Gene Expression Omnnibus (GEO) under accession GSE138698 (https://www.ncbi.nlm.nih.gov/geo/query/acc.cgi?acc=GSE138698). Publically-available previously generated ChIP-seq56 (https://www.ncbi.nlm.nih.gov/geo/query/acc.cgi?acc=GSE36890) and ATAC-seq22 (https://www.ncbi.nlm.nih.gov/geo/query/acc.cgi?acc=GSE88987 ) data were also used in this study.