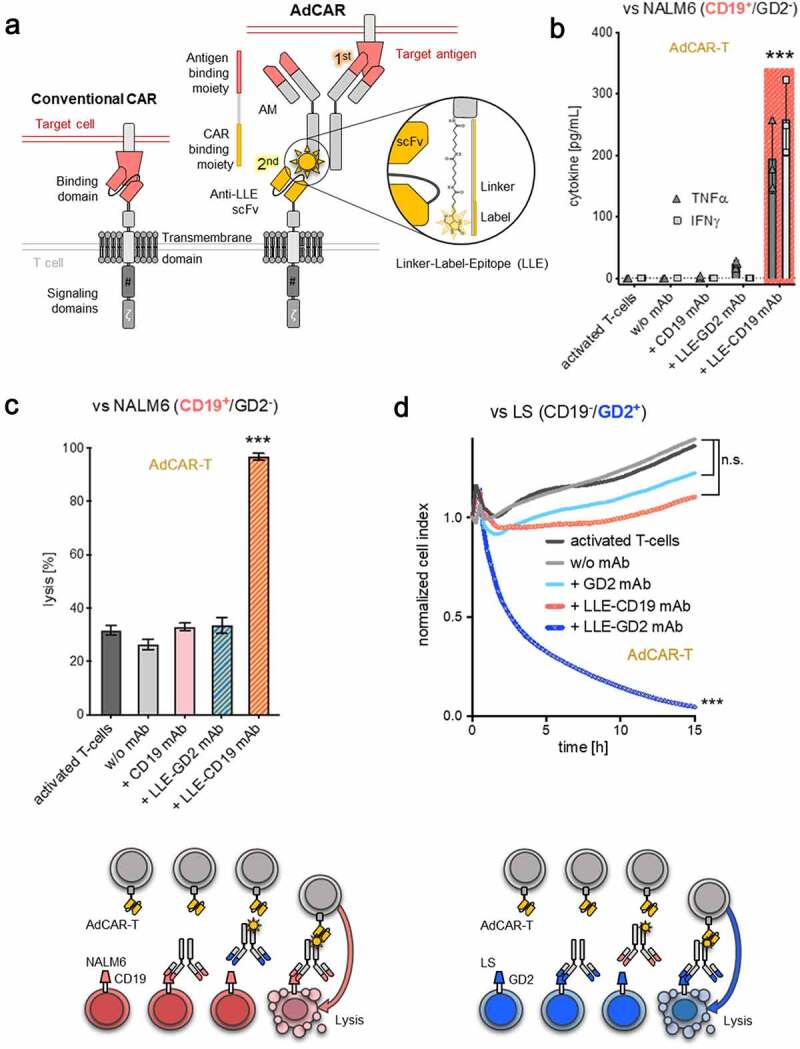
Figure 1.

Design and characterization of the AdCAR-T system
A) Schematic illustration of a conventional CAR (left panel) and the AdCAR-T system (right panel). B-C) AdCAR-T activation translates into specific cytokine production and target-cell lysis. AdCAR-T were incubated with the CD19+ ALL cell line NALM6 at an E:T ratio of 1:1 with or without 10 ng/mL of CD19 mAb (without LLE-tag), LLE-CD19 mAb or LLE-GD2 mAb. Cytokine levels in the supernatant were determined after 12 h (n = 3, p < .0001 for TNFα and IFNγ). Target-cell lysis after 24 h was determined by luciferase-based cytotoxicity assay (LCA). C-D lower panel) Schematic illustration of AdCAR-T specificity, eliminating CD19+ NALM6 or GD2+ LS target cells exclusively in the presence of the LLE-CD19 or LLE-GD2 mAb, respectively. D) AdCAR-T were incubated with the GD2+ neuroblastoma cell line LS at an E:T ratio of 1:1 with or without 10 ng/mL GD2 mAb (without LLE-tag), LLE-GD2 mAb or LLE-CD19 mAb. Target-cell lysis was determined by xCELLigence an impedance-based real-time cytotoxicity assay (ICA), that provides a real-time analysis (n = 3, p < .0001). Data shown in B) represent mean ± SEM of 3 independent experiments from 3 different donors. Data shown in C–D) represent mean ± SEM of (n = 4) independent experiments in triplicates from 4 different donors. In B–D) significance was determined by one-way ANOVA and Tukey post hoc test. (n.s.) not significant.
