

Abstract
Lockdowns imposed around the world to contain the spread of the COVID-19 virus and its variants had a differential impact on economic activity and jobs owing to differences in the ability to work remotely. This paper presents a new index of the feasibility to work from home to investigate which types of jobs are most at risk for 35 advanced and emerging market economies. Cross-country heterogeneity in the ability to work remotely reflects differential access to and use of technology, sectoral mix, and occupational selection. Workers least likely to work remotely tend to be young, without a college education, working for non-standard contracts, employed in smaller firms, and those at the bottom of the earnings distribution, suggesting that the pandemic has exacerbated inequality. Policies should account for demographic and distributional considerations both during the crisis and in its aftermath.
JEL Classification: D24, J22, J61, O30, R12, R32
Introduction
Social distancing policies implemented to contain the COVID-19 pandemic affected a large share of workers across the world. Millions of workers lost employment and countless jobs remain at risk as variants of the virus keeping economies from fully reopening.1 Workers in occupations requiring physical presence in the workplace or whose jobs require a high level of personal proximity have limited scope for working from home. Some of these workers face commensurately higher risk of reduction in hours or pay, temporary furloughs, or permanent layoffs. On the other hand, the pandemic accelerated the shift toward a hybrid workplace—a mixture of in-office and remote work— that provides more flexibility to both employers and employees. Which jobs are most at risk? How does the level of “tele-workability” depend on worker characteristics, such as age, educational attainment, gender, employment status, and earnings? Which jobs are more likely to benefit from hybrid work arrangements going forward? How does the feasibility to work remotely vary across advanced and emerging economies? Answers to these questions can inform the social protection and labor market policies needed to support workers both during and after the pandemic and curb rising income inequality.
We construct a new index of “tele-workability” for 35 advanced and emerging market economies using a task-based approach. We use two sources of data to develop a measure of tele-workability: occupation-level classification of feasibility of working from home derived by Dingel and Neiman (2020) for the United States (US) and individual-level data from the Programme for the International Assessment of Adult Competencies (PIAAC) produced by the Organization for Economic Co-operation and Development (OECD 2016). The latter has the advantage of measuring task or skill content at the worker level for a large sample of countries. Our estimation approach relies on an Expectation Maximization (EM) algorithm to map occupation-level measures of the feasibility of working at home to individual-level observations in the PIAAC dataset and derive predicted tele-workability scores for each worker. Individual-level scores allow us to conduct a more nuanced analysis of worker characteristics at the task level for a large group of countries. Given that PIAAC surveys are representative at the national level, we are able to capture differences in the ability to telework that are driven by underlying differences in job tasks, sectoral mix, demographic composition, and access to technologies necessary for teleworking across countries.
We find that workers least likely to work remotely are concentrated in the sectors hit hardest by the crisis (ILO 2020): accommodation and food services, transportation, and retail and wholesale sectors. Vulnerable workers tend to be young, without a college education, in less secure work arrangements (e.g., in part-time employment), and employed in small and medium enterprises (SMEs). Workers at the bottom of the earnings distribution are most at risk of earnings loss, suggesting that the COVID-19 crisis has exacerbated inequality. Cross-country heterogeneity reflects differences in the structure of production (e.g., size of manufacturing versus services sectors), use of technology, and occupational selection, and thus differential distribution of workers across jobs. Workers in emerging market economies are likely to face significant challenges during strict lockdowns given limited access to technology. Interestingly, differences in earnings and the ability to work remotely are less stark for those at the top and bottom of the earning distribution in emerging market economies compared to some advanced economies.
This paper contributes to the literature examining workers’ ability to perform their jobs from home and the labor market consequences. Evidence from the US (Dingel and Neiman 2020; Mongey et al. 2021; Hensvik et al. 2020) and several advanced European countries (Boeri et al. 2020; Fadinger and Schymik 2020; Office of National Statistics 2020) suggests that about 40% of jobs can be performed at home, ranging from 24% in Italy to 42% in Germany.2 In developing economies, up to 20% of urban population can work from home (Saltiel 2020; Gottlieb et al. 2020); this number is much smaller if rural populations are taken into account. These studies, with the exception of Saltiel (2020), use occupation-level data to examine labor market implications of social distancing policies. A drawback of this approach is that it assumes that tasks performed within occupations across countries, sectors, firms, and individuals are identical. Under this assumption, differences in levels of tele-workability across countries only stem from variation in the occupational distribution.
In this paper, we go beyond occupational classifications of feasibility of teleworking and leverage information on specific job tasks and socio-economic characteristics of workers, using comparable data for a large set of countries. A common approach in the literature that examines cross-country differences in the feasibility of working from home is to apply the index developed by Dingel and Neiman (2020) at the 6-digit SOC level using Occupational Information Network (O*NET) survey data from the US to 1- or 2-digit ISCO occupational level for other countries. This methodology assumes that all narrowly defined occupations within the single-digit occupational classifications have the same level of tele-workability which can substantially over- or under-state the level of tele-workability for a given individual. However, differences in tele-workability levels within a given occupation across countries depend crucially on the task content of work and the level of access to and use of information and communication technologies (ICT). Since our estimation approach accounts for heterogeneity of worker tasks within a given occupation, it sidesteps the assumption of equal tele-workability scores within each broadly defined occupation. For instance, compared to Gottlieb et al. (2020) who find that over 70% of managers and professionals can work from home when only occupation-level tele-workability is considered, we show that these occupations have a significantly lower level of tele-workability at about 42% when worker-level differences within occupations are accounted for.
Our paper is related to studies using worker-level data, including Saltiel (2020), Espinoza and Reznikova (2020), Hatayama et al. (2020), and Gottlieb et al. (2021). Our methodology and sample are most closely related to Espinoza and Reznikova (2020) and Hatayama et al. (2020) who also use worker-level data from the PIAAC survey to create indices of tele-workability. Our methodology has advantages over these studies since we use a richer set of information to derive our index for the PIAAC country sample. First, our approach relies on a broader set of variables at the worker level, accounting for not only work tasks but also differences in workers’ education, income, gender, age, and immigration status. These demographic characteristics have meaningful implications for the division of work responsibilities between individuals in similar occupations which can be teased out using the EM algorithm.
Second, while we leverage the work task variables from the PIAAC survey in a similar fashion as these papers, we capture a wider range of tasks. One key drawback of the PIAAC survey is the limited coverage of physical tasks.3 The intensity of physical work, however, is a critical determinant of ability to telework since such work is less likely to be carried out remotely. The O*NET data used by Dingel and Neiman (2020) include a wider range of questions to capture information on work responsibilities related to physical work, interpersonal interaction, and the use of specialized equipment pertinent for determining ability to telework. Hence, combining information on feasibility of teleworking from the O*NET occupational titles with the PIAAC survey allows us to leverage more detailed information regarding occupational characteristics and relate them to work task descriptions and demographic characteristics at the individual level.
Finally, in the same vein as Hatayama et al. (2020), we argue that a continuous measure of probability of tele-working contains more information than binary measures used by Espinoza and Reznikova (2020). A comparison of our index with the index derived by Espinoza and Reznikova (2020) shows that our composite index of tele-workability performs better at predicting actual employment outcomes in the aftermath of COVID-19 lockdowns in the US. In addition, a validation exercise shows that show that our index is highly correlated with changes in employment in 2020, even when controlling for sector and country characteristics and the effect of mitigating economic policies taken by governments during the pandemic.
This paper is structured as follows. The next section presents the data and methodology. Section 3 presents the aggregate index across countries, occupations, and sectors. Section 4 examines the role of individual characteristics; Section 5 presents a validation exercise, using realized employment and GDP data. Section 6 concludes.
Data and Methodology
We combine two sources of data to develop our measures for tele-workability: occupation-level classification of the feasibility of working from home derived by Dingel and Neiman (2020) for the US and worker-level data for 35 countries from the OECD’s PIAAC surveys.
Dingel and Neiman (2020) use O*NET survey data from the US to designate whether an occupation can feasibly be performed from home, based on information about “work context” and “generalized work activities.” Their index of tele-workability is constructed at the level of 6-digit SOC codes and takes on values of 0 (occupation cannot be done at home) or 1 (occupation can be done at home). The survey questions used for this classification capture information such as whether work is done outdoors, whether it requires use of specialized or protective equipment, requires physical activity, etc. For instance, if an average respondent in a given occupation reports using email less than once a week or reports that performing for and or working directly with the public is very important, the occupation is deemed as not suitable for teleworking.
Assessing the level of tele-workability at the occupational level, however, has a drawback in that it may be not suitable for comparisons across demographic groups and countries. Under this assumption, differences in the level of tele-workability between two group of individuals (e.g., younger and older workers), can only arise from differential selection into occupations. Consequently, this assumption obscures the differences that can arise from variation in job task composition or access to ICT. To address this drawback, we map the occupation level index to the individual level similar to Arntz et al. (2017) and Brussevich et al. (2019). Using individual-level data, allows us to account for the fact that individuals within the same occupation often perform different tasks.
To extend the index of tele-workability to a cross-country level, we use the OECD’s PIAAC database which collects nationally representative individual-level information for 35 advanced and emerging countries.4 This survey contains demographic data for workers and information on their occupations and sectors of employment. In addition, the survey captures detailed information on the nature of work activities, such as physical work associated with caregiving and manual labor, flexibility in performing tasks, flexibility in work hours, whether analytical or interpersonal tasks are performed (e.g., writing reports, solving complex problems, and negotiating with people), and use of technology or software in the workplace, among others (Table 1).
Table 1.
Relevant task and skill variables in PIAAC survey
| Survey question | Measure (range) |
|---|---|
| How often do you use internet to obtain work-related information at work? | Frequency (never—every day) |
| How often do you use programming language at work? | Frequency (never—every day) |
| How often do you use a computer for real-time discussions? | Frequency (never—every day) |
| How often do you use computer for email? | Frequency (never—every day) |
| How often do you work with spreadsheets? | Frequency (never—every day) |
| How often does your job require working physically for long? | Frequency (never—every day) |
| How often do you teach people at work? | Frequency (never—every day) |
| How often do you solve complex problems at work? | Frequency (never—every day) |
| How often do you make presentations at work? | Frequency (never—every day) |
| How often do you organize your own time? | Frequency (never—every day) |
| Can change your work hours? | Levels (not at all—to a very high extent) |
| Can you choose how you do your work? | Levels (not at all—to a very high extent) |
| Level of computer use at work | Levels (straightforward—complex) |
Source: PIAAC survey
Note: Frequency questionnaire items contain five responses: never, less than once a month, less than once a week but at least once a month, at least once a week but not every day, and every day. Levels of computer use at work include “straightforward,” “moderate,” and “complex.” The rest of the variables are measures on the following scale: “not at all,” “very little,” “to some extent,” “to high extent,” and “to very high extent.”
In order to combine the two data sources, we map occupational categories from the O*NET data to the PIAAC data. This allows us to relate tele-workability of occupations to job content and worker characteristics.5 PIAAC data contain occupational information at the 2-digit ISCO classification level, which is a higher level of aggregation than the 6-digit SOC codes in O*NET, resulting in one PIAAC occupation being potentially mapped to several values of tele-workability.6 We allow individual workers to be mapped to multiple indices of tele-workability, based on the crosswalk between the 6-digit SOC codes and the 2-digit ISCO codes (see Annex 1).
We use the iterative EM algorithm where individual-level data (demographic data and task characteristics) are regressed on associated values of the tele-workability index from Dingel and Neiman (2020), in order to find the model of best fit between worker characteristics and occupation level tele-workability using data for US workers only. Specifically, we estimate an individual-level regression:
where denotes individuals, denotes duplicates of these individuals when multiple values of Dingel and Neiman (2020)’s index are associated with one individual due to differences in the aggregation level of occupations, is the tele-workability score from Dingel and Neiman (2020), and contains N individual, job, and task characteristics from PIAAC. are parameters which capture the relationship between the individual level regressors and the tele-workability index. To run the EM algorithm, we use a set of individual characteristics (gender, education, income deciles, immigration status, and age) and a set of skills used in the workplace summarized in Table 1. We transform all frequencies into continuous measures indicating the number of days a person is engaged in a given activity per week.
We use a weighted Generalized Linear Model (GLM) for our estimation, with equal initial weights for all duplicates for individual . For each iteration of the regression, we compare the prediction from our estimated model with the occupation-level measure from Dingel and Neiman (2020) and recalculate the weights as per Ibrahim (1990):
where is the standard normal density. Once weights converge and best fit is achieved, the estimated parameters are applied to worker characteristics for all countries in the PIAAC sample, allowing us to estimate the probability of tele-workability across the full sample at the level of individual workers. The tele-workability index takes on values between 0 and 1, with higher numbers indicating greater feasibility of working from home. This index varies within occupations as well as across occupations, with within-occupation variation stemming from differences in task content between different workers as well as differences in their age, education, gender, income, and immigration status.
Cross-Country Evidence: Tele-workability Index, Occupations and Sectors
Averages of our individual-level tele-workability index across broadly defined occupations in Fig. 1 are consistent with the patterns documented by the original occupational-level index developed by Dingel and Neiman (2020) and a follow-up study on worker characteristics by Mongey et al. (2021) for the US. Elementary occupations (e.g., janitors, construction laborers, street vendors) are least able to work from home, followed by plant and machinery operators and craft and related trades workers (e.g., mechanics, garments workers). At the other end of the spectrum, professionals, managers, officials and legislators are the occupations most amenable to working from home. Overall, about 53% of variation in the tele-workability index at the individual level is explained by occupations, while the rest of variation is explained by other individual, sector- and country-specific characteristics.
Fig. 1.

Tele-workability by occupation
Figure 2 shows the distribution of the computed index score across different sectors. On average, workers with a lower scope for working from home are concentrated in accommodation and food services, transportation, wholesale and retail trade, health and social services, and manufacturing sectors. Within these sectors, however, essential activities in critical supply chains (food, pharmaceuticals, deliveries, healthcare, as well as some types of manufacturing) were exempt from lockdown restrictions in most countries. By contrast, sectors best suited for teleworking include information and communication, finance and insurance and professional services (e.g., legal services and scientific research), as they typically require less physical proximity and have higher reliance on digital technologies. As in the case of occupations, there is a negative association between the level of economic development and the feasibility to work remotely within a given sector. For instance, workers in Finland and Singapore have higher index scores even in less tele-workable sectors such as manufacturing and retail, which may be attributable to greater use of digital technologies in these countries.
Fig. 2.

Tele-workability by sector
Overall, there is significant cross-country variation in the scope to work remotely, with Turkey exhibiting lower tele-workability scores across most occupations, suggesting that fewer jobs can be performed at home. However, rankings across occupations are broadly preserved within our sample of countries. To further examine cross-country differences, Fig. 3 shows the association between the level of economic development, measured by the GDP per capita levels in 2017 constant international dollars, and the ability to work remotely (see Annex 2 for data description). Turkey, Chile, Mexico, Ecuador, and Peru stand out with significantly lower average tele-workability scores.7 This suggests that workers in emerging and developing economies face challenges in continuing to work during periods of stringent lockdowns. Within advanced economies, Greece, and Italy have among the lowest tele-workability scores, while Nordic countries and Singapore have the highest scores.
Fig. 3.

Tele-workability Index by GDP per capita (PPP)
We explore whether cross-country heterogeneity in tele-workability is driven by differences in countries’ level of digital connectivity. Using data on the percentage of population using the internet from the World Development Indicators (World Bank 2021), we find that internet use, which is key for working from home, is positively correlated with cross-country estimates of the tele-workability index (Fig. 4, left panel).8 Even in our sample of advanced and emerging market economies, only about 85% of population, on average, had internet access in 2019–2020. This figure is significantly lower in emerging market economies like Peru, Ecuador, Turkey, and Mexico, with less than 75% of population using the internet. Within Europe, Italy and Greece lag significantly behind their Nordic counterparts.
Fig. 4.

Internet usage, business connectivity and Tele-workability Index
The availability of an internet connection at home, however, may not be a sufficient condition for working remotely. We also correlate the tele-workability index with businesses’ internet connectivity (Fig. 4, right panel), measured by the average percentage of employees regularly using a computer with internet access in their work between 2012 and 2020 from the ICT Access and Usage by Businesses database (OECD 2021). We find a similar positive correlation between tele-workability and digital access in the workplace.9 In the accommodation sector in countries such as Turkey and Greece, for instance, less than 25% of workers had access to a computer with broadband internet connection at work at the onset of the pandemic. Lack of broadband infrastructure, limited investment in ICT, and high cost of broadband connection are potential drivers of the observed differences in firm uptake of digital technologies.
Who Holds Tele-Workable Jobs?
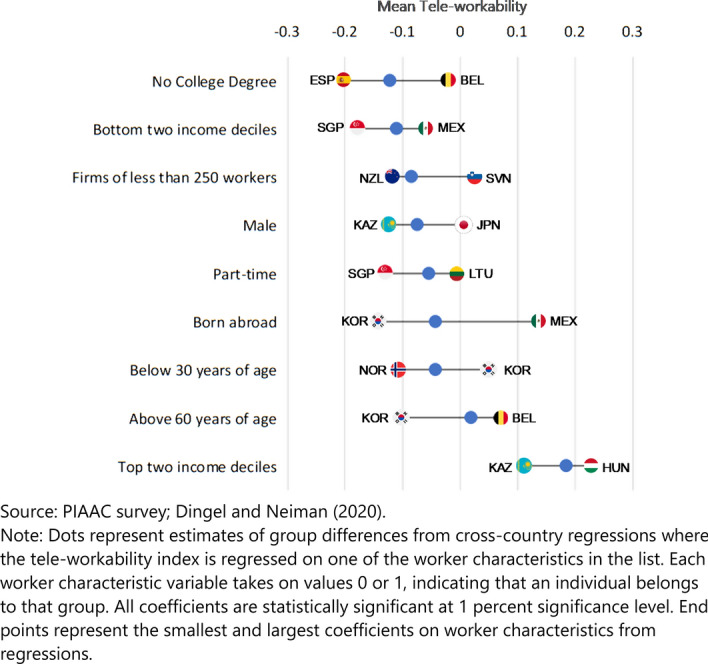
We next turn to an examination of the labor market implications of social distancing policies for specific categories of workers and the resulting implications for inequality, for the entire sample and in individual countries. To examine heterogeneity in tele-workability across demographic groups, we run a simple regression of the form:
where is an index ranging from 0 to 1 for an individual in country and a demographic variable of interest (gender, age, hourly earnings, whether born abroad, job stability, and firm size), and are country fixed effects. All demographic characteristics are expressed as binary variables and a positive coefficient indicates higher feasibility of working from home for a given group relative to its counterpart. We plot the point estimates for each of these characteristics in Fig. 5, ordering these attributes from the highest to the lowest point estimate, with ranges for different countries. Annex 4 presents country-level model estimates, and corresponding standard errors, estimated using interactions of each demographic variable with a country indicator variable to capture differences of each country from the full sample mean. Overall, our results suggest that risks of income and employment loss fall disproportionately on vulnerable groups of workers.
Fig. 5.
Tele-workability Index by worker characteristics
Gender
We find that men, on average, are less likely to be engaged in work activities that can be performed at home compared to women.10 This outcome is related to selection of men and women into occupations and sectors (Annex 5). Men, for instance, are more likely to work as plant and machine operators and crafts and trade workers, and in construction, transportation, and manufacturing sectors. Women’s employment is concentrated in the public sector and in the care and education sectors. This suggests that female workers could be less affected by lockdowns and social distancing measures in many countries.11 At the same time, female workers who lack access to adequate leave in case of sickness or disproportionately shoulder care responsibilities may have to cut down their activities or even leave their jobs entirely.12 Women could also be at greater risk of job loss if demand for accommodation and food services, tourism, and retail services, which account for a sizeable share of their labor force participation, particularly for low-skill workers, does not recover when social distancing measures are unwound. This is already borne out by data from the US, which shows that women’s labor market prospects were disproportionately affected by the crisis (BLS 2020).13
Age and Educational Attainment
Older workers (aged 60 and above), on average, are slightly more likely to hold jobs with a high tele-workability score as compared to younger workers (under 30). This result, however, varies significantly across countries, with more than a quarter of country coefficients being negative and statistically significant. In Asian countries (Korea, Singapore, Japan) and some emerging market economies (e.g., Kazakhstan, Mexico, Chile) older workers are less likely to be engaged in jobs amenable to teleworking. This reflects broad differences in adoption of automation technologies and educational attainment of workers across countries.
Workers without a college degree are significantly less likely to work in jobs that can be performed at home relative to their more educated peers. This result holds across most countries. For a given occupation, workers with low levels of educational attainment in Spain, Italy, Ecuador and Mexico have the lowest tele-workability scores. Comparing age profiles against sectors, this higher risk for young employees is consistent with the relatively younger age profiles of the most affected sectors, such as wholesale and retail and accommodation and food services.
We next evaluate differences in ability to work remotely by age and education together. On average, having a college degree greatly improves the likelihood of working remotely across all age groups (Fig. 6). However, older workers with lower levels of education still have higher levels of tele-workability, reflecting lifecycle effects as there is a natural progression into more senior-level occupations over a worker’s career. These findings also suggest that earnings and income gaps between generations that were exacerbated by the Global Financial Crisis (Dabla-Norris et al. 2019), could widen even further after the current crisis, with less educated, younger workers hit hardest in many countries.
Fig. 6.
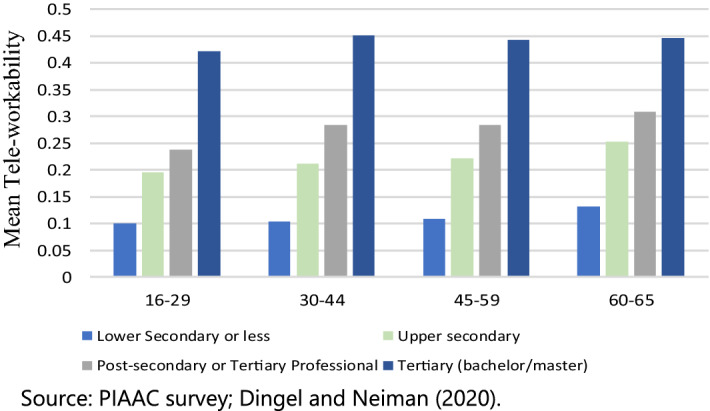
Tele-workability Index by age group and education level
Job Characteristics
Workers employed in part-time jobs are less likely to work remotely. Part-time workers in Singapore and Korea, in particular, have significantly lower tele-workability scores compared to those in full-time jobs. Within Europe, part-time contracts account for a sizeable fraction of total employment in Germany, UK and the Netherlands (OECD 2020b). This is particularly the case for sectors most affected by lockdowns. Part-time and temporary workers could thus be at greater risk of job loss as it is less costly for firms to shed workers hired under non-standard contracts. At the same time, they typically have limited protection against the risk of job or income loss because of lower contributions or lack of entitlement to paid sick leave, unemployment benefits, and other income support.
Workers in SMEs (with less than 250 workers), which account for close to 90% of jobs in our sample, are less likely to be in jobs that are amenable to teleworking compared to workers in larger enterprises. This may be a result of SMEs lagging behind larger firms in their adoption of digital technologies even in advanced economies.14 Differences in tele-workability scores for workers in SMEs as compared to larger firms, however, are less stark in many Eastern European countries. Overall, the risk of employment loss is higher in SMEs, as smaller firms also tend to be more liquidity constrained, have less of a capital cushion to continue paying furloughed employees, and may be less likely to survive the lockdown period. This is corroborated by recent firm surveys in OECD countries which find that half the SMEs already face severe cashflow problems, with many only having a few months reserves to withstand the crisis (OECD 2020a; Bartik et al. 2020).
Immigration Status
Foreign-born individuals, on average, are significantly more likely to belong to occupations which are less amenable to teleworking. They also often lack access to emergency assistance and social insurance. This difference is more marked in European countries than in the US. In Peru and Mexico, however, foreign-born workers have higher tele-workability scores, on average, potentially reflecting selection of higher-skilled immigrants in emerging market countries.
Earnings Distribution
The likelihood of working in an occupation that is amenable to teleworking is also very strongly correlated with worker’s hourly earnings, with workers in the bottom two deciles of the hourly earnings distribution significantly less likely to work remotely than workers in the top two deciles (Fig. 7). Not surprisingly, workers in the bottom earnings quintiles are concentrated in occupations and sectors where work cannot be plausibly done from home (Fig. 8a–b). Across countries, workers in the bottom deciles are also more likely to have lower financial buffers.
Fig. 7.

Tele-workability Index by hourly earnings decile
Fig. 8.

a Distribution of occupations across earnings quintiles. b Distribution of sectors across earnings quintiles
Individual-level estimates of the tele-workability index also allow us to evaluate the distributional implications of the lockdown policies across countries. For each country in the sample, we compute the ratio of average tele-workability levels between top and bottom earnings deciles (Fig. 9). While the average tele-workability score is significantly lower in Turkey than in Singapore, earnings disparity between top and bottom deciles is significantly higher in the latter. Similarly, disparities in the ability to work from home are much wider for workers in top and bottom earnings deciles in Hungary, Slovenia, Netherlands, and the US.
Fig. 9.

Differences in tele-workability between top and bottom earnings deciles across countries
Validation Exercise
In this section, we perform an external validity exercise by comparing the tele-workability index to economic outcomes in 2020. We use quarterly data to compute year-on-year changes (2020Q2 relative to 2019Q2) in GDP , employment and work hours at the trough of the COVID-19 crisis (see Annex 2 for data sources). GDP is defined at the country level and employment and work hours vary both by country and sector.15 We regress all three variables on the tele-workability index. Panel A in Table 2 presents the unconditional results. In Panel b, we control for country-level income differences, shares of services occupation and high-skilled workers as well as the COVID-19 economic support index from the Oxford COVID-19 Government Response Tracker (Oxford University 2021).
Table 2.
Tele-workability and Ex-post Measures of GDP and Employment Changes
| GDP (2019Q2-2020Q2 % change) | Employment (2019Q2-2020Q2 % change) | Work Hours (2019Q2-2020Q2 % change) | |
|---|---|---|---|
| a. Univariate | |||
| Tele-workability | 0.6 | 0.4*** | 0.2*** |
| (0.4) | (0.1) | (0.0) | |
| Constant | − 0.3*** | − 0.2*** | − 0.1*** |
| (0.1) | (0.0) | (0.0) | |
| b. Multivariate | |||
| Tele-workability | 0.1 | 0.2** | 0.04* |
| (0.6) | (0.1) | (0.002) | |
| log(GDP per capita) in 2019 | 0.05 | 0.1*** | 0.1*** |
| (0.0) | (0.0) | (0.0) | |
| Share of service occupations | 0.001 | 0.04 | 0.1*** |
| (0.0) | (0.0) | (0.0) | |
| Share of high-skilled workers | 0.001 | 0.001* | 0.0002 |
| (0.0) | 0.0 | (0.0) | |
| Economic support index | − 0.001 | 0.0002 | 0.0003 |
| (0.0) | (0.0) | (0.0) | |
| Constant | − 0.7* | − 1.7*** | − 1.6*** |
| (0.4) | (0.2) | (0.2) | |
| N | 35 | 549 | 525 |
Source: PIAAC survey; Dingel and Neiman (2020); IMF World Economic Outlook; ILO Labor Force Statistics; Oxford COVID-19 Government Response Tracker
Note: Robust standard errors are in parentheses. *** denotes significance at the 99% level, ** at the 95% level, and * at the 90% level
The results in Table 2 suggest that the tele-workability index is strongly correlated with realized sectoral employment changes during the pandemic. Even after controlling for the role of government-provided economic support, including employment retention policies, income support, debt relief during the pandemic, and the share of service occupations, we find both an economically and statistically significant relationship between the index and employment changes. In the case of country-level GDP changes, the relationship is not statistically significant, in part owing to the level of aggregation and to other confounding factors such as fiscal and monetary support packages implemented by countries. Overall, we conclude that the tele-workability index can serve as a reliable indicator of employment dynamics in response to government lockdowns during the pandemic. However, its predictive ability is limited when it comes to output losses at the aggregate level.
In Annex 6, we use the Current Population Survey (CPS) COVID-19 Supplement, containing realized data on work-from-home rates across different demographics groups in the US. We show that our index is highly correlated with the actual work-from-home rates during the pandemic and provides more precise predictions compared to the index based on the methodology employed by Espinoza and Reznikova (2020).
Conclusion
We develop a new index of the feasibility to work from home for 35 advanced and emerging economies. We show that there are significant differences in the scope to work remotely across countries. In emerging market economies such as Turkey, Peru, and Mexico access to and use of ICT is a key impediment to teleworking.
We show that workers who are most likely to be hit by the stringent social distancing policies implemented to stop the spread of the pandemic differ in their demographic and socioeconomic characteristics. Across countries, those with a low score on the tele-workability index tend to be the more economically vulnerable: workers that are young, with fewer years of education, engaging in part-time work, and with earnings toward the bottom of the distribution. Many of these worker characteristics coalesce in the hardest-hit occupations and sectors. These workers are also less likely to have access to health care and the formal insurance channels that can help them weather the crisis.
The impact of the COVID-19 pandemic on employment and the distribution of job losses across sectors and countries depends on the severity and duration of containment measures and the depth and breadth of economic contractions. Evidence from past crises suggests that job losses during severe recessions can have lasting, negative effects on future earnings and job security. The impact on low-income and precariously employed workers could be particularly severe, widening income inequality within countries. Changed household preferences following the COVID-19 outbreak, such as a shift to hybrid workplaces, greater reliance on e-commerce and altered tastes for goods and services, could also have a significant future impact on employment prospects and how work is carried out. For instance, a significant share of the demand for brick-and-mortar retail, tourism, dining out and personal services that is lost during the crisis may never return. Policy responses should appropriately account for these demographic and distributional considerations both during the crisis and in its aftermath.
Biographies
Mariya Brussevich
is an Economist in the Research Department at the International Monetary Fund.
Era Dabla- Norris
is an Assitant Director in the Asia Pacific Department of the International Monetary Fund.
Salma Khalid
is an Economist in the Western Hemisphere Department of the International Monetary Fund.
Annex 1: Occupational Classifications
| Occupation (ISCO 2 digit) | Occupation (ISCO 4 digit) |
|---|---|
| Professional | Science and engineering professionals |
| Health professionals | |
| Teaching professionals | |
| Business and administration professionals | |
| Information and communications technology professionals | |
| Legal, social and cultural professionals | |
| Technicians & assoc. prof. | Science and engineering associate professionals |
| Health associate professionals | |
| Business and administration associate professionals | |
| Legal, social, cultural and related associate professionals | |
| Information and communications technicians | |
| Legislators, senior officials, & managers | Chief executives, senior officials and legislators |
| Administrative and commercial managers | |
| Production and specialized services managers | |
| Hospitality, retail and other services managers | |
| Clerks | General and keyboard clerks |
| Customer services clerks | |
| Numerical and material recording clerks | |
| Other clerical support workers | |
| Crafts & trade | Building and related trades workers, excluding electricians |
| Metal, machinery and related trades workers | |
| Handicraft and printing workers | |
| Electrical and electronic trades workers | |
| Food processing, wood working, garment and other craft and related trades workers | |
| Service, shop, & market | Personal service workers |
| Sales workers | |
| Personal care workers | |
| Protective services workers | |
| Plant/machine operators | Stationary plant and machine operators |
| Assemblers | |
| Drivers and mobile plant operators | |
| Elementary | Cleaners and helpers |
| Agricultural, forestry and fishery laborers | |
| Laborers in mining, construction, manufacturing and transport | |
| Food preparation assistants | |
| Street and related sales and service workers | |
| Refuse workers and other elementary workers |
Annex 2: Data Sources
| Variable | Description and source |
|---|---|
| Occupation level index of tele-workability | Binary index for feasibility of working at home at the 6-digit Standard Occupational Classification (SOC) level (Dingel and Neiman 2020) |
| Worker level data on work-task characteristics, skills, demographic variables | Programme for the International Assessment of Adult Competencies (PIAAC) survey, Rounds 1-3 (2011–2017) (OECD 2016) |
| Gross Domestic Product (GDP) per capita | GDP per capita based on purchasing power parity (constant 2017 dollars). World Development Indicators (World Bank, 2021) |
| Percent of population using internet | Individuals who have used the internet from any location in the past 3 months (2020 or latest available), World Development Indicators (World Bank 2021) |
| Percent employees using a computer with internet access | Persons employed using a computer with internet access (as a percent of persons employed), OECD Model Survey on ICT Access and Usage by Businesses (2017–2021, or latest available) (OECD 2021) |
| Gross Domestic Product (GDP) | Nominal, quarterly GDP (constant prices). World Economic Outlook (IMF 2021) |
| Employment | Person of working age who were in paid employment or self-employment, economic activity (ISIC classification), ILO Labor Force Statistics (ILO 2021) |
| Work Hours | Mean number of working hours per week, by economic activity (ISIC classification). ILO Labor Force Statistics (ILO 2021) |
| COVID-19 Economic Support Index | Index between 0-100 which records economic policies such as income support to citizens and provision of foreign aid (Oxford University 2021) |
| Espinoza and Reznikova (2020) Index | Binary index for feasibility of teleworking (Espinoza and Reznikova 2020) |
| Worked remotely for pay due to COVID-19 pandemic | Monthly Current Population Survey (CPS), May 2020–June 2021 (Flood et al. 2021) |
Annex 3: Association Between Tele-workability and Measures of Internet Use
| (1) | (2) | |
|---|---|---|
| Univariate | ||
| Share of population using internet | 0.31*** | |
| (0.06) | ||
| Share of employees using internet at work | 0.44*** | |
| (0.1) | ||
| Constant | − 0.0002 | 0.02*** |
| (0.05) | (0.01) | |
| Multivariate | ||
| Share of population using internet | 0.12 | |
| (0.07) | ||
| Share of employees using internet at work | 0.41*** | |
| (0.02) | ||
| log(GDP per capita) in 2019 | 0.02** | − 0.05*** |
| (0.01) | (0.02) | |
| Share of service occupations | 0.15** | 7.01*** |
| (0.07) | (2.62) | |
| Share of high-skilled workers | 0.08** | 0.14*** |
| (0.03) | (0.03) | |
| Constant | − 0.23** | 0.48** |
| (0.11) | (0.19) | |
| N | 35 | 219 |
Source: PIAAC survey; Dingel and Neiman (2020); World Bank World Development Indicators; OECD ICT Access and Usage by Businesses
Note: In Column 1, the dependent variable is an average tele-workability index at the country level for 35 countries. In Column 2, the dependent variable is an average tele-workability index at the country and sector level for 23 countries and 10 sectors (data on computer use in the Finance sector is available only for 12 countries). Robust standard errors are in parentheses. *** denotes significance at the 99% level, ** at the 95% level, and * at the 90% level
Annex 4: Country estimates of tele-workability differences by worker characteristics
| Male | No College Degree | Below 30 years of age | Above 60 years of age | Bottom two income deciles | Top two income deciles | Born abroad | Firms of less than 250 workers | Part-time | |
|---|---|---|---|---|---|---|---|---|---|
| All Countries | − 0.069*** | − 0.115*** | − 0.038*** | 0.009*** | − 0.116*** | 0.181*** | − 0.067*** | − 0.078*** | − 0.057*** |
| (0.001) | (0.001) | (0.001) | (0.002) | (0.001) | (0.001) | (0.002) | (0.001) | (0.001) | |
| Austria | 0.022* | 0.060*** | − 0.009 | 0.023 | − 0.003 | 0.012 | − 0.005 | 0.032** | 0.041*** |
| (0.011) | (0.011) | (0.013) | (0.042) | (0.014) | (0.013) | (0.016) | (0.014) | (0.014) | |
| Belgium | 0.005 | 0.094*** | 0.018 | 0.060 | − 0.002 | − 0.012 | − 0.025 | 0.031* | 0.035** |
| (0.014) | (0.013) | (0.018) | (0.043) | (0.017) | (0.016) | (0.027) | (0.016) | (0.016) | |
| Canada | − 0.018*** | 0.006 | − 0.043*** | − 0.004 | − 0.026*** | − 0.002 | 0.066*** | − 0.010 | |
| (0.005) | (0.005) | (0.006) | (0.012) | (0.007) | (0.006) | (0.007) | (0.007) | ||
| Chile | − 0.011 | 0.050*** | 0.033*** | − 0.043** | 0.020* | − 0.010 | 0.017 | − 0.014 | 0.032** |
| (0.009) | (0.008) | (0.009) | (0.019) | (0.011) | (0.010) | (0.021) | (0.012) | (0.013) | |
| Cyprus | − 0.043 | 0.035 | 0.043 | − 0.068 | 0.038 | − 0.049 | 0.055 | 0.047 | 0.019 |
| (0.042) | (0.046) | (0.049) | (0.118) | (0.051) | (0.048) | (0.060) | (0.072) | (0.079) | |
| Czechia | − 0.002 | 0.026* | 0.034** | − 0.029 | 0.021 | − 0.012 | 0.017 | 0.054*** | 0.030 |
| (0.011) | (0.016) | (0.014) | (0.031) | (0.013) | (0.013) | (0.027) | (0.015) | (0.033) | |
| Germany | 0.025*** | 0.063*** | − 0.017*** | − 0.010 | 0.002 | 0.036*** | − 0.049*** | − 0.015*** | 0.024*** |
| (0.004) | (0.004) | (0.004) | (0.008) | (0.005) | (0.004) | (0.006) | (0.004) | (0.004) | |
| Denmark | 0.003 | 0.035** | − 0.065*** | 0.040 | − 0.028* | 0.012 | 0.013 | − 0.029* | 0.009 |
| (0.013) | (0.013) | (0.016) | (0.028) | (0.016) | (0.015) | (0.023) | (0.018) | (0.019) | |
| Ecuador | − 0.054*** | − 0.070*** | 0.024*** | − 0.049 | 0.025* | − 0.038*** | − 0.010 | − 0.022 | |
| (0.011) | (0.011) | (0.012) | (0.034) | (0.014) | (0.012) | (0.017) | (0.014) | ||
| Spain | 0.000 | − 0.092*** | 0.011 | 0.008 | 0.006 | 0.022*** | − 0.036*** | 0.015* | 0.005 |
| (0.006) | (0.005) | (0.008) | (0.017) | (0.007) | (0.007) | (0.008) | (0.008) | (0.008) | |
| Estonia | − 0.036 | 0.024 | 0.026 | − 0.008 | 0.006 | − 0.057* | − 0.002 | 0.031 | 0.048 |
| (0.029) | (0.030) | (0.035) | (0.059) | (0.036) | (0.034) | (0.046) | (0.046) | (0.058) | |
| Finland | − 0.005 | 0.058*** | − 0.045*** | 0.018 | − 0.010 | − 0.012 | − 0.008 | 0.001 | 0.003 |
| (0.014) | (0.015) | (0.018) | (0.028) | (0.017) | (0.016) | (0.034) | (0.020) | (0.025) | |
| France | − 0.017*** | 0.027*** | 0.029*** | 0.010 | 0.018*** | 0.021*** | − 0.019*** | 0.021*** | 0.022*** |
| (0.005) | (0.005) | (0.006) | (0.013) | (0.006) | (0.005) | (0.007) | (0.006) | (0.006) | |
| United Kingdom | 0.001 | − 0.001 | − 0.006 | − 0.008 | − 0.038*** | 0.045*** | 0.046*** | − 0.004 | − 0.003 |
| (0.005) | (0.005) | (0.005) | (0.011) | (0.006) | (0.005) | (0.007) | (0.005) | (0.006) | |
| Greece | − 0.008 | 0.013 | 0.013 | 0.026 | 0.050*** | − 0.027 | − 0.018 | 0.010 | − 0.010 |
| (0.015) | (0.015) | (0.019) | (0.052) | (0.018) | (0.017) | (0.023) | (0.026) | (0.021) | |
| Hungary | − 0.038*** | − 0.023** | 0.034** | − 0.035* | − 0.013 | 0.046*** | 0.080** | 0.001 | − 0.002 |
| (0.010) | (0.011) | (0.013) | (0.021) | (0.015) | (0.011) | (0.033) | (0.013) | (0.019) | |
| Ireland | − 0.006 | − 0.010 | − 0.010 | − 0.053 | − 0.011 | 0.000 | 0.025 | − 0.027 | − 0.035* |
| (0.017) | (0.017) | (0.020) | (0.046) | (0.021) | (0.020) | (0.021) | (0.022) | (0.020) | |
| Israel | − 0.028** | − 0.011 | − 0.049*** | 0.012 | − 0.024 | 0.009 | 0.023 | − 0.030* | − 0.013 |
| (0.013) | (0.015) | (0.014) | (0.026) | (0.016) | (0.015) | (0.015) | (0.016) | (0.016) | |
| Italy | − 0.028*** | − 0.089*** | 0.015** | 0.015 | 0.016** | − 0.014** | − 0.058*** | 0.011 | 0.037*** |
| (0.005) | (0.005) | (0.007) | (0.016) | (0.007) | (0.006) | (0.009) | (0.007) | (0.007) | |
| Japan | 0.084*** | 0.038*** | − 0.004 | − 0.059*** | 0.037*** | − 0.036*** | 0.088*** | − 0.028*** | − 0.032*** |
| (0.003) | (0.003) | (0.004) | (0.006) | (0.004) | (0.004) | (0.029) | (0.004) | (0.004) | |
| Kazakhstan | − 0.057*** | 0.023** | 0.079*** | − 0.059** | 0.053*** | − 0.071*** | − 0.003 | 0.049*** | 0.024 |
| (0.009) | (0.010) | (0.010) | (0.029) | (0.011) | (0.011) | (0.020) | (0.016) | (0.017) | |
| Korea | 0.050*** | 0.030*** | 0.088*** | − 0.118*** | − 0.004 | − 0.061*** | − 0.078*** | − 0.011 | − 0.050*** |
| (0.005) | (0.005) | (0.006) | (0.013) | (0.006) | (0.006) | (0.019) | (0.007) | (0.007) | |
| Lithuania | − 0.051** | 0.024 | 0.048** | − 0.010 | 0.024 | 0.007 | 0.015 | 0.038 | 0.050 |
| (0.020) | (0.020) | (0.024) | (0.043) | (0.024) | (0.023) | (0.052) | (0.027) | (0.036) | |
| Mexico | − 0.027*** | − 0.079*** | 0.033*** | − 0.049*** | 0.060*** | − 0.031*** | 0.203*** | 0.043*** | 0.033*** |
| (0.004) | (0.004) | (0.004) | (0.011) | (0.005) | (0.004) | (0.048) | (0.005) | (0.005) | |
| Netherlands | 0.022*** | − 0.057*** | − 0.045*** | 0.000 | − 0.058*** | 0.003 | 0.012 | − 0.003 | 0.049*** |
| (0.008) | (0.008) | (0.009) | (0.019) | (0.010) | (0.009) | (0.013) | (0.010) | (0.009) | |
| Norway | 0.024* | − 0.016 | − 0.071*** | 0.024 | − 0.032* | − 0.012 | 0.008 | − 0.006 | − 0.023 |
| (0.013) | (0.014) | (0.016) | (0.026) | (0.017) | (0.016) | (0.020) | (0.017) | (0.019) | |
| New Zealand | − 0.016 | − 0.023 | − 0.037** | 0.012 | − 0.031 | 0.028 | 0.083*** | − 0.041* | 0.006 |
| (0.016) | (0.016) | (0.018) | (0.031) | (0.020) | (0.018) | (0.018) | (0.022) | (0.020) | |
| Peru | 0.007 | 0.040*** | 0.057*** | 0.001 | 0.160*** | − 0.002 | 0.033*** | ||
| (0.005) | (0.005) | (0.006) | (0.011) | (0.040) | (0.013) | (0.006) | |||
| Poland | − 0.053*** | 0.011 | 0.038*** | − 0.017 | 0.003 | 0.004 | 0.145** | 0.062*** | 0.043*** |
| (0.006) | (0.009) | (0.007) | (0.016) | (0.007) | (0.007) | (0.069) | (0.008) | (0.012) | |
| Singapore | 0.004 | − 0.033** | 0.049*** | − 0.084*** | − 0.065*** | − 0.011 | 0.096*** | 0.003 | − 0.074*** |
| (0.016) | (0.015) | (0.019) | (0.031) | (0.019) | (0.018) | (0.018) | (0.017) | (0.028) | |
| Slovak Republic | − 0.027* | − 0.065*** | 0.052*** | − 0.003 | − 0.004 | − 0.018 | 0.065 | 0.070*** | 0.011 |
| (0.015) | (0.025) | (0.019) | (0.046) | (0.019) | (0.018) | (0.055) | (0.019) | (0.034) | |
| Slovenia | − 0.030 | 0.074*** | 0.007 | 0.060 | − 0.034 | 0.037 | − 0.071* | 0.102*** | 0.032 |
| (0.026) | (0.029) | (0.039) | (0.116) | (0.032) | (0.031) | (0.040) | (0.031) | (0.063) | |
| Sweden | 0.001 | 0.044*** | − 0.045*** | 0.017 | 0.003 | − 0.015 | 0.010 | 0.005 | − 0.008 |
| (0.010) | (0.011) | (0.013) | (0.019) | (0.013) | (0.012) | (0.015) | (0.013) | (0.013) | |
| Turkey | − 0.017*** | − 0.035*** | 0.038*** | − 0.001 | 0.055*** | − 0.046*** | 0.000 | 0.051*** | 0.016 |
| (0.006) | (0.005) | (0.006) | (0.032) | (0.007) | (0.006) | (0.034) | (0.008) | (0.014) | |
| United States | − 0.025*** | 0.002 | − 0.048*** | 0.071*** | − 0.044*** | 0.025*** | − 0.004 | − 0.014*** | − 0.029*** |
| (0.002) | (0.002) | (0.003) | (0.005) | (0.003) | (0.003) | (0.004) | (0.003) | (0.003) |
Note: Table contains estimates of country differences from regressions where tele-workability index is regressed on one of the worker characteristics, with an interaction term for the country capturing country differences from the full sample mean. Each worker characteristic variable takes on a value of 1, indicating whether an individual belongs to a given group, or 0. Blank cells are not estimated for a given country due to lack of variable availability in the data. Full sample of 35 countries contains 151,177 observations. Standard errors are in parentheses. *** denotes significance at the 99% level, ** at the 95% level, and * at the 90% level
Annex 5: Gender differences across sectors and occupations

Annex 6: Comparison of Tele-workability Index with Dingel and Neiman (2020) and Espinoza and Reznikova (2020)
First, we compare our tele-workability index to the country-specific shares of jobs that can be performed at home from Dingel and Neiman (2020). To compute these shares, Dingel and Neiman (2020) apply their US-based binary index of tele-workability to the country-specific data on occupational distributions from the ILO. The figure below shows that our index (y-axis) is highly correlated with the country-specific shares of jobs that can be performed at home (x-axis), based on the Dingel and Neiman (2020) index. This is not surprising, given that the EM algorithm we apply to construct our index incorporates the data from Dingel and Neiman (2020). However, the chart shows, that for several countries, including Turkey, Mexico, and Ecuador, our index predicts lower tele-workability levels than suggested by the Dingel and Neiman (2020) measure. This is also intuitive, given that their measure is US-based and, most likely, tends to overestimate the extent of workers’ ability to work from home in less developed countries.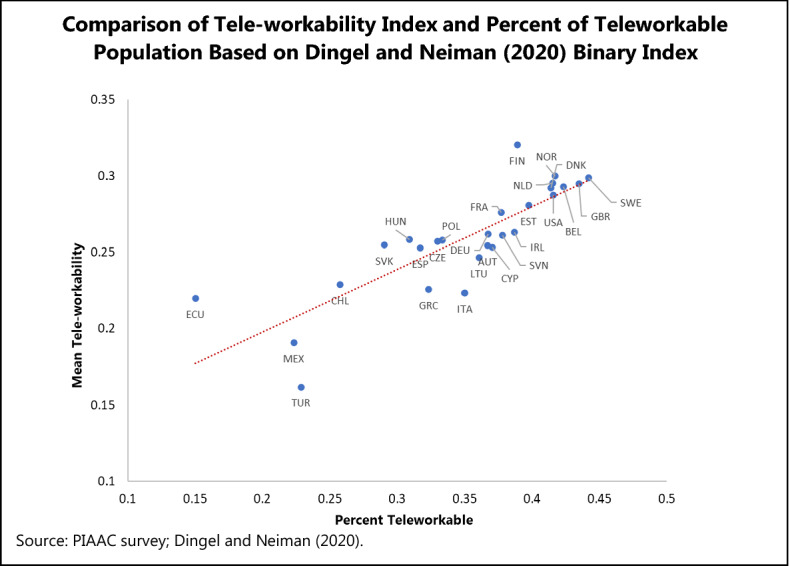
Second, we compare our index to another task-based binary measure of tele-workability. Our methodology for constructing the index of tele-workability is closest to the work of Espinoza and Reznikova (2020)–hereafter referred to as ER–who also use the PIAAC survey to create a binary variable to capture feasibility of teleworking at the level of individual workers. The ER index uses 12 PIAAC questions that measure job flexibility, use of ICT and reading and writing skills, and physical tasks at work, to generate a binary measure for whether or not an individual worker is able to telework.16 This allows them to assess tele-workability at the level of the individual worker at a cross-country level for the same PIAAC sample as ours, but using a different methodology which only employs work task characteristics.
We argue that our methodology has advantages over the ER index since we use a richer set of information to derive our index. While we leverage the work task variables that capture activities at the level of the individual worker in a similar fashion as ER, we further combine this information with occupational measures of tele-workability from Dingel and Neiman (2020). The level of detail regarding work characteristics that is captured in O*NET data is much richer than in the PIAAC survey. The intensity of physical work, or work which requires specialized equipment or physical interactions, is a critical determinant of ability to telework since such work is less likely to be carried out remotely. The PIAAC survey only has one question regarding the frequency of physical work, and no questions on the use of specialized equipment. The O*NET survey, on the other hand, has several detailed questions about physical and in-person work such as whether the work is done outdoors, uses specialized equipment, involves handling objects, performing activities directly with the public. We believe that these variables provide more nuance to our index of tele-workability regarding constraints that limit an individual from working remotely, despite having access to information and communication technology.
In addition to the occupation-level measure of tele-workability and task characteristics, our methodology also leverages demographic characteristics at the level of the individual worker. For the same occupation, there may be large differences in work type and work flexibility that are driven by gender, age or education attainment of workers which are not reflected in the responses to the 12 PIAAC questions used to create the ER index. Our EM algorithm allows us to recalibrate tele-workability scores for individual workers to account for these average differences across demographic groups. As such, we combine the information on tele-workability that can be gleaned from work tasks captured in the PIAAC with additional information on worker characteristics and occupational characteristics to create a composite index that accounts for more granular constraints to teleworking than a simple index based only on the PIAAC variables.
We recreate the ER index for our sample and directly compare how our index of tele-workability compares with the ER index. We find that the correlation between the two indices across the full sample is fairly high, but there is heterogeneity between the two indices when subsamples of different occupations are evaluated (see table below). Overall, based on responses to the PIAAC survey alone, the ER index predicts a higher likelihood of ability to telework than our index of tele-workability. The two indices coincide more in managerial, technical and professional occupations than for plant and machine operators and elementary occupations. This is intuitive insofar as the constraints to working remotely in the former are better captured by indicators of work flexibility and use of ICT. However, work characteristics of the latter occupations related to physical work, interpersonal interaction and use of specialized machinery or work in specialized settings are not precisely captured by the PIAAC variables. In these occupations we find the ER index underpredicts ability to telework.
| Correlations between Tele-workability Index and Espinoza and Reznikova (2020) Index | |||
|---|---|---|---|
| Samples | Correlation | Mean ER index | Mean Tele-workability Index |
| Full sample | 0.6935 | 0.2821 | 0.2603 |
| Male subsample | 0.6994 | 0.2416 | 0.2259 |
| Female subsample | 0.6926 | 0.2991 | 0.3014 |
| Occupation: Clerks | 0.5535 | 0.4921 | 0.346 |
| Occupation: Craft and trade workers | 0.5568 | 0.0559 | 0.1287 |
| Occupation: Elementary occupations | 0.4114 | 0.0187 | 0.108 |
| Occupation: Legislators, officials, managers | 0.5846 | 0.5523 | 0.4234 |
| Occupation: Plant/machine operators, assemblers | 0.4107 | 0.0463 | 0.1144 |
| Occupation: Professionals | 0.586 | 0.5326 | 0.4273 |
| Occupation: Service, shop, market sales workers | 0.4902 | 0.0999 | 0.1785 |
| Occupation: Technicians and associate professionals | 0.6161 | 0.4274 | 0.3356 |
We further evaluate how the two indices compare in predicting actual employment outcomes during the period of the pandemic-related lockdowns. We use data from the CPS COVID-19 Supplement for the US which collects monthly information on workers and their employment (Flood et al. 2021). Over the period from May 2020 to June 2021, CPS collected monthly information on whether or not the respondent had “worked remotely for pay due to COVID-19 pandemic.” We use this variable as a proxy measure for actual tele-workability of workers. CPS data are collected at the level of individual respondents. We must aggregate the data to a level that is common across both surveys in order to merge these data with the PIAAC survey, which is a distinct worker level sample. In order to relate the actual share of workers who worked remotely during the pandemic based on the CPS with our estimates, we calculate the probability of teleworking for population subgroups based on gender, age, education level, sector of employment and income quartile of workers in the CPS sample. This allows us to evaluate the probability of teleworking among, for instance, women who are 30–44, with lower secondary or less education, in the hospitality industry who belong in the bottom income quartile, based on the average probability of having reported remote work in this subsample in the CPS. We merge the actual work-from-home rates with the index of tele-workability and the ER index, along the same dimensions of gender, age, income, industry, and education. The table below demonstrates that our index of tele-workability performs better in predicting actual ability to work remotely, as captured in the CPS.
| Correlations between CPS estimates on probability of “remote working” and Indices of Tele-workability | |
|---|---|
| Correlation | |
| CPS data and Tele-workability Index | 0.7513 |
| CPS data and ER (2020) Index | 0.5798 |
Footnotes
Mongey et al. (2021), Boeri et al. (2020) and Fadinger and Schymik (2020) rely on occupation-level classifications of the feasibility of working from home similarly to Dingel and Neiman (2020) to derive country-level estimates. An alternative methodology adopted by Hensvik et al. (2020) and the Office of National Statistics (2020) relies on time-use and population surveys to estimate the share of workers able to work from home and produces similar results.
The PIAAC data only have one question on physical work. Annex 6 further describes data limitations of the PIAAC survey along the dimension of physical and contact-intensive work.
We use information from PIAAC surveys conducted in three rounds between 2011 and 2017.
Our analysis does not explicitly distinguish between “social" jobs which require face-to-face interaction for consumption and “essential" jobs which were not subject to government-mandated lockdowns.
We use a crosswalk between 6-digit SOC codes and 4-digit ISCO codes from the US Bureau of Labor Statistics (BLS). Annex 1 provides a correspondence between 2-digit and 4-digit ISCO codes.
For a subset of PIAAC countries, we perform a robustness check by recreating the country-level tele-workability index using sector-level tele-workability weighted by value added and labor share of each sector [from the EU KLEMS database (Stehrer et al. 2019)] in the respective countries. Our alternative estimates for country-level tele-workability averages very closely mirror the estimates from the PIAAC sample (results available upon request).
The correlation is statistically significant. When controlling for other country-level characteristics, including GDP per capita, share of service occupations, and share of skilled workers at the country level, the correlation between tele-workability and share of population with access to the internet remains positive but is no longer statistically significant. This is, in part, due to high correlation between the tele-workability and other controls and a limited sample size. Corresponding regression results are available in Annex 3.
The correlation between internet access at work and the level of tele-workability is strongly statistically significant when controlling for country and sector characteristics, including GDP per capita, share of service occupations, and share of skilled workers in a sector. Corresponding regression results are in Annex 3.
Japan is an exception as the coefficient on “Male” is positive implying females in the workforce are less tele-workable than men.
These results depend on the extent to which women have access to digital tools. Women’s jobs tend to be at higher risk in countries with a larger digital gender divide (see Brussevich et al. 2019).
Gender gaps in unpaid work are largest in Japan and Korea (2.5 h) and Turkey (4 h per day), where traditional norms on gender roles prevail (Alonso et al. 2019).
Data from the US show that the unemployment rate for women ages 16 and over rose from 3.4% in February 2020 to 16.2% in April 2020. This is 2.7 percentage points higher than the unemployment rate for men the same age (13.5%). The unemployment rates for women are now higher and have risen faster than the same rates for men across all age groups (BLS 2020).
In our sample, workers in larger firms are three times more likely to have a moderate or complex level of computer use than workers in firms with fewer than 250 employees.
We use data on employment for 35 countries in the sample for 18–21 sectors in 25 countries. Work hours data are not available for Ecuador. Sectors included in the sample are: agriculture, mining, manufacturing, electricity, water and sewage, construction, wholesale and retail, transportation, accommodation and food services, information and communication, finance, real estate, professional services, administrative services, public administration, education, health, arts and entertainment, other services, activities of households as employers, activities of extraterritorial organizations.
See Espinoza and Reznikova (2020) for details on index construction.
Publisher's Note
Springer Nature remains neutral with regard to jurisdictional claims in published maps and institutional affiliations.
Contributor Information
Mariya Brussevich, Email: mbrussevich@imf.org.
Era Dabla-Norris, Email: edablanorris@imf.org.
Salma Khalid, Email: skhalid@imf.org.
References
- Alonso, C., M. Brussevich, E. Dabla-Norris, Y. Kinoshita, and Kochhar. 2019. Reducing and redistributing unpaid work: Stronger policies to support gender equality. IMF working paper no.19/225.
- Arntz M, Gregory T, Zierahn U. Revisiting the risk of automation. Economics Letters. 2017;159:157–160. doi: 10.1016/j.econlet.2017.07.001. [DOI] [Google Scholar]
- Bartik, A.W., M. Bertrand, Z.B. Cullen, E.L. Glaeser, M. Luca, and C.T. Stanton. 2020. How are small businesses adjusting to COVID-19? Early evidence from a survey. NBER working paper 26989.
- Boeri, T., A. Caiumi, and M. Paccagnella. 2020. Mitigating the work-security trade-off while rebooting the economy. CEPR Covid economics 2.
- Brussevich, M., E. Dabla-Norris, and S. Khalid. 2019. Is technology widening the gender gap? Automation and the future of female employment. IMF working paper no. 19/91.
- BLS (Bureau of Labor Statistics). 2020. The employment situation—April 2020.
- Dabla-Norris, E., C. Pizinelli, and J. Rapppaport. 2019. Job polarization and declining of the young: Evidence from the UK. IMF working paper no.19/216.
- Dingel J, Neiman B. How many jobs can be done at home? Journal of Public Economics. 2020;189:1–8. doi: 10.1016/j.jpubeco.2020.104235. [DOI] [PMC free article] [PubMed] [Google Scholar]
- Espinoza, R. and L. Reznikova. 2020. Who can log in? The importance of skills for the feasibility of teleworking arrangements across OECD countries. OECD social, employment and migration working paper.
- Fadinger, H. and J. Schymik. 2020. The costs and benefits of home office during the COVID-19 pandemic: evidence from infections and an input-output model for Germany. CEPR Covid Economics 9.
- Flood, S., M. King, R. Rodgers, S. Ruggles, J. R. Warren and M. Westberry. 2021. Integrated public use microdata series, current population survey: version 9.0. Minneapolis, MN: IPUMS. 10.18128/D030.V9.0.
- Gottlieb, C., J. Grobovsek, and M. Poschke. 2020. Working from Home across Countries. CEPR Covid Economics 8.
- Gottlieb C, Grobovšek J, Poschke M, Saltiel F. Working from home in developing countries. European Economic Review. 2021;133:103679. doi: 10.1016/j.euroecorev.2021.103679. [DOI] [Google Scholar]
- Hatayama, M., M. Viollaz, and H. Winkler. 2020. Jobs' amenability to working from home: Evidence from skills surveys for 53 countries. World Bank policy research working paper, 9241.
- Hensvik, L., T. Le Barbanchon, and R. Rathelot. 2020. Which jobs are done from home? Evidence from the American time use survey. IZA discussion paper 13138.
- Ibrahim Joseph G. Incomplete data in generalized linear models. Journal of the American Statistical Association. 1990;85(411):765–769. doi: 10.1080/01621459.1990.10474938. [DOI] [Google Scholar]
- ILO (International Labor Organization). 2021. Labour force statistics. ILOSTAT.
- ILO (International Labor Organization). 2020. ILO monitor 2nd edition: COVID-19 and the world of work.
- IMF (International Monetary Fund). 2021. World economic outlook. Washington, DC.
- Mongey S, Pilossoph L, Wienberg A. Which workers bear the burden of social distancing? Journal of Economic Inequality. 2021;19:509–526. doi: 10.1007/s10888-021-09487-6. [DOI] [PMC free article] [PubMed] [Google Scholar]
- OECD (Organisation for Economic Co-operation and Development) Programme for the international assessment of adult competencies (PIAAC) Public Use Files, Paris: OECD Publishing; 2016. [Google Scholar]
- OECD (Organisation for Economic Co-operation and Development). 2020a. COVID-19: SME Policy Responses. OECD Centre for Entrepreneurship, SMEs, Regions and Cities.
- OECD (Organisation for Economic Co-operation and Development). 2020b. Part-time employment rate (indicator). 10.1787/f2ad596c-en.
- OECD (Organisation for Economic Co-operation and Development) ICT access and use by businesses (edition 2020) OECD Telecommunications and Internet Statistics (database) 2021 doi: 10.1787/851be3c1-en. [DOI] [Google Scholar]
- Office of National Statistics. 2020. Coronavirus and homeworking in the UK Labour Market: 2019.
- Oxford University. 2021. Coronavirus government response tracker. Blavatnik School of Government.
- Saltiel, F. 2020. Home working in developing countries. CEPR Covid economics 7.
- Stehrer, R., A. Bykova, K. Jager, O. Reiter, M. Schwarzhappel. 2019. Industry level growth and productivity data with special focus on intangible assets. The Vienna Institute for International Economic Studies.
- World Bank. 2021. World Development Indicators. Washington, DC.