


Abstract
Purpose
Does re-biopsy of blastocysts classified as abnormal (ABN) due to segmental aneuploidy (SA) have clinical utility?
Methods
The live birth (LB) outcomes of mosaic SAs, compared to other categories, were determined after transfer of 3084 PGT-A tested blastocysts. An initial 12-month trial thawed 111 blastocysts classified as ABN due to a SA for clinical re-biopsy, with an additional 58 from a subsequent 16-month revised protocol. Where re-biopsy failed to corroborate the original classification, blastocysts were reported as mosaic and suitable for clinical use.
Results
Segmental mosaics had a LB rate (54.1%) which was indistinguishable from that of euploid (53.7%). Numeric mosaics had statistically significant (P < 0.05) reduced LB rates compared to euploid, with high-level numerics (19.2%) also exhibiting a significant reduction compared to low level (42.3%). Of the initial 111 blastocysts with SAs, 85 could be re-biopsied. Segmental gains became suitable for re-biopsy at a high rate (90.9%), with 84.2% (16/19) of these reclassified as mosaic. Only 73.0% of deletions and complex changes were suitable for re-biopsy, of which 73.0% (46/63) were confirmed ABN. The subsequent 16-month period primarily focused on gains, confirming the high rate at which they can be reclassified as clinically useable.
Conclusions
Blastocysts harboring mosaic segmental duplications, rather than SAs in general, are the primary source of false-positive PGT-A results and represent a category with a LB rate similar to that of euploid. A high degree of confidence in the reliability of PGT-A results can be maintained by performing confirmatory clinical TE biopsies.
Supplementary Information
The online version contains supplementary material available at 10.1007/s10815-022-02487-z.
Keywords: Mosaicism, Preimplantation genetic testing, Segmental aneuploidy, False positives, Clinical re-biopsy
Introduction
A SA is defined as a gain or loss of a fragment less than an entire or “numeric” chromosome. Approximately 3% of blastocyst TE biopsies are classified as ABN due to a SA identified by PGT-A when performed by NGS [1]. This mirrors the relatively low detection rate of SAs in clinical pregnancies and liveborns [2–4]. Embryos categorized as ABN due to a SA are generally not considered suitable for transfer, due to the risk of serious developmental delays and congenital defects [5]. However, we reported that PGT-A can incorrectly classify some mosaic SAs as ABN [6], which has subsequently been confirmed by several other groups [1, 7, 8]. Thus, in a minority of cases, it would appear that potentially viable embryos are being discarded. In comparison, when the abnormality involves a numeric chromosome, very high concordance rates between TE biopsy and the rest of the blastocyst, including the inner cell mass (ICM), have been observed [9]. Although there were initial suggestions that SAs may not be of biological origin, but instead be testing or biopsy artifacts [10], a considerable body of evidence now indicates that this is not the case. In particular, the confirmatory biopsies performed in the above studies frequently found evidence of the SA present elsewhere in the embryo. Furthermore, FISH on individual cells confirmed the authenticity of all SAs identified in 39 blastocysts by NGS, with the majority of embryos (66.7%) found to also contain cells without the SA [11]. Thus, although SAs are unlikely to be biopsy or testing artifacts, a single TE biopsy is not a reliable indicator as to whether an embryo is ABN or mosaic for a SA.
In contrast to their relatively small contribution to ABN embryos, SAs represent approximately 40% of all mosaic findings [7]. Reports to date indicate mosaic SAs have a superior success rate compared to other mosaic categories [12–14]. Given the widespread adoption of PGT-A, it is important to address potential sources of error, as well as maximize the clinical utility of the results obtained by improving our understanding of mosaicism. This study contributes to these goals by confirming that the principal source of PGT-A false positives is mosaic SAs, which if not misclassified would have had excellent LB potential. The utility of a clinical confirmatory re-biopsy program was investigated and a modified protocol proposed that restricts clinical re-biopsy to the subtypes of SAs most frequently reclassified as mosaic.
Materials and methods
PGT-A
VeriSeq (Illumina) NGS libraries were generated and sequenced on a MiSeq instrument following the manufacturer’s protocol and the data imported into Bluefuse Multi Software (Illumina) for interpretation by two independent analysts. To control for possible influences of embryo culture, biopsy, and whole genome amplification (WGA), validation of SA detection limits utilized clinical TE biopsy samples that were unbalanced for known translocations and which had previously been analyzed by array CGH (Agilent SurePrint G3 8 × 60 k microarray customized with increased probe density in the 10 Mb regions immediately adjacent to each telomere, q arm only for acrocentric). SAs ≥ 10 Mb performed similarly to numeric abnormalities, with shifts ≥ 80% classified as ABN (Supplementary Table 1). For SAs less than 10 Mb, conservative calling guidelines were adopted such that for high-quality VeriSeq profiles, those between 5 and 10 Mb were reported as ABN where an average shift > 60% was observed, whereas SAs ≤ 5 Mb were considered ABN when the average deflection was ≥ 50%. To determine segmental mosaicism detection limits, a separate series of unbalanced translocations were titrated with NAD (no abnormality detected) samples of the opposite gender (Supplementary Fig. 1). In most cases, mosaic SAs could be reliably detected down to a size of 20 Mb when they comprised ≥ 20% of the sample (Supplementary Table 2). Numeric chromosomes in the titrations (predominantly sex chromosomes) were visible down to the 10% level and were all within 5% of the expected value. For clinical biopsies, numeric and segmental abnormalities were classified as low-level mosaic when detected in the range of 20–40% and high-level from > 40 to < 80%. The suggestion that mosaic SAs can be an artifact introduced by the NGS library building process [15] was countered by the parallel aCGH analysis, as well as the observation that essentially identical PGT-A profiles were observed when duplicate NGS libraries were generated from 56 WGA samples containing mosaic SAs (Supplementary Fig. 2).
Discordant results obtained for numeric aneuploidies following re-biopsy were investigated by comparing parental DNAs with the original and re-biopsy WGA samples using SNP (HumanKaryomap-12) and STR genotyping profiles, which were analyzed according to the recommendations of the supplier (Illumina), or as described previously [16], respectively.
Patients and embryos
The 14,075 embryos where biopsy and PGT-A analysis by NGS occurred were derived from 5130 IVF cycles initiated from January 2016 to June 2020 at six Genea clinics. Samples that underwent parallel PGT-M were included, whereas those with a treatment indication for PGT-SR, or which involved donor and/or previously frozen oocytes, were excluded. Embryos were cultured in Geri time-lapse incubators following the manufacturers’ instructions (Genea Biomedx). Blastocyst biopsy and vitrification were performed on days 5 and 6 following a standard protocol in all centers as previously described [17, 18] with all biopsy samples shipped to a core PGT facility for testing. Consistency of biopsy technique between centers was maintained by standardized training and rotation of staff between centers. ICM and TE quality were scored using a modified Gardner system, with blastocysts then assigned to 4 categories (1: 1–1, 2: 1–2 and 2–1, 3: 2–2, or 4: the remainder). Grade 4 embryos were only biopsied if there were sufficient TE cells. During the initial study period from January to November 2016, all mosaic shifts ≥ 20% were reported to patients. Subsequently, a protocol change was made to only report > 40% mosaicism, although all findings ≥ 20% continued to be recorded in an internal database. Genetic counseling was mandatory prior to the transfer of any embryo with reported mosaicism. All embryos included in this study were classified into internally derived categories broadly based on the published PGDIS guidelines [15]. Retrospective pregnancy data derived from the NGS tested embryos described above was restricted to 3084 single embryo transfers that had complete outcome data available and where the age of the female patient at time of oocyte retrieval was less than 44 years.
The initial cohort of embryos subjected to clinical re-biopsy consisted of all embryos during a 12-month period from September 2019 to August 2020 that were deemed ABN on the basis of one or more SA shifts of 80% or more. The subsequent cohort of embryo re-biopsies from September 2020 to December 2021 was limited primarily to segmental gains.
Ethics
Signed patient consent was obtained for reconfirmation biopsies that were performed on ABN embryos and for the clinical re-biopsy of SAs. Ethics approval was granted by our internal Human Research Ethics Committee (GEC0035).
Data analysis/statistics
A biochemical pregnancy was defined as a beta hCG measurement ≥ 50 mIU/ml at 11 days post transfer, a fetal heart pregnancy (FHP) as detection of a fetal heart beat on ultrasound from 7 weeks post transfer and a LB as the birth of an infant at greater than 20 weeks gestation. A subclinical miscarriage (SCMC) was considered to have occurred when a biochemical pregnancy did not result in a FHP, and a clinical miscarriage (CM) was recorded when a FHP did not progress to a LB. Using LB as the outcome, logistic regression analysis was performed on the entire set of 3084 transfers to identify factors likely to have a statistically significant influence. Comparisons between groups were made using the chi-square test, or where sample number was < 50 Fisher’s exact test for significance. Continuous data is expressed as mean ± SD, and means were compared by way of the t-test. Statistical analyses were performed using MedCalc Statistical Software version 17.6 (MedCalc Software bvba, Ostend, Belgium). A P value < 0.05 was considered statistically significant.
Results
Non-clinical re-biopsies indicate a high overall concordance rate
To investigate potential sources of PGT-A false positives, embryos classified as ABN and scheduled for discard were thawed to obtain a TE re-biopsy sample, or for high-quality blastocyst duplicate samples, which were then reanalyzed by NGS. For numeric aneuploidies (145 re-biopsies from 78 embryos), the original abnormalities were observed in all but one sample. For the sole exception (tetrasomy 2 and trisomy 5), the genotypes of the original and re-biopsy samples were then compared to parental controls using simple tandem repeats (six informative markers distributed along the length of each chromosome) and the karyomapping SNP platform. No evidence of a third allele on either chromosome was observed in any of the biopsy samples. As chromosomes 2 and 5 are large, recombination events would be expected to result in either meiosis I or II trisomy errors being readily detectable by genotyping. Hence, the single discordant result was considered to be due to a mitotic error.
In the case of embryos classified as ABN due to a SA, multiple re-biopsy samples, one of which included the ICM, were obtained for each of four embryos. For two embryos, all re-biopsy samples (4/4 and 6/6) contained the originally identified SA. However, discordant results were obtained for the other two embryos, where several (2/4 and 4/5) of the re-biopsy samples returned a NAD result, including both the ICM-containing samples. Given the low concordance rate of re-biopsies from SA compared to numeric aneuploidies, our further investigation of strategies to reduce the rate of PGT-A false positives focused on SAs.
SAs in clinical PGT-A
The impact of a potential high rate of false positive SA results was assessed by determining the proportion of SAs in a dataset of 14,705 embryos subjected to NGS testing from 2016 to 2020. Of the 34.6% of embryos reported as ABN, 9.2% (3.2% of the total) was due solely to a SA, with another 5.6% (1.9% of total) exhibiting both segmental and numeric aneuploidies (Fig. 1a; Supplementary Table 3). With few exceptions, the number of ABN SAs was in proportion to the interrogable size of each chromosome (Fig. 1b). Within the 20.4% of embryos classified as mosaic (Fig. 1a; categories B2, B3, and C), 40.2% of these were solely due to mosaic SAs (group B2), with a further 14.2% of mosaic samples containing both numeric and segmental changes (Supplementary Table 3; groups B3 + SA and C + SA). Thus, 54.4% of all mosaic embryos contained at least one segmental change. A clear preponderance of deletions over duplications was observed in both the ABN and mosaic SA groups (Fig. 1a). Interestingly, compared to the average female age of NAD (group A) embryos, a small (0.8 year) but highly significant (P < 0.0001) increase in age was observed for > 40% numeric mosaics (group C), but not the 20–40% (group B3) numeric mosaics (Supplementary Table 3).
Fig. 1.
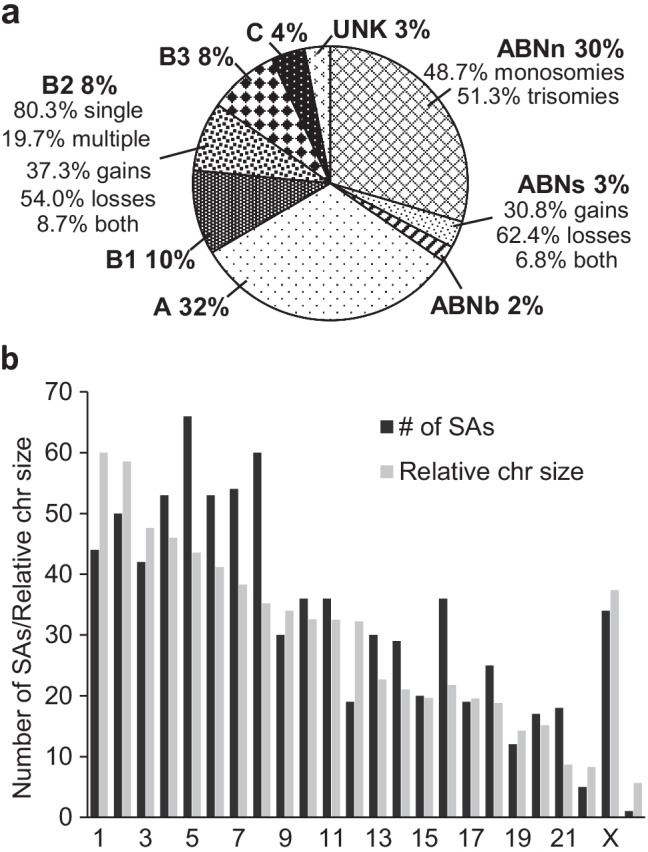
Abnormal and mosaic results from PGT-A embryos. a Percentage of 14,705 PGT-A tested embryos that were classified as ABNn (one or more numeric abnormalities), ABNs (one or more SAs), ABNb (numeric + SAs), A (NAD; no abnormality detected), B1 (noisy/mosaicism < 20%), B2 (mosaic SAs 20– < 80%), B3 (numeric mosaicism 20–40%), C (numeric mosaicism > 40– < 80%), or UNK (no result). The percentages of B2 samples with single or multiple SAs are indicated. For the ABNs and B2 categories, “both” refers to the percentage of samples that contained at least one gain as well as at least one loss. b For the ABN category, the number of SAs detected (black) is generally in proportion to the size of each chromosome (grey), with the relative chromosome size derived from the number of Mbs for which VeriSeq NGS produces mappable data
Excellent live birth outcomes for group B2; low- and high-level mosaic SAs
To further gauge the significance of a mosaic SA generating a false positive result, we compared outcome data after transfer of 3084 NGS tested embryos (Table 1) where PGT-A results had been ranked by a mosaic classification system. Statistically significant (P < 0.05) reduced LBs were observed for both low-level (group B3; 42.3%) and high-level (group C; 19.2%) numeric mosaics compared to NAD embryos (group A; 53.7%). The utility of a mosaic ranking system was further demonstrated by the significant (P = 0.023) reduced LB rate of high-level compared to low-level numeric mosaics. The reduction in LBs for numeric mosaics principally occurred prior to FHP, either at implantation or as a SCMC (Table 1). In contrast to the numeric mosaics, there was no statistical difference in the LB rates between the SA and NAD groups (Table 1; groups B2 vs A), or for comparisons of high-level versus low-level mosaic SAs, single versus multiple SAs, gains versus losses, or when the ≤ 40% numeric B3 group was subdivided into single and multiple categories (Supplementary Table 4).
Table 1.
Mosaic pregnancy outcomes
| Group | A | B1 | B2 | B3 | C |
|---|---|---|---|---|---|
| Description | NAD (high quality PGT-A profiles) | Noisy/mosaicism < 20% | 20–79% segmental mosaicism | 20–40% numeric chr ± segmental | 41–79% numeric chr ± segmental |
| Age | 35.6 ± 3.8 | 35.9 ± 3.9 | 36.1 ± 3.9a | 35.7 ± 3.8 | 37.0 ± 3.1 |
| Day 6 biopsy (%) | 33.7 | 41.0b | 38.2 | 44.8b | 61.5b |
| Grade 1 | 14.5% (312) | 11.8% (53) | 11.6% (24) | 7.5% (18) | 3.8% (1) |
| Grade 2 | 25.8% (558) | 24.6% (111) | 22.7% (47) | 24.1% (58) | 3.8% (1) |
| Grade 3 | 51.7% (1116) | 52.8% (238) | 53.6% (111) | 52.7% (127) | 53.8% (14) |
| Grade 4 | 8.0% (173) | 10.9% (49) | 12.1% (25) | 15.8% (38) | 38.5% (10) |
| Transferred | 2159 | 451 | 207 | 241 | 26 |
| PGT-M | 218 (10.1%) | 58 (12.9%) | 13 (6.3%) | 22 (9.1%) | 2 (7.7%) |
| + ve bHCG | 65.5% (1413) | 61.4% (277) | 64.7% (134) | 56.0% (135) | 38.5% (10) |
| SCMC | 13.2% (186/1413) | 13.4% (37/277) | 12.7% (17/134) | 20.0% (27/135) | 40.0% (4/10) |
| SCMC P < 0.1 | A vs B3: 0.028b, A vs C: 0.013b, B1 vs B3: 0.081, B1 vs C: 0.018b, B2 vs C: 0.019b | ||||
| + ve FHP | 56.8% (1227) | 53.2% (240) | 56.5% (117) | 44.8% (108) | 23.1% (6) |
| CM | 5.5% (68/1227) | 3.8% (9/240) | 4.3% (5/117) | 5.6% (6/108) | 16.7% (1/6) |
| CM P < 0.1 | |||||
| LB rate | 53.7% (1159/2159) | 51.2% (231/451) | 54.1% (112/207) | 42.3% (102/241) | 19.2% (5/26) |
| LB P vs A | – | 0.34 | 0.91 | 0.0008b | 0.0005b |
| Other LB P < 0.1 | B1 vs B3: 0.026b, B1 vs C: 0.0015b, B2 vs B3: 0.013b, B2 vs C: 0.008b, B3 vs C: 0.023b | ||||
bHCG positive bHCG, FHP fetal heart pregnancy, SCMC sub-clinical miscarriage (bHCG-FHP), CM clinical miscarriage (FHP-LB), LB live birth
aP < 0.05 vs group A (t-test), all other age comparisons were not significant
bP < 0.05 (chi-square) versus group A unless stated otherwise
As the high-level (group C) numeric mosaics in particular had a higher proportion of poorer grade blastocysts and day 6 biopsies (Table 1), logistic regression analysis of the pregnancy outcome data were performed. This indicated that female age (P = 0.69) did not have a statistically significant impact on LB outcomes, whereas the mosaic transfer category (P = 0.002), day of biopsy (P < 0.0001), and blastocyst grade (P = 0.005) did. Thus, frequency matching was performed to ensure the percentage of day 6 biopsies, as well as the proportion of blastocysts in each grade category, was consistent across all mosaic groups. The matched data confirmed the excellent LB rate of the SA group, as well as the statistically significant differences between the NAD, low-level and high-level numeric groups (Supplementary Table 5).
Clinical re-biopsy of SAs
Given the excellent mosaic SA LB rates and the evidence that SAs are the only meaningful source of false positives in PGT-A, we investigated how this information could be exploited in a clinical setting. To this end, we modified our clinical practices and patient consents so that for a 12-month period, any embryo classified as ABN solely on the basis of a SA was automatically subjected to thaw and a second round of biopsy and vitrification to obtain a confirmatory TE biopsy sample. The percentage of ABN cells from the two PGT-A results was averaged, such that if the second TE sample returned a NAD result, the embryo was reclassified to be 50% mosaic for the original SA and considered available for clinical use.
Based on the type(s) of SAs identified in the original TE sample, the 111 embryos that were thawed for confirmatory biopsies were assigned to either a simple loss, simple gain, both (a full segmental loss and gain on the same or different chromosomes), complex loss, or complex gain group (Fig. 2a), with complex being defined as additional mosaic changes involving the same chromosome, or a SA of the same type on a different chromosome. The SAs all exhibited shifts of at least 80% and were highly variable in size, ranging from 4 to 180 Mb and consisted of a total of 46 duplications with an average size of 52.4 ± 46.4 Mb and 78 deletions with an average size of 46.1 ± 33.8 Mb (Supplementary Table 6). Post warming 85 of the previously biopsied embryos (76.6%) became suitable for re-biopsy (Table 2). Of the 26 SA embryos that could not be re-biopsied, one did not survive thaw, 14 degenerated during culture, and the TE of 11 did not meet the minimum criteria for biopsy. The percentage of poor-quality embryos present in the SA cohort (23.4%; 26/111) was not significantly higher than that of the overall PGT-A group (17.3%). The 90.9% re-biopsy rate of the simple gain group was clearly superior to all other SA groups (Table 2). It was also apparent that embryos with SAs originally biopsied on day 6 with a poor TE grade were a lot less likely to become suitable for re-biopsy (Fig. 2b). The average size of the original SA was not a contributing factor in the capacity of an embryo to become suitable for re-biopsy (discarded: 51.9 ± 36.0 Mb, re-biopsied: 55.5 ± 45.2 Mb).
Fig. 2.

Clinical re-biopsy of embryos harboring SAs. a Examples of SAs, illustrating a simple gain on chromosome 2 (top), complex losses on chromosome 5 (middle), and both (a full gain and loss) on chromosome 8 (bottom). b Proportion of thawed embryos for which a re-biopsy result was not obtained (stripped), were confirmed ABN (stippled), or were reclassified as mosaic (white), stratified by TE grade and day of the original biopsy, which indicated poor survival and a high rate of concordance for day 6 TE3 embryos in particular. The number of embryos in each category is indicated. c Thawing/clinical re-biopsy results demonstrating the high percentage of simple gains reclassified as mosaic (white) and the small proportion confirmed ABN (stippled) or discarded (stripped) compared to the other four SA subgroups. d The number of thawed SAs and those reclassified as mosaic (white) or confirmed ABN (stippled) is broadly in proportion to the size of each chromosome
Table 2.
Clinical rebiopsy of SA blastocysts
| Simple loss | Complex loss | Simple gain | Complex gain | Both (loss + gain) | Total | |
|---|---|---|---|---|---|---|
| No. of thawed (% of total thaws) | 31 (27.9%) | 34 (30.6%) | 22 (19.8%) | 13 (11.7%) | 11 (9.9%) | 111 |
| Did not become suitable for rebiopsy (%) | 10 (32.3%) | 9 (26.5%) | 2 (9.1%) | 3 (23.1%) | 2 (18.2%) | 26 (23.4%) |
| No call from rebiopsy | 0 | 1 | 1 | 0 | 1 | 3 |
| New result obtained (% of thaws) | 21 (65.7%) | 24 (70.6%) | 19 (86.4%) | 10 (76.9%) | 8 (72.7%) | 82 (73.9%) |
| Confirmed ABN (% with a new result) | 14 (66.7%) | 18 (75.0%) | 3 (15.8%) | 7 (70.0%) | 7 (87.5%) | 49 (59.8%) |
| Reclassified as mosaic (% thawed) | 7 (22.6%) | 6 (17.6%) | 16 (72.7%) | 3 (23.1%) | 1 (9.1%) | 33 (29.7%) |
| Reclassified as mosaic (% with a new result) | 33.3% | 25.0% | 84.2% | 30.0% | 12.5% | 40.2% |
| Reclassified as mosaic P vs simple gain | 0.0016a | 0.0002a | – | 0.0062a | 0.0009a | |
| Reclassified mosaic, no SA ≥ 20% in re-biopsyb (% of reclassified) | 5 (71.4%) | 1 (16.7%) | 12 (75%) | 3 (100%) | 1 (100%) | 22 (66.7%) |
| Reclassified mosaic, mosaicism in re-biopsyb (% of reclassified) | 2 (28.6%) | 5 (83.3%) | 4 (25%) | 0 (0%) | 0 (0%) | 11 (33.3%) |
aP < 0.05 (Fisher’s exact test), all other comparisons between the different groups were not significant
bIncludes any mosaic abnormality (20–70%) involving the same chromosome(s) as that of the original SA(s)
Concordance of SA clinical re-biopsies
Overall, 40.2% (33/82) of the embryos with a second biopsy result were reclassified as mosaic, with a further three returning a no call result (Table 2; Supplementary table 6). As for the superior thaw survival rate, considerably better outcomes were achieved for the simple gain group, where 84.2% of the embryos with a second result had their status changed to mosaic (Fig. 2c). This outcome was highly statistically significant (P < 0.01) compared to all other groups (Table 2). An ABN status was confirmed for 67% or more of re-biopsied embryos in all other categories (Table 2). For the reclassified embryos, re-biopsy found no evidence of mosaicism involving the original SA chromosome for the majority (Table 2: 66.7%). Where mosaic abnormalities persisted in the embryos reclassified as mosaic, this occurred more frequently for the combined complex loss/gain and both categories (5/10; 50%) than for the merged simple categories (6/23; 26.1%).
As for the larger dataset of ABN results (Fig. 1b), the chromosomal distribution of the SAs in the re-biopsied embryos and the subset of these samples reclassified as mosaic were generally in proportion to the size of the chromosome (Fig. 2d). There was no difference in the average size of the SAs observed in embryos assigned a final status of ABN (54.2 ± 42.1 Mb) versus those reclassified as mosaic (60.6 ± 50.4 Mb). Where a mosaic or ABN change involving the original SA chromosome was identified in the second TE sample, substantial variation in the breakpoint position, type, magnitude, and number of SAs was observed (Supplementary Table 6: samples denoted with an asterisk). This variability occurred in embryos reclassified as mosaic (11/33; Supplementary Table 6: e.g., samples 27, 44, 53, 71) and at a higher rate in those whose status was confirmed to be ABN (39/49; e.g., samples 9, 11, 36, 60). For nine re-biopsy samples, the discrepancy was due to involvement of the whole chromosome rather than a SA and was observed in embryos reclassified as mosaic (samples 27, 53, 71), as well as those confirmed ABN (samples 39, 41, 63, 105, 108, 108). Only a single embryo was confirmed to be ABN due to abnormalities unrelated to the original SA (sample 64).
For embryos where the original SA was an 80–95% shift (Supplementary table 6: samples denoted with a #), eight out of 10 such embryos were reclassified as mosaic. Given that evidence of mosaicism was already present in the original sample, the reclassification of these samples to mosaic at a higher rate than those where a 100% SA had been observed was not unexpected. If SAs with original shifts less than 100% were removed from our analysis, re-biopsy would have reclassified as mosaic the majority of simple gains (15/18), but very few from the simple losses (3/17; Supplementary Table 6: samples 45, 100, 109), complex gains (3/10; samples 16, 83, 89), complex losses (3/21; samples 55, 71, 77), and both (1/8; sample 76) categories.
The above results indicate that by limiting confirmatory biopsies to segmental gains (80–100% shifts), or embryos from other categories where the initial result identified a SA at less than 100% (“other”; 80–95% shifts), only 29% of the thaws would have occurred, with 79% of these reclassified as mosaic. Of the embryos that would not have been selected for re-biopsy, 88% were confirmed as ABN. When the above modifications were incorporated into our re-biopsy program, the results from a subsequent 16-month period validated the revised protocol, with a 60% reduction in the annual number of thaws, a 91.4% re-biopsy rate (53/58), and 71.7% (38/53) of re-biopsies reclassified as mosaic (Supplementary Table 7). The high rate at which blastocysts became suitable for re-biopsy and were subsequently reclassified as mosaic was consistent across both the gain and other categories (Supplementary Table 7). Of the embryos reclassified as mosaic, no mosaicism ≥ 20% involving the original SA chromosome was detected in the majority of re-biopsies (29/38; 76.3%), although the rate was lower in the other category (5/9, 55.6%; Supplementary Table 7).
Discussion
Our combined cohort of 139 blastocysts with SAs for which re-biopsy results were obtained (initial pilot: 4, main study: 82, revised protocol: 53) corroborate previous reports [1, 7, 8] that mosaic SAs incorrectly classified as ABN are the major source of false positives in PGT-A. As a result of this study, 71 embryos (main study: 33, revised protocol: 38) that would have been discarded were reclassified as available for clinical use. A surprising finding was the high rate at which simple segmental gains were reclassified as mosaic, compared to the next best category, that of simple losses (Table 2). A reanalysis of the supplementary data of Girardi et al. [1] provided independent confirmation of this unexpected result, as a very similar pattern was identified in their sequential biopsies: TE was reclassified as mosaic for 88% of embryos that had originally been identified to have a segmental gain, compared to only 37% for losses. A similar pattern was found for the ICMs in the Girardi et al. [1] data, with 27% of segmental gains, but 74% of losses were found to be ABN in their verified ICM samples. Thus, the results of two independent studies indicate that segmental gains produce a markedly higher level of false positive PGT-A results than do losses.
An explanation for the distinct behavior of gains may be the generally lower impact they have on cell fitness compared to the equivalent losses. In particular, many proteins are incorporated into and function as part of heteromeric complexes; hence, excess peptide resulting from a segmental gain is frequently unstable in the unincorporated form and degraded with minimal negative impact [19]. In contrast, insufficient protein production arising from a loss is frequently deleterious, as illustrated by the strong absence of autosomal deletions from RefSeq genes in comparison to duplications [20] and the association of losses with more serious, less survivable phenotypes [21]. Further evidence of the lethality of deletions is provided by a study of 1715 genomes, where duplications represented 74.7% of the total CNVs identified, with losses of a size > 0.5 Mb in particular being extremely underrepresented [22]. In keeping with the reduced fitness of deletions, we found that blastocysts harboring segmental losses had significantly reduced viability post thaw (Table 2; Fig. 2c). Thus, multiple lines of evidence indicate that relative to sub-chromosomal gains, there is strong selective pressure against the persistence of segmental losses. The low frequency at which confirmatory biopsies reclassify segmental losses as mosaic (Table 2) [1] is presumably due to the ability of euploid cells; if any such had been present, to efficiently outcompete cells that contain segmental losses. Therefore, when a sub-chromosomal loss is detected in 100% of the initial TE biopsy sample, it appears to be a strong indicator that there is likely to be few or no euploid cells present in the remainder of the blastocyst. In contrast, cells with sub-chromosomal gains appear to be more capable of persisting in a mosaic state.
As to why PGT-A false positive results appear to be primarily derived from SAs, we hypothesize that compared to numeric abnormalities, cells harboring SAs have a reduced ability to survive and proliferate, and as such, they would be less capable of spreading throughout the TE of mosaic embryos. Hence, sampling errors, arising from localization of the ABN cells to a discrete area of the TE, may be a principal reason why mosaic SAs are at an increased risk of generating false positive results compared to numerics. A limited ability of SAs to persist and spread throughout the TE is illustrated by an up to 70% rate of SAs in cleavage stage embryos, which decreases dramatically by the blastocyst stage [23–25]. A reduced replicative proficiency of SAs is likely to be linked to their inherent instability, as unlike numeric aberrations, SA generation involves double-stranded DNA breaks. As such, especially in the case of losses, this will frequently result in a chromosome devoid of telomeric sequences on one arm. Unless the absence of a telomere can be resolved, cells harboring such a chromosome will be at increased risk of catastrophic chromosomal errors, elimination via apoptotic pathways, and/or be more susceptible to the proliferative faults that have been demonstrated to operate in mosaic mouse and human embryos [14, 26]. One pathway by which a telomere can be reacquired is via cycles of breakage-fusion-bridge formation, which will generate additional SAs on that chromosome [23]. The resulting heterogeneous population of cells is illustrated by the frequent discrepancies in the type, position, number, and/or magnitude of the SAs that we detected on the same chromosome from two TE biopsy samples of a single embryo (Supplementary Table 6).
Our mosaic outcomes (Table 1) closely match those of a recently published large study that found no difference between low- and high-level mosaic SAs [14]. Although the Viotti et al. [14] study observed a decrease in the rate of ongoing pregnancies/LBs for the mosaic SA group as a whole (43.1% vs 52.3% for euploid), that particular comparison did not utilize a matched dataset. Despite one report of inferior outcomes following the transfer of high-level mosaic SAs [12], it is now clear that SAs have the best outcomes of all mosaic types, as supported by a recent meta-analysis [13]. Given this consensus, performing a second TE biopsy for SAs can avoid the situation where embryos with a high potential to result in a liveborn child are erroneously discarded. Similar proposals to limit false positive PGT-A results have also been suggested by others [1, 8]. An impediment to the extensive adoption of confirmatory biopsies is the conflicting reports on the influence that two cycles of biopsy and vitrification has on outcomes [27–31]. Although a conclusive answer as to the impact of re-biopsy is lacking, that LBs were reported in all the above studies indicates confirmatory biopsies should be given serious consideration where SAs would otherwise be discarded. For the specific case of segmental gains, some clinicians may consider the potential negative impact of a re-biopsy outweighs the relatively low risk of proceeding to a transfer without a confirmatory biopsy, provided appropriate genetic counseling and prenatal follow up occurs. It is reassuring that to date, our clinic has had no reports of developmental delays in children resulting from the transfer of mosaic SAs.
The mosaic outcome data in this study clearly illustrated the benefit of a ranking system for prioritizing the order of mosaic embryo transfer (Table 1) and reinforced the findings of other studies that transfer of mosaic embryos can result in a substantial number of LBs, although at a significantly reduced rate for numerics in particular [7, 13, 14, 32]. In relation to the debate on the potential benefit of distinguishing between low- and high-level numeric mosaics [15], our data identified a strong reduction in LB rates (Table 1: group B3 ≤ 40%; 42.3% vs group C > 40%; 19.2%, P = 0.02) as has also been observed using a ≥ 50% cutoff [14]. The findings of earlier smaller studies have been conflicting, with some reporting a correlation between the percentage of numeric mosaicism and outcomes [33] and others not [7, 13]. Overall, it would appear prudent to rank high-level numeric mosaics as last choice for transfer.
As anticipated, in our data, detection of a numeric aneuploidy was associated with a significant increase in maternal age (Supplementary Table 3), in keeping with the source being meiotic errors. Unexpectedly, we also observed a small (0.8 year) but highly significant (P < 0.0001) increase in maternal age for the high-level group C numeric mosaics compared to group A (NAD), despite the generally accepted belief that mosaicism is maternal age independent. The better outcomes observed for mosaic embryos generated at a younger maternal age [7] led to the suggestion that the mechanisms responsible for elimination of aneuploid cells in mosaic blastocysts may be more active in “younger” embryos. Thus, our data supports the proposal that although “young” and “old” embryos are likely to have a similar initial level of numeric mosaicism, “older” blastocysts may be over-represented in the high-level group due to a reduced self-corrective ability.
In conclusion, this study has increased our understanding of the inherent differences between segmental and numeric aneuploidies. A novel finding was the clear difference in the re-biopsy concordance rates between segmental duplications and deletions. The results of this first report of undertaking clinical confirmatory biopsies for SAs indicate that a focus on embryos with segmental gains and the subset of others where the initial result identified a SA present in less than 100% of the sample is likely to provide the greatest benefit. The LB outcome data presented in this study has also aided efforts toward achieving a consensus on an optimal ranking system for mosaic embryos [15], confirming that those with a SA should be considered first choice and high-level numerics last. The application of a mosaic ranking system, in combination with targeted confirmatory biopsies, provides a path to maximize the number of PGT-A tested embryos available for clinical use.
Supplementary Information
Below is the link to the electronic supplementary material.
Acknowledgements
We thank the Genea embryology and PGT teams for their assistance with the biopsy, testing, and analysis of samples and Andrew Murray for data retrieval and statistics advice.
Author contribution
Steve Grkovic was responsible for the study design, data analysis, and drafting of the manuscript. Maria Traversa, Mark Livingstone, and Steven McArthur participated in critical discussion and review of manuscript. All the authors gave final approval of the version to be published.
Funding
No specific funding applied to this study. Steve Grkovic, Maria Traversa, and Steven McArthur receive salaries and Mark Livingstone a deputy medical director’s fee from Genea, Sydney, New South Wales, Australia.
Declarations
Conflict of interest
The authors declare no competing interests.
Footnotes
Publisher's note
Springer Nature remains neutral with regard to jurisdictional claims in published maps and institutional affiliations.
References
- 1.Girardi L, Serdarogullari M, Patassini C, Poli M, Fabiani M, Caroselli S, et al. Incidence, origin, and predictive model for the detection and clinical management of segmental aneuploidies in human embryos. Am J Hum Genet. 2020;106:525–534. doi: 10.1016/j.ajhg.2020.03.005. [DOI] [PMC free article] [PubMed] [Google Scholar]
- 2.Warburton D. De novo balanced chromosome rearrangements and extra marker chromosomes identified at prenatal diagnosis: clinical significance and distribution of breakpoints. Am J Hum Genet. 1991;49:995–1013. [PMC free article] [PubMed]
- 3.Giardino D, Corti C, Ballarati L, Colombo D, Sala E, Villa N, et al. De novo balanced chromosome rearrangements in prenatal diagnosis. Prenat Diagn. 2009;29:257–265. doi: 10.1002/pd.2215. [DOI] [PubMed] [Google Scholar]
- 4.Srebniak MI, Joosten M, Knapen MFCM, Arends LR, Polak M, van Veen S, et al. Frequency of submicroscopic chromosomal aberrations in pregnancies without increased risk for structural chromosomal aberrations: systematic review and meta-analysis. Ultrasound Obstet Gynecol. 2018;51:445–452. doi: 10.1002/uog.17533. [DOI] [PubMed] [Google Scholar]
- 5.Wellesley D, Dolk H, Boyd PA, Greenlees R, Haeusler M, Nelen V, et al. Rare chromosome abnormalities, prevalence and prenatal diagnosis rates from population-based congenital anomaly registers in Europe. Eur J Hum Genet. 2012;20:521–526. doi: 10.1038/ejhg.2011.246. [DOI] [PMC free article] [PubMed] [Google Scholar]
- 6.Grkovic S, Traversa M, Bonifacio M, Bowman M, Marren A, McArthur S. Challenges in interpreting the relevance of segmental mosaicism detected by NGS. 16th international conference on preimplantation genetics. Valencia, Spain; 2017.
- 7.Victor AR, Tyndall JC, Brake AJ, Lepkowsky LT, Murphy AE, Griffin DK, et al. One hundred mosaic embryos transferred prospectively in a single clinic: exploring when and why they result in healthy pregnancies. Fertil Steril. 2019;111:280–293. doi: 10.1016/j.fertnstert.2018.10.019. [DOI] [PubMed] [Google Scholar]
- 8.Navratil R, Horak J, Hornak M, Kubicek D, Balcova M, Tauwinklova G, et al. Concordance of various chromosomal errors among different parts of the embryo and the value of re-biopsy in embryos with segmental aneuploidies. Mol Hum Reprod. 2020;26:269–276. doi: 10.1093/molehr/gaaa012. [DOI] [PMC free article] [PubMed] [Google Scholar]
- 9.Lawrenz B, el Khatib I, Liñán A, Bayram A, Arnanz A, Chopra R, et al. The clinicianś dilemma with mosaicism - an insight from inner cell mass biopsies. Hum Reprod. 2019;34:998–1010. doi: 10.1093/humrep/dez055. [DOI] [PubMed] [Google Scholar]
- 10.Treff NR, Franasiak JM. Detection of segmental aneuploidy and mosaicism in the human preimplantation embryo: technical considerations and limitations. Fertility and Sterility. 2017. p. 27–31. 10.1016/j.fertnstert.2016.09.039 [DOI] [PubMed]
- 11.Zhou S, Cheng D, Ouyang Q, Xie P, Lu C, Gong F, et al. Prevalence and authenticity of de-novo segmental aneuploidy (>16 Mb) in human blastocysts as detected by next-generation sequencing. Reprod Biomed Online. 2018;37:511–520. doi: 10.1016/j.rbmo.2018.08.006. [DOI] [PubMed] [Google Scholar]
- 12.Zore T, Kroener LL, Wang C, Liu L, Buyalos R, Hubert G, et al. Transfer of embryos with segmental mosaicism is associated with a significant reduction in live-birth rate. Fertil Steril. 2019;111:69–76. doi: 10.1016/j.fertnstert.2018.08.057. [DOI] [PubMed] [Google Scholar]
- 13.Zhang YX, Chen JJ, Nabu S, Yeung QSY, Li Y, Tan JH, et al. The pregnancy outcome of mosaic embryo transfer: A prospective multicenter study and meta-analysis. Genes. 2020;11:973. doi: 10.3390/genes11090973. [DOI] [PMC free article] [PubMed] [Google Scholar]
- 14.Viotti M, Victor AR, Barnes FL, Zouves CG, Besser AG, Grifo JA, et al. Using outcome data from one thousand mosaic embryo transfers to formulate an embryo ranking system for clinical use. Fertility and Sterility. 2021;115. 10.1016/j.fertnstert.2020.11.041 [DOI] [PubMed]
- 15.Cram DS, Leigh D, Handyside A, Rechitsky L, Xu K, Harton G, et al. PGDIS Position Statement on the Transfer of Mosaic Embryos 2019. Reprod Biomed Online. 2019;39:e1–4. doi: 10.1016/j.rbmo.2019.06.012. [DOI] [PubMed] [Google Scholar]
- 16.Traversa MV, Carey L, Leigh D. A molecular strategy for routine preimplantation genetic diagnosis in both reciprocal and Robertsonian translocation carriers. Mol Hum Reprod. 2010;16:329–337. doi: 10.1093/molehr/gaq013. [DOI] [PubMed] [Google Scholar]
- 17.McArthur SJ, Leigh D, Marshall JT, Gee AJ, de Boer KA, Jansen RPS. Blastocyst trophectoderm biopsy and preimplantation genetic diagnosis for familial monogenic disorders and chromosomal translocations. Prenat Diagn. 2008;28:434–442. doi: 10.1002/pd.1924. [DOI] [PubMed] [Google Scholar]
- 18.Roy TK, Brandi S, Peura TT. Gavi-Automated Vitrification Instrument. In: Nagy Z., Varghese A., Agarwal A., editors. Cryopreservation of mammalian gametes and embryos methods in molecular biology. New York: Humana Press; 2017. 10.1007/978-1-4939-6828-2_20
- 19.Zhu J, Tsai HJ, Gordon MR, Li R. Cellular stress associated with aneuploidy. Developmental Cell. 2018. p. 420–31. 10.1016/j.devcel.2018.02.002 [DOI] [PMC free article] [PubMed]
- 20.Conrad DF, Pinto D, Redon R, Feuk L, Gokcumen O, Zhang Y, et al. Origins and functional impact of copy number variation in the human genome. Nature. 2010;464:704–712. doi: 10.1038/nature08516. [DOI] [PMC free article] [PubMed] [Google Scholar]
- 21.Gardner RJM, Sutherland GR, Shaffer LG. Structural rearrangements. Chromosome abnormalities and genetic counseling. 4th ed. Oxford: Oxford University Press; 2012. p. 295–332.
- 22.Veerappa AM, Suresh RV, Vishweswaraiah S, Lingaiah K, Murthy M, Manjegowda DS, et al. Global patterns of large copy number variations in the human genome reveal complexity in chromosome organization. Genet Res. 2015;97:e18. doi: 10.1017/S0016672315000191. [DOI] [PMC free article] [PubMed] [Google Scholar]
- 23.Vanneste E, Voet T, le Caignec C, Ampe M, Konings P, Melotte C, et al. Chromosome instability is common in human cleavage-stage embryos. Nat Med. 2009;15:577–583. doi: 10.1038/nm.1924. [DOI] [PubMed] [Google Scholar]
- 24.Babariya D, Fragouli E, Alfarawati S, Spath K, Wells D. The incidence and origin of segmental aneuploidy in human oocytes and preimplantation embryos. Hum Reprod. 2017;32:2549–2560. doi: 10.1093/humrep/dex324. [DOI] [PubMed] [Google Scholar]
- 25.Magli MC, Albanese C, Crippa A, Terzuoli G, la Sala G, Tabanelli C, et al. Permanence of de novo segmental aneuploidy in sequential embryo biopsies. Hum Reprod (Oxford, England) 2020;35:759–769. doi: 10.1093/humrep/deaa025. [DOI] [PubMed] [Google Scholar]
- 26.Bolton H, Graham SJL, van der Aa N, Kumar P, Theunis K, Fernandez Gallardo E, et al. Mouse model of chromosome mosaicism reveals lineage-specific depletion of aneuploid cells and normal developmental potential. Nat Commun. 2016;7:11165. doi: 10.1038/ncomms11165. [DOI] [PMC free article] [PubMed] [Google Scholar]
- 27.Zhang S, Tan K, Gong F, Gu Y, Tan Y, Lu C, et al. Blastocysts can be rebiopsied for preimplantation genetic diagnosis and screening. Fertil Steril. 2014;102:1641–1645. doi: 10.1016/j.fertnstert.2014.09.018. [DOI] [PubMed] [Google Scholar]
- 28.Bradley CK, Livingstone M, Traversa MV, McArthur SJ. Impact of multiple blastocyst biopsy and vitrification-warming procedures on pregnancy outcomes. Fertil Steril. 2017;108:999–1006. doi: 10.1016/j.fertnstert.2017.09.013. [DOI] [PubMed] [Google Scholar]
- 29.Cimadomo D, Rienzi L, Romanelli V, Alviggi E, Levi-Setti PE, Albani E, et al. Inconclusive chromosomal assessment after blastocyst biopsy: prevalence, causative factors and outcomes after re-biopsy and re-vitrification a multicenter experience. Hum Reprod. 2018;33:1839–1846. doi: 10.1093/humrep/dey282. [DOI] [PubMed] [Google Scholar]
- 30.Neal SA, Sun L, Jalas C, Morin SJ, Molinaro TA, Scott RT. When next-generation sequencing-based preimplantation genetic testing for aneuploidy (PGT-A) yields an inconclusive report: diagnostic results and clinical outcomes after re biopsy. J Assist Reprod Genet. 2019;36:2103–2109. doi: 10.1007/s10815-019-01550-6. [DOI] [PMC free article] [PubMed] [Google Scholar]
- 31.de Vos A, van Landuyt L, de Rycke M, Verdyck P, Verheyen G, Buysse A, et al. Multiple vitrification-warming and biopsy procedures on human embryos: clinical outcome and neonatal follow-up of children. Hum Reprod. 2020;35:2488–2496. doi: 10.1093/humrep/deaa236. [DOI] [PubMed] [Google Scholar]
- 32.Fragouli E, Alfarawati S, Spath K, Babariya D, Tarozzi N, Borini A, et al. Analysis of implantation and ongoing pregnancy rates following the transfer of mosaic diploid–aneuploid blastocysts. Hum Genet. 2017;136:805–819. doi: 10.1007/s00439-017-1797-4. [DOI] [PubMed] [Google Scholar]
- 33.Lin P-Y, Lee C-I, Cheng E-H, Huang C-C, Lee T-H, Shih H-H, et al. Clinical outcomes of single mosaic embryo transfer: high-level or low-level mosaic embryo, does it matter? J Clin Med. 2020;9:1695. doi: 10.3390/jcm9061695. [DOI] [PMC free article] [PubMed] [Google Scholar]
Associated Data
This section collects any data citations, data availability statements, or supplementary materials included in this article.