

Abstract
A pancreatic acinus is a functional unit of the exocrine pancreas producing digest enzymes. Its pathobiology is crucial to pancreatic diseases including pancreatitis and pancreatic cancer, which can initiate from pancreatic acini. However, research on pancreatic acini has been significantly hampered due to the difficulty of culturing normal acinar cells in vitro. In this study, an in vitro model of the normal acinus, named pancreatic acinus-on-chip (PAC), is developed using reprogrammed pancreatic cancer cells. The developed model is a microfluidic platform with an epithelial duct and acinar sac geometry microfabricated by a newly developed two-step controlled “viscous-fingering” technique. In this model, human pancreatic cancer cells, Panc-1, reprogrammed to revert to the normal state upon induction of PTF1a gene expression, are cultured. Bioinformatic analyses suggest that, upon induced PTF1a expression, Panc-1 cells transition into a more normal and differentiated acinar phenotype. The microanatomy and exocrine functions of the model are characterized to confirm the normal acinus phenotypes. The developed model provides a new and reliable testbed to study the initiation and progression of pancreatic cancers.
Introduction
The pancreas is a large gland organ performing two distinct functions in the digestive system. Besides the endocrine function of secreting insulin, most of the pancreatic tissue performs the exocrine function to produce and secrete digestive enzymes to the small intestine via pancreatic ducts. The pancreatic acinus is the functional unit of this exocrine pancreas and accounts for about 80% of the pancreas mass.1 Two primary diseases associated with pancreatic acini are pancreatitis and pancreatic cancer. Pancreatitis is an inflammation of the pancreas, in which the digestive enzymes digest the pancreas itself. In 2009, there were 275 000 hospital admissions for acute pancreatitis in the U.S. alone.2 This disease is mainly caused by pre-mature activation of the enzymes within pancreatic acinar cells.1 Chronic pancreatitis often progresses to pancreatic cancer. Pancreatic cancer, specifically pancreatic ducal adenocarcinoma (PDAC), is the most deadly form of cancer whose 5-year survival rate is below 9%.3 PDAC can rise from both ductal epithelial cells as well as from acinar cells.4–7 Recently, it has been reported that the molecular characteristics of PDAC are distinctly different depending on the cell of origin.8 Thus, understanding the physiology and pathophysiology of pancreatic acini is crucially important to define these diseases and to devise new therapeutic strategies.
Several disease models have been developed to study pancreatic acinus pathophysiology, most of which are small animal models. For PDAC research, these small animal models include mouse xenograft and allograft (heterotopic and orthotopic) models, as well as genetically engineered mouse models (GEMMs).8–10 Animal models for pancreatitis research have been developed by induction of pancreatitis.11,12 The inductions are typically achieved by administration of hormone or alcohol or by surgeries. Compared to conventional 2D cell culture models, these small animal models can provide the microenvironment with cell–cell and cell–matrix interactions relevant to study disease states. However, these models are very expensive and usually take an extended period of time to generate. Moreover, it is challenging to interpret the end results to establish a mechanistic understanding due to the lack of precise control of the microenvironmental conditions.
To address these challenges, in vitro 3D models of pancreatic acini have been proposed and developed. Although acinus cells can be isolated from normal pancreatic acini and successfully grown in vitro culture, the usability of these cell preparations is significantly limited since the cells quickly lose their acinar characteristics and de-differentiate.13,14 Besides isolation of cells from normal acinus tissue, several studies have shown that acinar organoids can be differentiated from progenitor cells.15–17 These studies used mouse embryonic progenitor cells to create 3D organoids through prolonged cultures. More recently, bovine acinar cells were isolated and maintained in suspension for up to 20 days by suppressing zymogen activation of acinar cells using bovine serum albumin (BSA) supplemented medium.18 Although these models demonstrate the feasibility of culturing normal acinar cells in vitro, the critical technological gaps still remain to be filled. In many of these in vitro models, it is difficult and time-consuming to reconstitute acinus micro-anatomy and the polarity of acinar cells. These difficulties are primarily attributed to membrane damage and subsequent death by the uncontrolled release of digest enzymes after isolating cells from acinus tissue. Moreover, the lack of a reliable source of normal acinar cells is a major challenge. The difficulty to microscopically access the acinus for the detailed study is another drawback. These gaps should be addressed to establish a reliable testbed for the study of normal pancreatic acini.
In the present study, we developed an in vitro model of the normal acinus, named pancreatic acinus-on-chip (PAC), using reprogrammed pancreatic cancer cells to address the technical gaps. The developed model is a microfluidic platform where an epithelial duct and acinar sac geometry surrounded by the 3D collagen matrices are microfabricated by a newly developed two-step controlled “viscous-fingering” technique. Along the inner lining of the model are cultured human pancreatic cancer cells, Panc-1, that have been reprogrammed to revert to the normal phenotype upon induction of the PTF1a gene. Our hypothesis is that reprogrammed cancer cells can reconstitute a normal pancreatic acinus in a relevant 3D microenvironment. This hypothesis can address the drawback of a limited acinar cell source. Using the developed model, we test whether induction of PTF1a can create a functional acinus in vitro. Bioinformatic analysis is performed to confirm the phenotypic changes upon PTF1a induction. Cellular behaviors in the model are assessed and compared with and without PTF1a induction. These include cell–matrix interaction, local invasion, and endocrine functions.
Experimental
Cells and reagents
A human pancreatic cancer cell line (Panc-1, ATCC number CRL-1469) was genetically modified to allow for the pancreatic transcription factor 1a (PTF1a) gene to be expressed in the presence of doxycycline. Details about the acquisition and modification of this cell line (Panc-1 Tet-PTF1a) are described previously.10 Cells were cultured in Dulbecco’s modified Eagle’s medium (Sigma-Aldrich) supplemented with 10% Tet system approved fetal bovine serum (Takara Bio USA, CA), GlutaMAX™ supplement (Gibco, Carlsbad, CA), and 10 000 U mL−1 penicillin–streptomycin (Gibco, Carlsbad, CA). The treated cases include 1 μg mL−1 of doxycycline hyclate (Sigma-Aldrich) in the culture medium. Cells were cultured until reaching approximately 80% confluency, then harvested for sub-passaging or experimentation.
Microfabrication
Devices are fabricated with a polydimethylsiloxane (PDMS, Dow Corning, Midland, MI) using a 3D printed mold. The PDMS solution is set to cure at 80 °C for four hours then removed from the mold. Inlet and outlet holes are created using a biopsy punch. Each half of the chip is thoroughly cleaned of dust and debris, then treated with a corona discharger and affixed together. The assembled device is treated again with the corona discharger and adhered to a glass microscope slide. After the microfabrication, the chip is first filled with a type I collagen solution (Corning, NY). Then a droplet of the culture medium is placed on the inlet port. Collagen solution is removed from the outlet to pull the medium into the chip and form a duct ending in an acinus via viscous fingering.19,20 The chip is incubated at 37 °C for 15 minutes to allow the collagen to polymerize. The acinus is then pierced with a 34G needle to allow the medium to flow through the chip from inlet to outlet.
Cell loading
A droplet of cell suspension (5000 cells per μL of culture medium) is placed on the inlet and allowed to fill the chamber. The chip is incubated at 37 °C for 15 minutes to allow the cells to adhere to the collagen along the bottom of the chip. Then the fluid is removed from the outlet, and another droplet of cell suspension is added. The chip is rotated 90° and incubated again for 15 minutes to allow cells to adhere to the sidewall of the chip. This step is repeated two more times so that all sides of the chamber are covered in a uniform cell layer. Finally, reservoirs were added to the inlet and outlet to allow for perfusion of the culture medium, and the inlet reservoir was filled (see Fig. 2C).
Fig. 2.

Fabrication of the pancreatic acinus-on-chip (PAC) model. (A) Schematic of two-step ‘controlled’ viscous fingering steps. (B) Time-lapsed micrographs of two-step viscous fingering showing the formation of the duct (i.e., steps 1–4) and acinus (i.e., steps 5–8) in the pre-polymerized collagen solution. Scale bars are 300 μm. (C) A photograph of a PAC model with medium reservoirs. (D) Diameters of duct lumen and acinus cavity (N > 3). Bar: mean ± standard deviation. (E) 3D confocal micrograph and cross-sectional micrographs of the PAC model.
Bioinformatics analysis
RNA-seq data for induced PTF1a expression in pancreatic ductal adenocarcinoma cells were downloaded from GEO (accession: GSE106290). A total of 5422 differentially expressed (DE) genes were identified using the analysis published Jakubison et al.10 at a false discovery rate of 1% (FDR ≤ 0.01). Pathway analysis was performed with IPA21 (version 60467501). Gene set enrichment analysis22 (GSEA – version 4.1.0) was performed using the pre-ranked (signed fold-change × −log 10 p value) gene-list. A heatmap of the genes from selected pathways of interest was generated using the R-package pheatmap using the normalized (counts per million) data.
Confocal and second harmonic microscopy
For confocal imaging, samples were incubated for 30 minutes with a culture medium containing a 1 : 1000 dilution of CellMask (Invitrogen, CA) and 10 μg mL−1 of Hoechst 33342 (Sigma-Aldrich) to stain the cell membranes and nuclei, respectively. The samples were then fixed in 4% formaldehyde solution for 10 minutes and rinsed thrice with DPBS (Gibco, CA). The samples were then imaged with a Nikon multiphoton intravital system. We used both visible confocal and multiphoton second harmonic generation methods for imaging.
RT-qPCR
Gene expression of Panc-1 Tet-PTF1a cells with and without doxycycline treatment was characterized by RT-qPCR after seeding to confirm the successful induction of PTF1a. Cells were harvested from the devices, and RNA was collected using a miRNeasy Mini kit (Qiagen, cat. 217004, Hilden, Germany). Total RNA could then be changed into cDNA using the iScript cDNA synthesis kit (Bio-Red, cat. 1708891, Hercules, CA). RT-qPCR was then completed using SYBR green (Roche, cat. 04913850001, Indianapolis, IN). PTF1a and PRSS2 genes analyzed here were normalized using 18S as an internal control. The standard ΔΔCt method was used to determine the changes in levels of each gene.
Immunohistochemistry
Samples were fixed with 4% formaldehyde solution then rinsed with PBS. They were then perfused with 15% native PAGE acrylamide gel to preserve the internal structure. The PDMS was then cut to expose the collagen of the chip. The sample was processed, embedded in paraffin, and sectioned following standard histology techniques. Paraffin was removed from the slices and treated with an antigen unmasking solution (Vector Laboratories, CA). M.O.M. blocking reagent (Vector Laboratories, CA) was applied to the samples for 1 hour at room temperature. Then the primary antibody PRSS2 (1 : 100, cat. Sab1400226; Sigma) or E-cadherin (1 : 100, cat. ab76055; Abcam) was added to the samples and incubated at room temperature for 1 hour. Biotinylated secondary antibody (1 : 200) was added and incubated for 20 minutes at room temperature. Finally, biotinylated Avidin-Alexa Fluor 488 (cat. S11223, Invitrogen, CA) and DAPI (cat. H-1500, Vector Labs, CA) were added to the samples and incubated at room temperature for 20 minutes.
Transmission electron microscopy
Samples were fixed in 2.5% glutaraldehyde in 0.1 M sodium cacodylate buffer and post-fixed in buffered 1% osmium tetroxide containing 0.8% potassium ferricyanide. They were then dehydrated with a graded series of ethanol, transferred into acetonitrile, and embedded in EMbed-812 resin. Thin sections were cut on a Reichert-Jung Ultracut E ultramicrotome and stained with 4% uranyl acetate and lead citrate. Images were acquired on an FEI Tecnai T12 electron microscope equipped with a tungsten source and operating at 80 kV.
Statistical analysis
For the comparison of results, groups were compared using the Student t-test, with each group containing at least three biological replicates. Statistical significance is denoted in terms of p-values, where p < 0.05 was considered statistically significant.
Results
The design and microfabrication of the PAC are illustrated in Fig. 1. The minimal functional unit of the exocrine pancreas is the pancreatic acinus, which consists of a cluster of secretory acinar cells that form a central lumen. These acini are connected to an intercalated duct, which is connected to neighboring acini or that converges to a larger pancreatic epithelial duct, as illustrated in Fig. 1A. The acinar cell is highly polarized, so that the nucleus is typically located near the basal side, as noted in histology (Fig. 1B). The surface area of the apical membrane, which faces the lumen, is considerably smaller than the basal membrane. The PAC model is designed to capture these microscopic anatomies of the exocrine pancreas, as illustrated in Fig. 1C. The PAC is constructed with the collagen matrix in a microfluidic chip, which is designed to have a duct and acinus anatomy. Cells are seeded and cultured on the collagen matrices to reconstitute the pancreatic acinus.
Fig. 1.
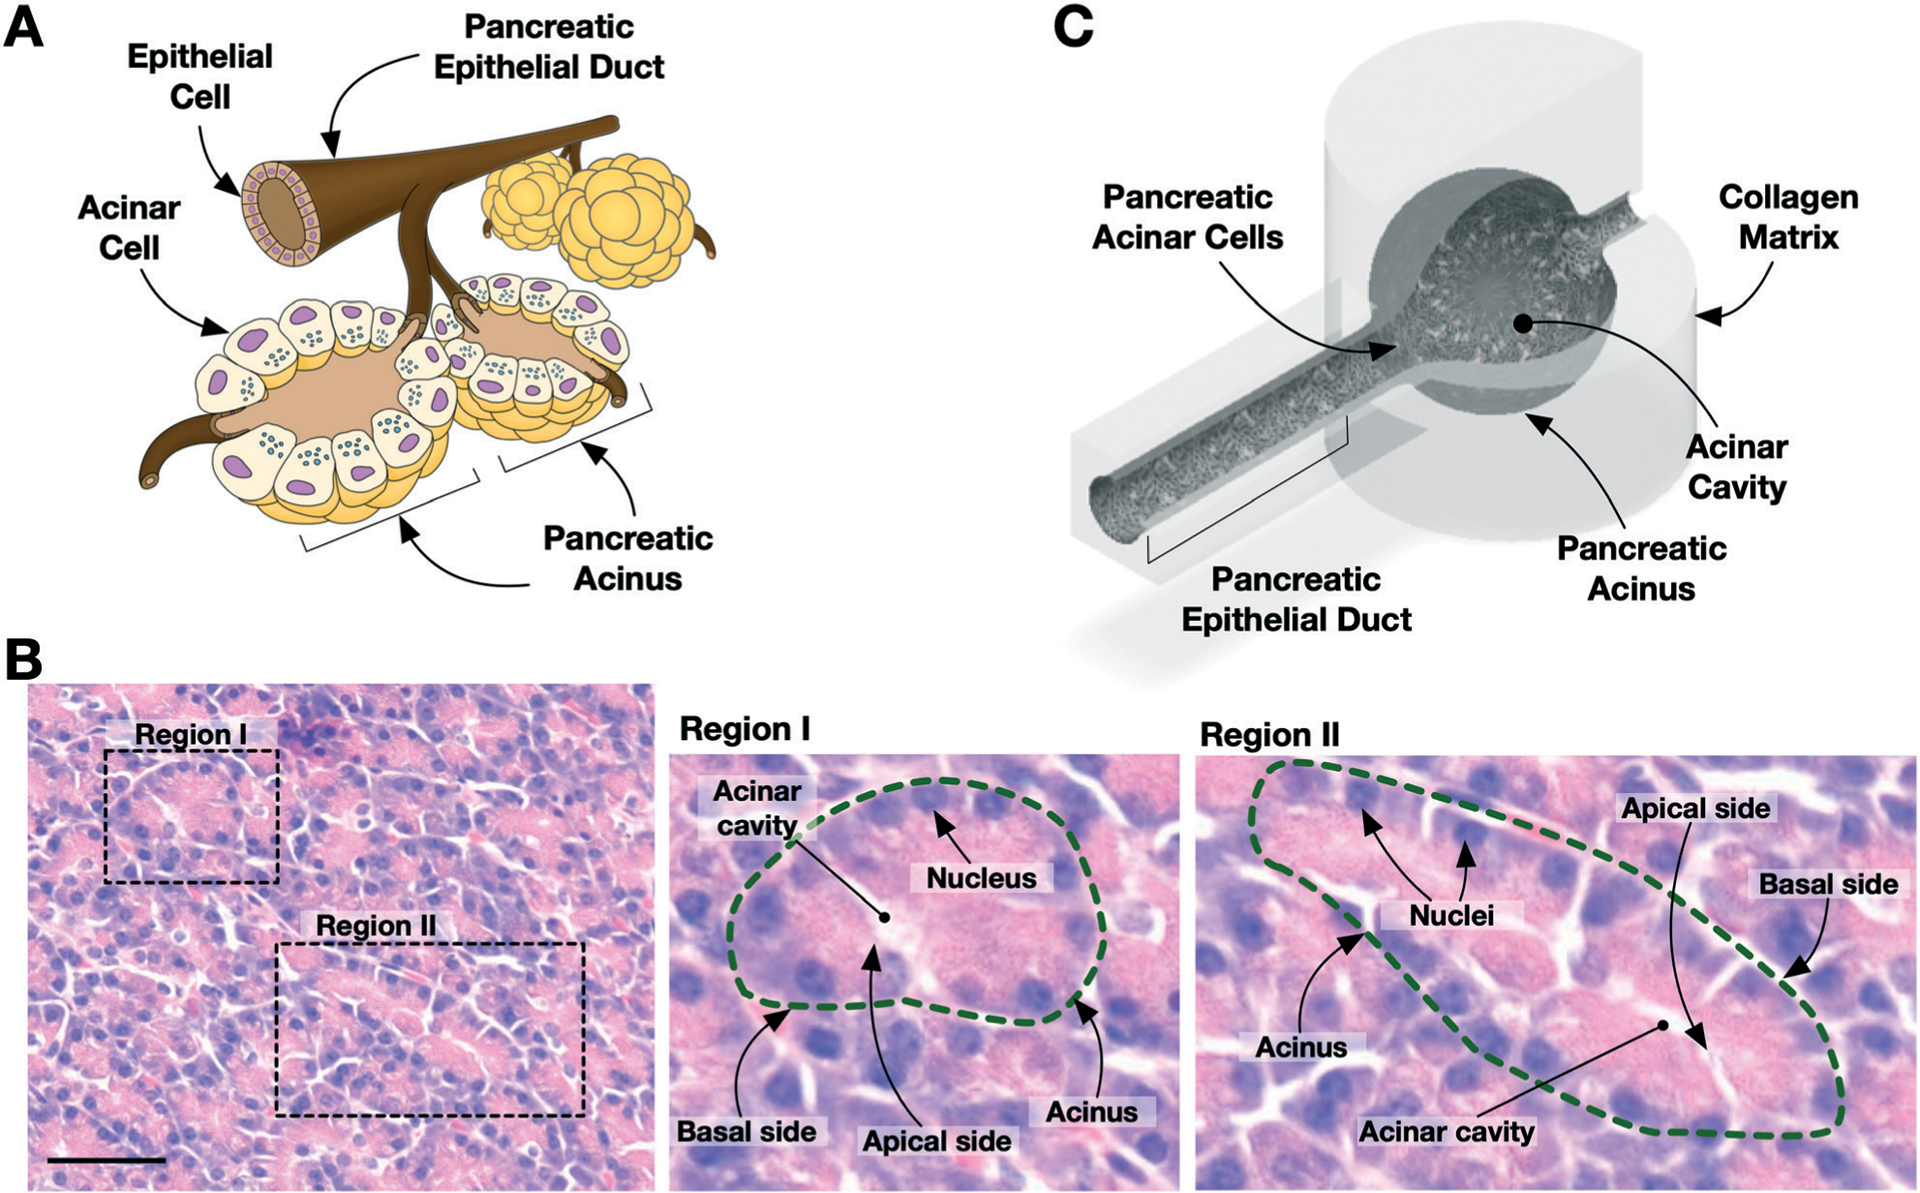
Design of the pancreatic acinus-on-chip (PAC) model. (A) Illustration of exocrine pancreas with pancreatic acini and epithelial duct. (B) Histology of human normal pancreatic tissue. Zoomed-in images show acinus structures (dashed line) with cell nuclei near the basal side. Acinar cavity is present at the apical side. Scale bar is 50 μm. (C) Design of the pancreatic acinus-on-chip. The schematic is shown with a section cut away to expose the inner cavity (i.e., lumen) of the device.
The steps for creating the internal architecture via two-step ‘controlled’ viscous fingering is presented in Fig. 2A. First, the chip is filled with type I collagen solution, and a droplet of culture medium is placed on the inlet for the first viscous fingering step. This will create a duct structure, as reported previously.19,20 For the second viscous fingering, a small amount of collagen solution is pulled from the outlet in order to pull the media through the chamber and create the desired acinus geometry. After this controlled viscous fingering step, the chip is then incubated to polymerize the collagen and preserve the structure. A small outlet hole is then created with a needle to allow the flow of fluid through the channel. A droplet of cell suspension is added to the inlet which seeds cells along the bottom of the chip. Time-lapsed micrographs of duct and acinus sac formation are shown in Fig. 2B. Details of the chip design and fabrication procedures are described in Fig. S1,† ; and the fabricated device is shown in Fig. 2C. The viscous fingering creates duct lumen and acinus cavity consistently throughout the experiment (Fig. 2D). A representative 3D confocal micrograph of the resulting pancreatic acinus and duct is shown in Fig. 2E. The cross-section of the acinus sac and epithelial duct confirms that the cells form the cavity mimicking pancreatic acinus microanatomy.
Cellular characteristics of the PAC are presented in Fig. 3. Since normal pancreatic acinar cells are difficult to maintain for in vitro culture due to their physiological properties of housing large quantities of digestive enzymes, we employed reprogrammable pancreatic cancer cells. This reprogrammable cancer cell line was developed based on a prior study showing that in the healthy pancreas, the basic helix–loop–helix transcription factor PTF1a regulates an acinar-specific transcription network suppressing a transformative process of acinar–ductal metaplasia.10 The inactivity of PTF1a, in conjunction with oncogenic KRAS mutations, is thought to drive the progression of acinar cells to PDAC cancer cells. As illustrated in Fig. 3A, a human PDAC cell line (Panc-1) was transfected with a Tet-PTF1amyc plasmid to create an engineered PDAC cell line (Panc-1 Tet-PTF1a). This engineered cell line still maintains cancer-like properties, but PTF1a can be induced using the tetracycline derivative doxycycline (Dox). Once PTF1a is expressed, the cells become acinar-like, showing acinar gene expression patterns.
Fig. 3.

Cellular characteristics of Panc-1 Tet-PTF1a. (A) Illustration of the reprogramming strategy of pancreatic cancer cells to acinar-like cells using PTF1a. (B) Heatmap of RNA sequencing of Panc-1 Tet-PTF1a cells without doxycycline treatment (control, 4 replicates) and with doxycycline treatment (Dox treatment, 4 replicates). Heatmap illustrates the comparison of log 2-transformed read counts for each gene. (C) Biological and molecular pathways identified by GSEA.
Bioinformatics analysis of the RNA-seq data was performed to fully characterize the effects of PTF1a induction on Panc-1 cells. The comparison was performed between Panc-1 Tet-PTF1a cells without doxycycline treatment (control) and with doxycycline treatment (Dox treatment). The heat map shows a robust gene expression response upon PTF1a induction (Fig. 3B), as a total of 5422 differentially expressed genes were identified. Gene set enrichment analysis (GSEA) shows several key biological and molecular pathways affected by PTF1a induction (Fig. 3C). It promotes the expression of genes involved in pancreatic exocrine development and function, including “Digestive System Development & Process”, “Epithelial Cell Proliferation & Development”, and “Regulation of Exocytosis”. This result strongly supports that PTF1a is a master regulator for pancreatic development and function.10,23–26 The “Unfolded Protein Response” is also promoted, which agrees with previous studies showing that PTF1a functions to alleviate UPR stress and subsequent apoptosis.27,28 In contrast, PTF1a expression negatively influenced genes involved in “Endocrine Development”.
Time-lapsed micrographs of PAC showing the cellular growth are presented in Fig. 4A. Without PTF1a induction (−Dox), the cells show a significant number of invasions into the matrix (noted with arrows), which is typical metastatic behavior of cancer cells grown in this type of configuration.20 However, with PTF1a induction (+Dox), the cells show little to no invasion into the matrix up to 11 days of culture, which suggests a decrease in malignant characteristics of the cells.
Fig. 4.

Suppression of tumorigenic properties in the pancreatic acinus-on-chip (PAC) model. (A) Time-lapse micrographs of PAC with and without Dox treatments. Without Dox treatment, rapid cell growth and invasiveness (noted with arrows) are observed. Zoomed-in micrographs of the boxed area are also shown underneath. Scale bar is 100 μm. (B) Second-harmonic generation microscopy showing the surrounding collagen matrix and cellular structure with and without Dox treatment. Without Dox treatment, degradation of the matrix and local invasion of cells (noted with arrows) are observed. Scale bar is 100 μm. (C) Cancer-associated pathways associated with PTF1a induction from IPA. (D) Heatmaps of curated lists of EMT and cancer-related genes.
The structure of the collagen matrix surrounding the cells by second harmonic generation microscopy is compared in Fig. 4B. Far from the cells, collagen fibers can be seen to have an isotropic organization in both groups. However, without PTF1a induction (−Dox), the fibers look diffuse and degraded near the cells (noted with arrows). This matrix remodeling is thought to be caused by the cancerous properties of the invading cells. In the PTF1a induced (+Dox) group, we see no invasions into the matrix but instead, a thin layer of collagen fibers aligned along the periphery of the acinus. Similar phenomena have been noted of in vivo collagen in cancerous and healthy tissues, respectively.29–31 Additionally, using a single plane of confocal images, we were able to assess the difference in the growth rate of the cells after the induction of PTF1a. The treated case shows a monolayer of cells, as the cells should no longer be dividing with PTF1a expression, whereas the untreated case shows an acinar wall that is about five cell layers thick.
Ingenuity pathway analysis (IPA) in Fig. 4C confirms that several cancer and invasion-related pathways are altered upon PTF1a induction. These include pathways of “Regulation of Epithelial–Mesenchymal-Transition (EMT)”, “Remodeling of Epithelial Adherence Junctions”, and “Inhibition of Matrix Metalloproteases”. To investigate in more detail, the expression levels of key EMT-related genes in the RNA-seq dataset are presented in Fig. 4D. It clearly shows that PTF1a promotes E-cadherin gene (CDH1) expression, which is a major attenuated EMT marker, and suppresses other acquired EMT markers – STAT3, TWIST2, SMAD3, MMP2, TGFB1, and VIM.32–35 This suppression of EMT-related pathways and genes is well aligned with the microscopic observation of PAC. The IPA also suggests the “Cancer Drug Resistance” signaling pathway. Consistent with this, seven of the eight genes related to pancreatic stem cell markers (MET, EPCAM, CD44, CD24, ALDH2, ALDH1a3, ABCg2, DCLK1) are suppressed with PTFA1a induction.36–39
We confirm that the sequence of PTF1a induction does not significantly affect the acinus formation in the PAC platform (e.g., induction of PTF1a prior or posterior to the loading into the PAC platform). As shown in Fig. 5A, real-time qPCR analysis confirms expression of PTF1a and the acinar trypsinogen gene PRSS2 are significantly elevated in the treated group (+Dox) compared to the untreated control (−Dox) in both 2D and 3D inductions. Although the PTF1a level in 2D induction is higher than that in 3D induction, the induction of PTF1a consistently leads to acinus phenotypes regardless of the induction and loading sequence. The presence of trypsinogen expression suggests that the cells have gained the functionality as acinar. Moreover, no notable differences are observed in growth morphology (see Fig. 5B). We observed the suppression of tumorigenic properties of Panc-1 Tet-PTF1a for up to three weeks, but further characterization may be needed to confirm the temporal stability of its non-tumorigenic phenotypes.
Fig. 5.
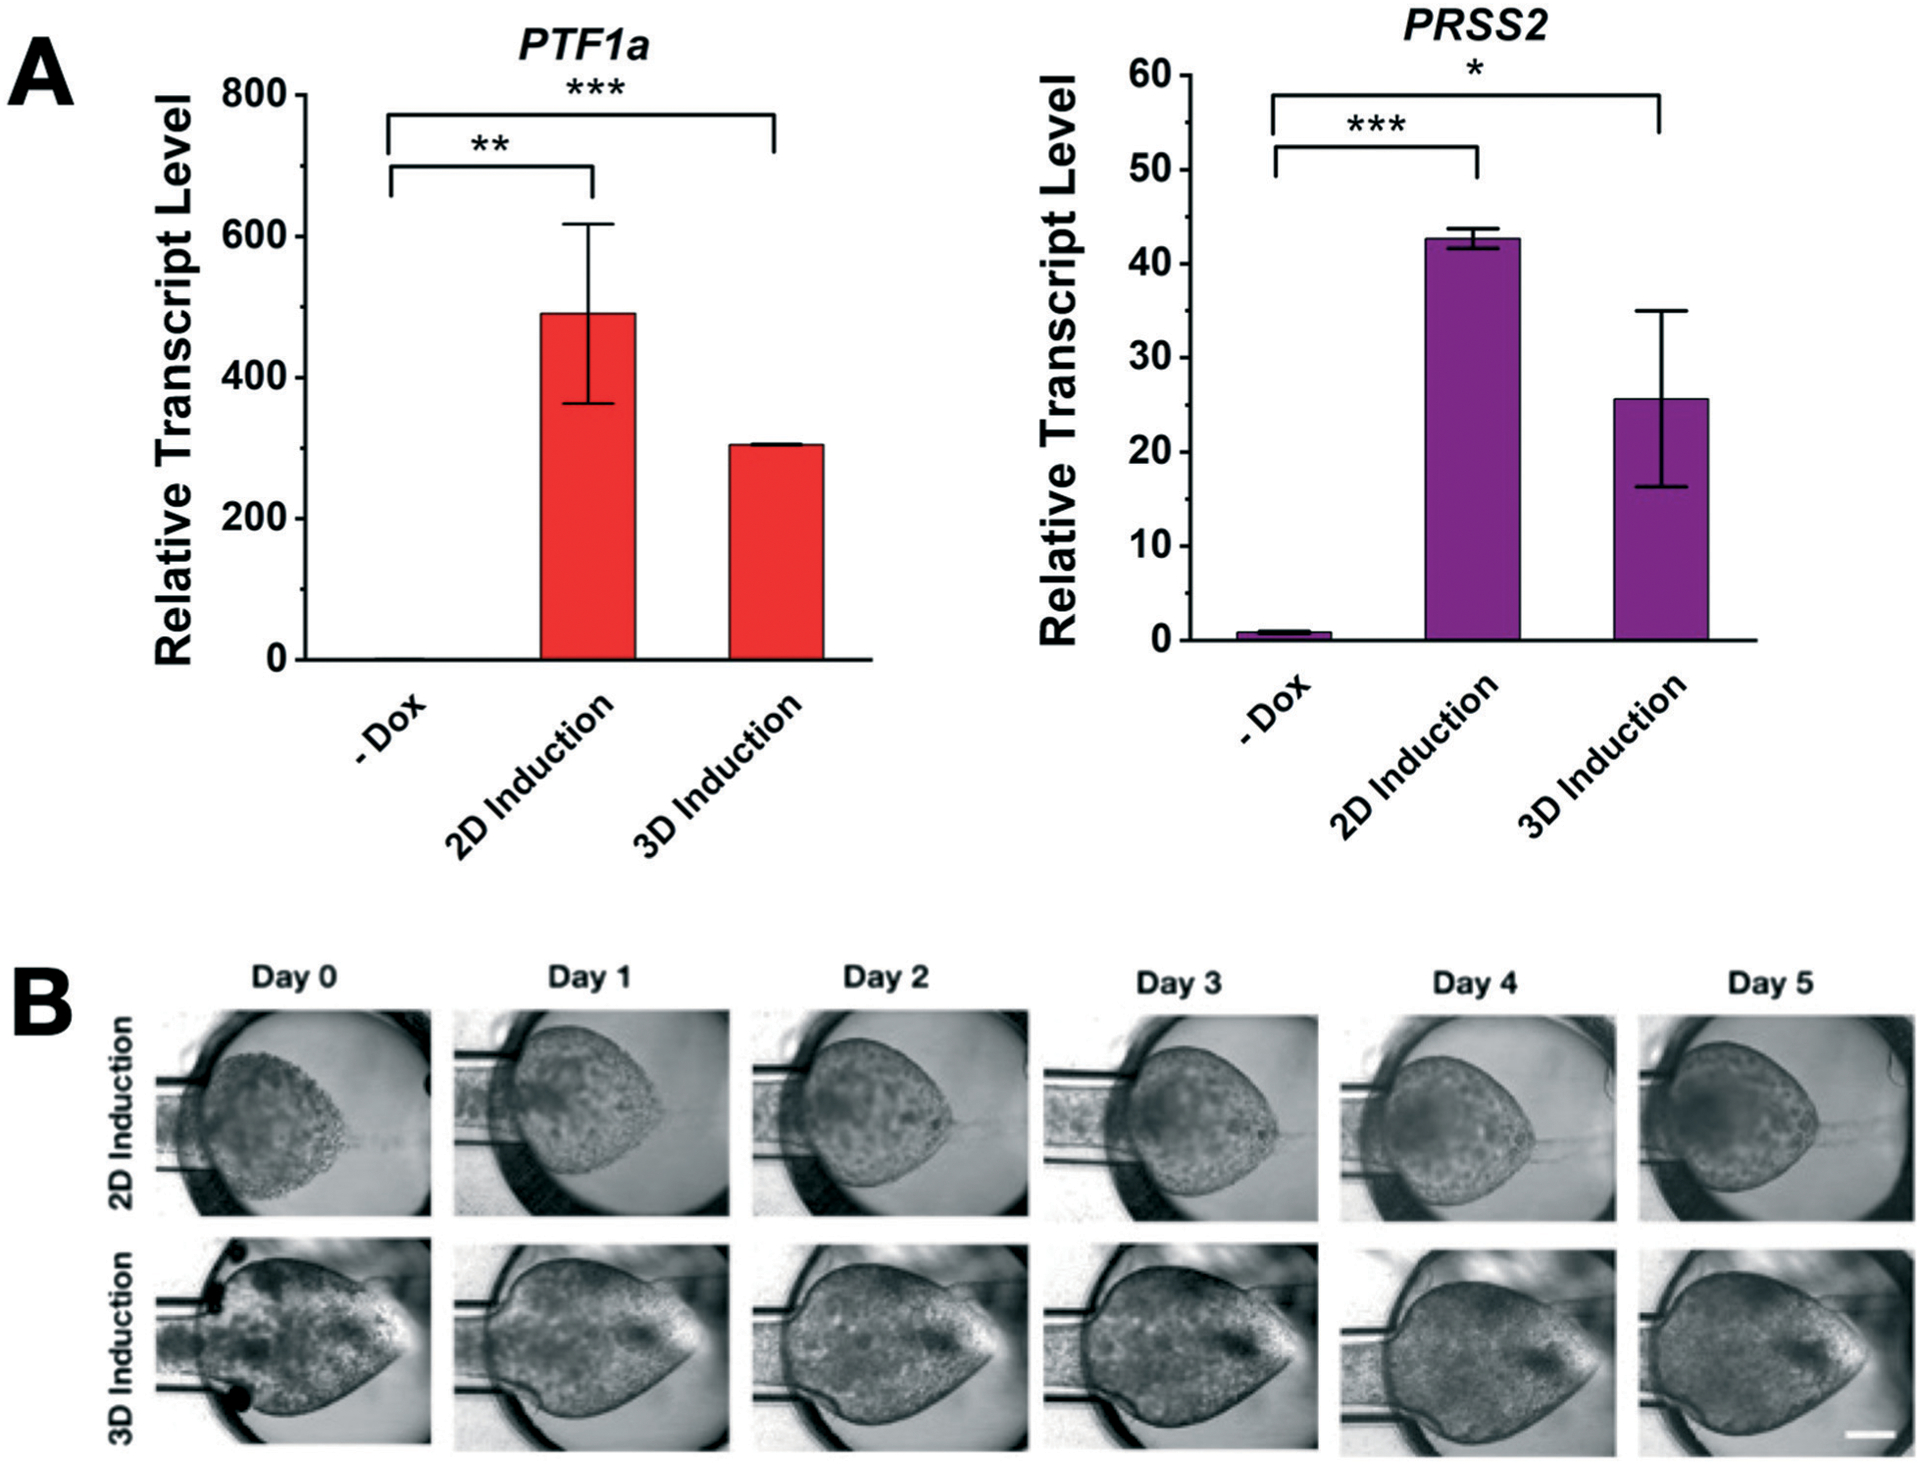
Effects of the sequence of PTF1a induction and cell loading on the pancreatic acinus-on-chip (PAC) model. (A) Effects of PTF1a induction depending on the induction and loading sequence. Cells are harvested and loaded after induction (2D induction) whereas cells are induced by the dox treatment after loading to the PAC (3D induction). Regardless of induction environment, Panc-1 Tet-PTF1a cells can be reprogrammed into functional acinus cells expressing high levels of PTF1a and PRSS2 (* p < 0.05, ** p < 0.01, *** p < 0.001). (B) Time-lapse micrographs of the PAC with 2D and 3D induction of PTF1a. Both induction schemes can create the normal acinus in the PAC platform. No notable differences are observed.
Characterization of exocrine functions of the PAC model is presented in Fig. 6. Immunofluorescence microscopy confirms the acinar-like properties, as presented in Fig. 6A. With Dox treatment, E-cadherin is clearly expressed between the cells and the formation of tight cell–cell adhesion is confirmed similar to normal acini. The amount of trypsinogen (i.e., PRSS2) within the treated cells is greater than that of the untreated group. Without Dox treatment, no E-cadherin was detected.
Fig. 6.

Functional validation of the pancreatic acinus-on-chip (PAC) model. (A) Immunofluorescence micrographs of E-cadherin and PRSS2. With Dox treatment, the cells highly express E-cadherin and PRSS2, which suggests normal acinar phenotypes. (B) Representative TEM micrographs of the PAC. In the Dox treatment group, zymogen granules (noted with solid arrows) are produced and localized near the apical side. A granule during exocytosis is surrounded by the plasma membrane (noted with hollow arrows). Without Dox treatment, only smaller granules (<20 nm) are observed. (C) TEM micrographs of normal pancreatic acinar cell. Zymogen granles (noted with arrows and ZG) produced and transported to the cavity by exocytosis. Redrawn from Gorelick and Jamieson,42 with permission from Elsevier.
The transmission electron microscopy (TEM) micrographs for the PTF1a induction group (+Dox) clearly show zymogen granules (noted with solid arrows), intracellular organelles packaging digestive enzymes (Fig. 6B upper panels). The size of granules ranges from 400 nm up to 1.2 μm, which matches well with the granules from native acinus.40–42 These granules are localized near the apical region facing toward the central lumen. Some granules are extruded toward the lumen surrounded by the plasma membrane (noted with hollow arrows in the right panel). These TEM micrographs suggest that the PAC can recapitulate acinar’s enzyme secreting process, including production, intracellular trafficking, and exocytosis of zymogen granules. These large granular structures are absent in the no PTF1a induction group (Fig. 6B lower panels). Without PTF1a induction, only small granules (i.e., <20 nm) are observed at a higher magnification but no larger granule structures are developed. All these results strongly suggest that the PAC model can reconstitute a normal and functional acinus of the pancreas using reprogrammed PDAC cancer cells by inducing PTF1a. Although the present model shows the formation of zymogen granules and PRSS2 expressions, further research still warrants to confirm the function of digestive enzyme secretion. As shown in Fig. 6C, functional healthy pancreas acinus can produce a large number of zymogen granules for this exocrine pancreas function.
Discussion
The PAC model addresses one of the key technical challenges to microfabricate acinus geometry, a 3D cavity of the enlarged lumen. Acinus is a saclike portion of many exocrine glands including the pancreas, mammary gland, and salivary gland. Lung alveoli also have acinar sac anatomy, but their function is to exchange gas. As biomimetic technology for tissue and disease models has emerged, it has been actively studied to engineer in vitro models of these tissues. Several techniques have been developed and used to create a tubular lumen structure including 3D printing using sacrificial structures43,44 or pattern a gel by viscous fingering19,20,45 or using rods.46 However, these methods are incapable of creating 3D acinus geometry. Many acinus models, thus, have been developed with a planner layer mimicking a small section of acinar epithelium by layering epithelial cells on the basement membrane,47,48 or with 2D cross-section of 3D cavity.49 Organoid models can mimic the 3D cavity, but these require prolonged culture time.15–17 The present approach of two-step viscous fingering is a simple procedure to create the 3D cavity attached to an epithelial duct, and easily adaptable to a high throughput format.
The present PAC model demonstrates a new way to create normal functional tissue models by use of the reprogrammable PDAC cell line, Panc-1 Tet-PTF1a, to yield functional acinar cells. Most prior attempts to create in vitro acinar models have relied on progenitor or pluripotent cells which can differentiate into acinar cells.15–17 Creation of a normal tissue model using reprogrammed cancer cells is new and has not been explored. Many advantages exist with the present platform over existing models. The use of reprogrammable cancer cells allows for the cells to be cultured for many passages without deterioration, and then induced to become acinar cells easily at the time of experimentation which eliminates a major concern of using isolated acinar cells which quickly lose functionality. Additionally, the in vitro nature of this platform has decreased cost, time requirements, and complexity as compared to animal models.
The RNA-seq results suggest that the induction of PTF1a promotes gene sets involved in pancreatic exocrine development and function, and represses many cancer-associated properties of Panc-1 cells. These cancer-associated properties are EMT-related pathways, cancer stemness, and drug resistance. Pancreatic cancer stem cells, which are reported to express CD44+CD24+ESA+,37,38 are thought to be resistant to gemcitabine and cause metastasis and recurrence. This is confirmed by microscopic observation of drastic changes in the invasiveness of cancer cells after inducing PTF1a expression, and recovery of normal functionality of digestive enzyme production. This implies a therapeutic potential of PTF1a. If this gene could be turned on in the cells of an existing tumor, remission may be possible so this model creates an ideal experimental setup to test preliminary trials of gene therapy based on PTF1a for the treatment of PDAC.
The PAC model provides a novel way of studying pancreatic acinus biology, allowing direct comparison of normal and cancerous epithelial cells with the isogenic origin and its ability to transition from normal to cancerous pancreatic acinus. Moreover, its phenotypes can be easily manipulated by controlling the dosage of doxycycline. This feature is very useful to study the effects of risk factors of pancreatic cancers, in which prolonged exposure of environmental chemicals and carcinogens on the normal pancreas should be monitored.50,51
Conclusions
We have created a new microfluidic model of a pancreatic acinus which presents many advantages over existing models. We have shown that we can mimic the microanatomy of a healthy pancreatic acinus, assess the invasiveness of cells into the surrounding matrix, and stain for key molecular markers within this setup. Our results confirm a decrease in invasiveness after PTF1a induction, as well as the production of a key digestive enzyme, trypsinogen. In this way, we have created a reliable in vitro model of a pancreatic acinus which has many implications for research of pancreatic diseases including but not limited to pancreatic adenocarcinoma.
Supplementary Material
Acknowledgements
This work is partially supported by grants from National Institutes of Health (U01 HL143403, R01 CA254110, UL1 TR002529 to BH, and R01 CA211098, R01 CA124586 to SFK), a Challenge Award from the Purdue University Center for Cancer Research (P30 CA023168), and the Walther Embedding Program in Physical Sciences in Oncology. The SHG microscopy images were obtained at the Purdue Imaging Facility at Bindley Bioscience Center. Electron microscopy was performed with the help of Laurie Mueller in the Life Science Microscopy Facility of Purdue University. The bioinformatics analysis was performed with the Collaborative Core for Cancer Bioinformatics supported by PCCR (P30 CA023168), IUSCC (P30 CA082709) and the Walther Cancer Foundation.
Footnotes
Conflicts of interest
The authors declare no conflicts of interest.
Electronic supplementary information (ESI) available. See DOI: 10.1039/d1lc00350j
Notes and references
- 1.Leung PS and Ip SP, Int. J. Biochem. Cell Biol, 2006, 38, 1024–1030. [DOI] [PubMed] [Google Scholar]
- 2.Peery AF, Dellon ES, Lund J, Crockett SD, McGowan CE, Bulsiewicz WJ, Gangarosa LM, Thiny MT, Stizenberg K, Morgan DR, Ringel Y, Kim HP, DiBonaventura MD, Carroll CF, Allen JK, Cook SF, Sandler RS, Kappelman MD and Shaheen NJ, Gastroenterology, 2012, 143, 1179–1187.e1173. [DOI] [PMC free article] [PubMed] [Google Scholar]
- 3.Siegel RL, Miller KD and Jemal A, Ca-Cancer J. Clin, 2019, 69, 7–34. [DOI] [PubMed] [Google Scholar]
- 4.Bryant KL, Mancias JD, Kimmelman AC and Der CJ, Trends Biochem. Sci, 2014, 39, 91–100. [DOI] [PMC free article] [PubMed] [Google Scholar]
- 5.Hruban RH, Wilentz RE and Kern SE, Am. J. Pathol, 2000, 156, 1821–1825. [DOI] [PMC free article] [PubMed] [Google Scholar]
- 6.Pasca di Magliano M, Sekine S, Ermilov A, Ferris J, Dlugosz AA and Hebrok M, Genes Dev., 2006, 20, 3161–3173. [DOI] [PMC free article] [PubMed] [Google Scholar]
- 7.Witkiewicz AK, Borja NA, Franco J, Brody JR, Yeo CJ, Mansour J, Choti MA, McCue P and Knudsen ES, Oncotarget, 2015, 6, 15788–15801. [DOI] [PMC free article] [PubMed] [Google Scholar]
- 8.Ferreira RMM, Sancho R, Messal HA, Nye E, Spencer-Dene B, Stone RK, Stamp G, Rosewell I, Quaglia A and Behrens A, Cell Rep., 2017, 21, 966–978. [DOI] [PMC free article] [PubMed] [Google Scholar]
- 9.Bailey P, Chang DK, Nones K, Johns AL, Patch A-M, Gingras M-C, Miller DK, Christ AN, Bruxner TJC, Quinn MC, Nourse C, Murtaugh LC, Harliwong I, Idrisoglu S, Manning S, Nourbakhsh E, Wani S, Fink L, Holmes O, Chin V, Anderson MJ, Kazakoff S, Leonard C, Newell F, Waddell N, Wood S, Xu Q, Wilson PJ, Cloonan N, Kassahn KS, Taylor D, Quek K, Robertson A, Pantano L, Mincarelli L, Sanchez LN, Evers L, Wu J, Pinese M, Cowley MJ, Jones MD, Colvin EK, Nagrial AM, Humphrey ES, Chantrill LA, Mawson A, Humphris J, Chou A, Pajic M, Scarlett CJ, Pinho AV, Giry-Laterriere M, Rooman I, Samra JS, Kench JG, Lovell JA, Merrett ND, Toon CW, Epari K, Nguyen NQ, Barbour A, Zeps N, Moran-Jones K, Jamieson NB, Graham JS, Duthie F, Oien K, Hair J, Grützmann R, Maitra A, Iacobuzio-Donahue CA, Wolfgang CL, Morgan RA, Lawlor RT, Corbo V, Bassi C, Rusev B, Capelli P, Salvia R, Tortora G, Mukhopadhyay D, Petersen GM, Munzy DM, Fisher WE, Karim SA, Eshleman JR, Hruban RH, Pilarsky C, Morton JP, Sansom OJ, Scarpa A, Musgrove EA, Bailey U-MH, Hofmann O, Sutherland RL, Wheeler DA, Gill AJ, Gibbs RA, Pearson JV, Waddell N, Biankin AV and Grimmond SM, Nature, 2016, 531, 47–52. [DOI] [PubMed] [Google Scholar]
- 10.Jakubison BL, Schweickert PG, Moser SE, Yang Y, Gao H, Scully K, Itkin-Ansari P, Liu Y and Konieczny SF, Mol. Oncol, 2018, 12, 1104–1124. [DOI] [PMC free article] [PubMed] [Google Scholar]
- 11.Hyun JJ and Lee HS, Clin. Endosc, 2014, 47, 212. [DOI] [PMC free article] [PubMed] [Google Scholar]
- 12.Su KH, Cuthbertson C and Christophi C, HPB, 2006, 8, 264–286. [DOI] [PMC free article] [PubMed] [Google Scholar]
- 13.Shi G, DiRenzo D, Qu C, Barney D, Miley D and Konieczny SF, Oncogene, 2012, 32, 1950–1958. [DOI] [PMC free article] [PubMed] [Google Scholar]
- 14.Singh L, Bakshi DK, Vasishta RK, Arora SK, Majumdar S and Wig JD, Dig. Dis. Sci, 2008, 53, 2569–2575. [DOI] [PubMed] [Google Scholar]
- 15.Greggio C, Franceschi FD, Figueiredo-Larsen M, Gobaa S, Ranga A, Semb H, Lutolf M and Grapin-Botton A, Development, 2013, 140, 4452–4462. [DOI] [PMC free article] [PubMed] [Google Scholar]
- 16.Huch M, Bonfanti P, Boj SF, Sato T, Loomans CJM, van de Wetering M, Sojoodi M, Li VSW, Schuijers J, Gracanin A, Ringnalda F, Begthel H, Hamer K, Mulder J, van Es JH, de Koning E, Vries RGJ, Heimberg H and Clevers H, EMBO J., 2013, 32, 2708–2721. [DOI] [PMC free article] [PubMed] [Google Scholar]
- 17.Sugiyama T, Benitez CM, Ghodasara A, Liu L, McLean GW, Lee J, Blauwkamp TA, Nusse R, Wright CVE, Gu G and Kim SK, Proc. Natl. Acad. Sci. U. S. A, 2013, 110, 12691–12696. [DOI] [PMC free article] [PubMed] [Google Scholar]
- 18.Jayaveni S, Nithyanandham K and Rose C, Biochem. Biophys. Rep, 2016, 5, 237–245. [DOI] [PMC free article] [PubMed] [Google Scholar]
- 19.Bischel LL, Young EWK, Mader BR and Beebe DJ, Biomaterials, 2013, 34, 1471–1477. [DOI] [PMC free article] [PubMed] [Google Scholar]
- 20.Bradney MJ, Venis SM, Yang Y, Konieczny SF and Han B, Small, 2020, 1905500, DOI: 10.1002/smll.201905500. [DOI] [PMC free article] [PubMed] [Google Scholar]
- 21.Kramer A, Green J, Pollard J Jr. and Tugendreich S, Bioinformatics, 2014, 30, 523–530. [DOI] [PMC free article] [PubMed] [Google Scholar]
- 22.Subramanian A, Tamayo P, Mootha VK, Mukherjee S, Ebert BL, Gillette MA, Paulovich A, Pomeroy SL, Golub TR, Lander ES and Mesirov JP, Proc. Natl. Acad. Sci. U. S. A, 2005, 102, 15545–15550. [DOI] [PMC free article] [PubMed] [Google Scholar]
- 23.Beres TM, Masui T, Swift GH, Shi L, Henke RM and MacDonald RJ, Mol. Cell. Biol, 2006, 26, 117–130. [DOI] [PMC free article] [PubMed] [Google Scholar]
- 24.Hess DA, Humphrey SE, Ishibashi J, Damsz B, Lee AH, Glimcher LH and Konieczny SF, Gastroenterology, 2011, 141, 1463–1472. [DOI] [PMC free article] [PubMed] [Google Scholar]
- 25.Jiang M, Azevedo-Pouly AC, Deering TG, Hoang CQ, DiRenzo D, Hess DA, Konieczny SF, Swift GH and MacDonald RJ, Mol. Cell. Biol, 2016, 36, 2945–2955. [DOI] [PMC free article] [PubMed] [Google Scholar]
- 26.Masui T, Long Q, Beres TM, Magnuson MA and MacDonald RJ, Genes Dev., 2007, 21, 2629–2643. [DOI] [PMC free article] [PubMed] [Google Scholar]
- 27.Hoang CQ, Hale MA, Azevedo-Pouly AC, Elsasser HP, Deering TG, Willet SG, Pan FC, Magnuson MA, Wright CV, Swift GH and MacDonald RJ, Mol. Cell. Biol, 2016, 36, 3033–3047. [DOI] [PMC free article] [PubMed] [Google Scholar]
- 28.Sakikubo M, Furuyama K, Horiguchi M, Hosokawa S, Aoyama Y, Tsuboi K, Goto T, Hirata K, Masui T, Dor Y, Fujiyama T, Hoshino M, Uemoto S and Kawaguchi Y, Sci. Rep, 2018, 8, 15812. [DOI] [PMC free article] [PubMed] [Google Scholar]
- 29.Cukierman E and Bassi DE, Semin. Cancer Biol, 2010, 20, 139–145. [DOI] [PMC free article] [PubMed] [Google Scholar]
- 30.Goetz JG, Minguet S, Navarro-Lérida I, Lazcano JJ, Samaniego R, Calvo E, Tello M, Osteso-Ibáñez T, Pellinen T, Echarri A, Cerezo A, Klein-Szanto AJP, Garcia R, Keely PJ, Sánchez-Mateos P, Cukierman E and Del Pozo MA, Cell, 2011, 146, 148–163. [DOI] [PMC free article] [PubMed] [Google Scholar]
- 31.Kaur A, Ecker BL, Douglass SM, Kugel CH, Webster MR, Almeida FV, Somasundaram R, Hayden J, Ban E and Ahmadzadeh H, Cancer Discovery, 2019, 9, 64–81. [DOI] [PMC free article] [PubMed] [Google Scholar]
- 32.Bulle A and Lim KH, Signal Transduction Targeted Ther., 2020, 5, 249. [DOI] [PMC free article] [PubMed] [Google Scholar]
- 33.Zheng X, Carstens JL, Kim J, Scheible M, Kaye J, Sugimoto H, Wu C-C, LeBleu VS and Kalluri R, Nature, 2015, 527, 525–530. [DOI] [PMC free article] [PubMed] [Google Scholar]
- 34.Dongre A and Weinberg RA, Nat. Rev. Mol. Cell Biol, 2019, 20, 69–84. [DOI] [PubMed] [Google Scholar]
- 35.Porter RL, Magnus NKC, Thapar V, Morris R, Szabolcs A, Neyaz A, Kulkarni AS, Tai E, Chougule A, Hillis A, Golczer G, Guo H, Yamada T, Kurokawa T, Yashaswini C, Ligorio M, Vo KD, Nieman L, Liss AS, Deshpande V, Lawrence MS, Maheswaran S, Castillo CF-D, Hong TS, Ryan DP, O’Dwyer PJ, Drebin JA, Ferrone CR, Haber DA and Ting DT, Proc. Natl. Acad. Sci. U. S. A, 2019, 116, 26835–26845. [DOI] [PMC free article] [PubMed] [Google Scholar]
- 36.Raj D, Aicher A and Heeschen C, Stem Cells, 2015, 33, 2893–2902. [DOI] [PubMed] [Google Scholar]
- 37.Simeone DM, Clin. Cancer Res, 2008, 14, 5646–5648. [DOI] [PubMed] [Google Scholar]
- 38.Li Y, Kong D, Ahmad A, Bao B and Sarkar FH, Cancer Lett., 2013, 338, 94–100. [DOI] [PMC free article] [PubMed] [Google Scholar]
- 39.Ishiwata T, Matsuda Y, Yoshimura H, Sasaki N, Ishiwata S, Ishikawa N, Takubo K, Arai T and Aida J, Pathol. Oncol. Res, 2018, 24, 797–805. [DOI] [PubMed] [Google Scholar]
- 40.Liebow C and Rothman SS, Am. J. Physiol, 1973, 225, 258–262. [DOI] [PubMed] [Google Scholar]
- 41.Nadelhaft I, Biophys. J, 1973, 13, 1014–1029. [DOI] [PMC free article] [PubMed] [Google Scholar]
- 42.Gorelick FS, Pandol S and Jamieson JD, in Physiology of the gastrointestinal tract, Elsevier, 2018, pp. 869–894. [Google Scholar]
- 43.Miller JS, Stevens KR, Yang MT, Baker BM, Nguyen D-HT, Cohen DM, Toro E, Chen AA, Galie PA, Yu X, Chaturvedi R, Bhatia SN and Chen CS, Nat. Mater, 2012, 11, 768–774. [DOI] [PMC free article] [PubMed] [Google Scholar]
- 44.Kolesky DB, Homan KA, Skylar-Scott MA and Lewis JA, Proc. Natl. Acad. Sci. U. S. A, 2016, 201521342, DOI: 10.1073/pnas.1521342113. [DOI] [PMC free article] [PubMed] [Google Scholar]
- 45.Moon HR, Ospina-Munoz N, Noe-Kim V, Yang Y, Elzey BD, Konieczny SF and Han B, PLoS One, 2020, 15, e0234012. [DOI] [PMC free article] [PubMed] [Google Scholar]
- 46.Jimenez-Torres JA, Peery SL, Sung KE and Beebe DJ, Adv. Healthcare Mater, 2016, 5, 198–204. [DOI] [PMC free article] [PubMed] [Google Scholar]
- 47.Mun KS, Arora K, Huang Y, Yang F, Yarlagadda S, Ramananda Y, Abu-El-Haija M, Palermo JJ, Appakalai BN, Nathan JD and Naren AP, Nat. Commun, 2019, 10, 3124. [DOI] [PMC free article] [PubMed] [Google Scholar]
- 48.Bein A, Shin W, Jalili-Firoozinezhad S, Park MH, Sontheimer-Phelps A, Tovaglieri A, Chalkiadaki A, Kim HJ and Ingber DE, Cell. Mol. Gastroenterol. Hepatol, 2018, 5, 659–668. [DOI] [PMC free article] [PubMed] [Google Scholar]
- 49.Fishler R, Hofemeier P, Etzion Y, Dubowski Y and Sznitman J, Sci. Rep, 2015, 5, 14071. [DOI] [PMC free article] [PubMed] [Google Scholar]
- 50.Antwi SO, Eckert EC, Sabaque CV, Leof ER, Hawthorne KM, Bamlet WR, Chaffee KG, Oberg AL and Petersen GM, Cancer Causes Control, 2015, 26, 1583–1591. [DOI] [PMC free article] [PubMed] [Google Scholar]
- 51.Hocevar SE, Kamendulis LM and Hocevar BA, J. Biochem. Mol. Toxicol, 2020, 34, e22561. [DOI] [PMC free article] [PubMed] [Google Scholar]
Associated Data
This section collects any data citations, data availability statements, or supplementary materials included in this article.