

Abstract
Hydrogen peroxide is produced upon radiolysis of water and has been shown to be the main oxidant driving oxidative dissolution of UO2-based nuclear fuel under geological repository conditions. While the overall mechanism and speciation are well known for granitic groundwaters, considerably less is known for saline waters of relevance in rock salt or during emergency cooling of reactors using seawater. In this work, the ternary uranyl–peroxo–chloro and uranyl–peroxo–bromo complexes were identified using IR, Raman, and nuclear magnetic resonance (NMR) spectroscopy. Based on Raman spectra, the estimated stability constants for the identified uranyl–peroxo–chloro ((UO2)(O2)(Cl)(H2O)2–) and uranyl–peroxo–bromo ((UO2)(O2)(Br)(H2O)2–) complexes are 0.17 and 0.04, respectively, at ionic strength ≈5 mol/L. It was found that the uranyl–peroxo–chloro complex is more stable than the uranyl–peroxo–bromo complex, which transforms into studtite at high uranyl and H2O2 concentrations. Studtite is also found to be dissolved at a high ionic strength, implying that this may not be a stable solid phase under very saline conditions. The uranyl–peroxo–bromo complex was shown to facilitate H2O2 decomposition via a mechanism involving reactive intermediates.
Short abstract
Aqueous solutions containing UO22+ and H2O2 are stabilized by the presence of chloride. This is attributed to the formation of uranyl−chloro and uranyl−peroxo−chloro complexes preventing the precipitation of studtite. The existence of these complexes was confirmed using IR, Raman, and NMR spectroscopies.
Introduction
One of the major challenges of the nuclear industry is to handle the highly radiotoxic used nuclear fuel after removal from a nuclear reactor. Several strategies for handling the used fuel have been proposed, but only two have been developed to a mature state. One strategy is to reprocess the used fuel and recover material that can be used to produce new fuel, and the other strategy is the permanent placement of the used nuclear fuel in a geological repository. In the latter case, natural and engineered barriers will prevent the radionuclides from the used nuclear fuel from reaching the biosphere before the radioactivity of the fuel has reached levels corresponding to the specific activity of a naturally occurring uranium ore (in the order of 105 years). Reprocessing will also generate highly radioactive waste, but since this is generally more short-lived, a repository for this radioactive material does not have to maintain barrier integrity for the same extended period of time. A key issue for the design, construction, and licensing of a geological repository for radioactive waste is to perform reliable safety assessments. A scenario that has to be addressed in such a safety assessment is groundwater intrusion as a consequence of multiple barrier failure.
Used or spent commercial nuclear fuel is composed of 95% UO2, and the remaining fraction consists of fission products and heavier actinides.1−3 The fuel matrix, UO2, has very low solubility in the slightly reducing groundwaters found at the planned locations of several repositories. However, radiolysis of groundwater adjacent to the fuel surface, caused by the inherent radioactivity of the fuel, will produce oxidizing (HO•, HOO•, and H2O2) as well as reducing (eaq–, H•, and H2) species.4,5 For kinetic reasons, the oxidants will dominate the surface reactions initially and oxidize the UO2 matrix from U(IV) to considerably more soluble U(VI) and thereby enable dissolution of the fuel matrix and the subsequent release of the highly radiotoxic fission products and heavy actinides into the biosphere.6,7 Oxidized UO2 is released as uranyl (UO22+), which is a good electron acceptor in solution, and therefore tends to coordinate with Lewis base ligands. It is well known that UO22+ can form complexes and clusters with a wide variety of Lewis base ligands such as water, carbonate, hydroxide, peroxide, and halides.8−10 Vallet et al.11 reported the affinity of the ligands to increase in the order H2O < Cl– < F– < OH– < CO32– < O22– based on quantum chemical calculations. UO22+ binding to O22– in aqueous solution at low concentrations of competing ligands can precipitate as studtite at ambient temperature and as meta-studtite at temperatures higher than 70 °C.12,13 Studtite and meta-studtite are the only two uranyl peroxide minerals found in nature,14 and they have also been found on the surface of spent nuclear fuel,15 on the “lava” of the Chernobyl disaster,16 and on damaged reactor cores after the Fukushima nuclear accident.17
In addition to uranyl peroxides, investigations of complexes formed between UO22+ and chloride and bromide in aqueous systems have also received renewed attention. In particular, the chloro complexes are important in the speciation of uranium in the biosphere and dissolution of the UO2 fuel matrix under certain conditions.18,19 Nguyen-Trung et al.10 and Takao et al.20 reported that the relative strength of uranyl halide complexes follows the order I– < Br– < Cl– < F–. In addition, Grenthe et al.21 investigated the coordination of UO22+ with Cl– and Br– in aqueous systems. It was shown that uranyl and chloride can form uranyl monochloro complex UO2Cl+ with the logarithmic gross stability constants log β1 = 0.17 ± 0.02 at zero ionic strength and uranyl dichloro complex UO2Cl2 (log β2 = −1.1 ± 0.4, I = 0). However, Br– was found to only form monobromo complex UO2Br+ with UO22+ (log β1 = 0.22 ± 0.02), at zero ionic strength. In addition, Soderholm et al.22 also studied the coordination between UO22+ and Cl– in aqueous system at a constant ionic strength of 5.3 m. It was reported that the maximum number of coordinated Cl– is 3 and the stability constants were found to be β1 = 1.5 ± 0.01, β2 = 0.8 ± 0.04, and β3 = 0.4 ± 0.01.
Uranyl halide complexes are of practical importance in mainly two situations: (1) If seawater is used for emergency cooling of the core of a damaged nuclear reactor (e.g., in the Fukushima nuclear accident after which 1.25 million tonnes of seawater have been pumped through the damaged units to prevent the molten fuel debris from overheating, and pumping continues.23−25 The concentration of Cl– has been reported as 0.6 M in the pacific ocean near Fukushima26); (2) If a deep geological repository for spent nuclear fuel is placed in rock salt as a host rock. This is an option that has been considered by several countries.27−29 Upon water intrusion following barrier failure, the spent nuclear fuel would come in contact with highly saline water. In both situations, uranyl–chloro complexes may play an important role. According to Hata et al.30 the radiation chemical yield of H2O2 in γ radiolysis of water is only marginally affected at Cl– concentrations below 1 M (decreases by 10% at 0.6 M Cl–).
In a very recent work, the H2O2-induced oxidative dissolution of UO2 in saline aqueous solutions was partly explained by the formation of ternary uranyl–peroxo–chloro and uranyl–peroxo–bromo complexes.19 The existence of ternary uranyl–peroxo complexes is well established in carbonate-containing solutions, where uranyl–peroxo–carbonate complexes are formed and in alkaline solutions where uranyl–peroxo–hydroxo complexes can be formed.31,32 Previous studies have shown that studtite and meta-studtite can dissolve and transform into the ternary complexes under these conditions.12 Given the indirect indication of the existence of ternary uranyl–peroxo–halo complexes and their potential importance in understanding spent nuclear fuel dissolution in saline solutions, it is essential to investigate their possible existence and properties using more direct methods. According to a DFT study by Odoh and Schreckenbach,33 the uranyl–peroxo–fluoro complex could possibly exist, but to the best of our knowledge, no experimental or theoretical work has reported the existence of the corresponding chloro or bromo complexes.
In this work, we have explored the possible existence and properties of uranyl–peroxo–chloro/bromo complexes in aqueous solution using IR (ATR-IR), TIR-Raman, and NMR (35Cl NMR and 17O NMR) spectroscopies in combination with time-resolved measurements of uranium and hydrogen peroxide concentrations in solution.
Experimental Procedures
All solutions were prepared using Milli-Q water (18.2 MΩ cm), and all chemicals used were of reagent grade unless otherwise stated. Uranyl nitrate (UO2(NO3)2·6H2O, Merck), hydrogen peroxide 30% (Merck), and sodium halide salts including NaCl (Sigma-Aldrich), NaBr (Acros Organics), NaClO4 (Sigma-Aldrich), as well as sodium bicarbonate (NaHCO3, Merck) were used to prepare stock solutions, which were then diluted to the desired concentrations of UO22+, H2O2, Cl,– Br–, ClO4–, and HCO3–, respectively.
The concentration of H2O2 was measured using the Ghormley triiodide method, where I– is first oxidized to I3– by H2O2, and then the absorbance of I3– was measured by UV/vis spectrophotometry (λ = 360 nm).34,35 The concentration of U(VI) in solution was measured using the Arsenazo III method, where uranyl reacts with the Arsenazo III reagent forming a stable complex in acidic media. The absorbance of the formed complex was measured at λ = 653 nm by UV/vis spectrophotometry.36 Potassium iodide (Merck) and Arsenazo III (Sigma-Aldrich) were used in the Ghormley triiodide method and Arsenazo III method. The analysis was performed in duplicate for each measurement of H2O2 and U(VI) concentration. The difference between the duplicate measurements was less than 2.3 and 0.82 μM for H2O2 and U(VI), respectively. All experiments were performed at least three times. The error bars in the figures reflect the results of these experiments and are based on the standard deviation derived from the three repetitions of each experiment.
Studtite Formation Dynamics in Halide Solutions
UO22+ and H2O2 (both 0.2 mM) were added to aqueous solutions of different concentrations of halide and perchlorate (from 10 mM to 1 M) in a total volume of 25 mL. The concentrations of UO22+ and H2O2 were measured as a function of time for 24 h. The pH of the solution was recorded before and after each experiment.
XRD (for the Precipitates Formed in Halide Solutions)
The precipitates formed in the solution after mixing 20 mM H2O2 and 20 mM U(VI) in 2 M NaCl or NaBr solution for 5 days was first dried in air and then characterized using powder X-ray diffraction (XRD). XRD patterns were recorded at room temperature using a PANalytical X’Pert PRO diffractometer using a Bragg–Brentano geometry and Cu Kα radiation (1.5418 Å) in a 2θ range between 10 and 80°. The powder sample was ground manually in an agate mortar.
Spectroscopic Studies of the Formation of Uranyl Complexes
The complexes formed in solutions containing 20 mM UO22+ in H2O and 5 M Cl– or Br– with and without the presence of 20 mM H2O2 were characterized by ATR-IR, Raman, and NMR spectroscopies.
IR and Raman Spectroscopies
The IR spectra were collected in a Fourier transform infrared (FT-IR) spectrometer (Nicole iS10, Thermo Scientific). The universal diamond attenuated total reflectance (ATR) sampling accessory was used for all of the measurements. The IR resolution in the IR spectra is <4 cm–1. The Raman spectra were obtained with a home-built spectrometer.37 The laser source is a highly stable CW laser with a wavelength of 532 nm (Laser Quantum, U.K.). An external polarizer and a half-wave plate were used to precisely control the polarization of the incident laser beam. The Raman scattered light is collected using an ultralong working distance objective (M-Plan Apo 50X, N.A. 0.55, Mitotoyo, Japan) with a 90° angle configuration. The objective is attached to a modified upright Axio microscope (Zeiss, Germany). The Raman scattered light is then passed through a long-pass filter (Semrock-Razor Edge), an achromatic half-wave plate, and a polarizer (Thorlabs), before being focused to a spectrograph slit (Shamrock-Andor, Ireland) and detected by a CCD camera (Newton 940-Andor, Ireland). Since the scattered light can be unpolarized, even if the excitation source is polarized depending on the type of vibration, the second polarizer ensures that the polarization of the scattered light entering the spectrograph slit is always vertical (linearly polarized). The half-wave plate changes the polarization component of the scattered light between parallel (I||) and perpendicular (I⊥) with respect to the polarization direction of the incident laser beam. The I|| polarization combination was used for all Raman measurements in this work. Only liquid samples were measured in this work. These samples were put in a 0.7 mL glass vial and sealed with an aluminum cap (VWR). During the measurement, the incident laser was focused on the bulk of the solution.
35Cl NMR and 17O NMR
The 35Cl (39.2 MHz) and 17O (54.2 MHz) NMR spectra were recorded at 298 K on a Bruker DMX-400 spectrometer using a 10 mm normal broadband probe. The probe temperature was measured by a calibrated Pt-100 resistance thermometer and adjusted using a Bruker Eurotherm variable-temperature control unit. The samples were prepared by adding 10% v/v D2O for lock and were transferred to 10 mm NMR tubes. The samples for 17O NMR experiments were prepared from 17O-enriched uranyl nitrate stock solution. It was prepared by dissolving UO2(NO3)2·6H2O in 17O-enriched water (Isotec, Inc., 29.0% 17O) in a quartz cuvette followed by UV irradiation overnight. The process resulted in ca. 15% 17O isotope enrichment of the uranyl site when isotope equilibrium was reached. The 35Cl spectra are referenced to the 35Cl signal of 5 M NaCl in H2O (in the presence of 10% v/v D2O), while the 17O NMR spectra are referenced to 17O NMR signal of tap water, both measured at 298 K.
Results and Discussion
As uranyl halide complexes are always considered to be weak complexes, speciation calculations were performed for systems containing 0–5 M Cl– or Br– with 0.2 or 20 mM UO22+ using equilibrium constants of uranyl–hydroxo and uranyl–chloro or −bromo complexes21 (Figures S1–S4 and Table S1). The calculations show that the uranyl–chloro/bromo complexes are the dominating species in the solutions at high Cl– or Br– concentrations, respectively.
Time-Resolved Studies of [UO22+] and [H2O2] in Aqueous Solutions
The stability of H2O2 and UO22+ in aqueous solutions containing 0.2 mM UO22+ and 0.2 mM H2O2 was studied as a function of Cl–, Br–, and ClO4– concentrations, respectively. The concentrations were varied from 10 mM to 1 M. The results were compared to a reference sample with H2O as a solvent. The pH values for all of the samples were measured before and after the experiments (shown in Table S2). In Figure 1, the results for 1 M Cl–, Br–, and ClO4– are presented together with the reference sample.
Figure 1.

Concentrations of H2O2 (left) and UO22+ (right) in 1 M Cl–, Br–, ClO4– solutions and H2O as a function of time.
As can be seen in Figure 1, the concentrations of UO22+ and H2O2 decrease fairly rapidly in the reference sample. During the experiment, the solution becomes hazy and a precipitate is formed. As has been shown in several previous studies, the precipitate is studtite.17,38−40 In solutions containing 1 M Cl– and 1 M ClO4–, neither the UO22+ nor the H2O2 concentration change with time, indicating that studtite formation is prevented by both ions. As ClO4– is not expected to form complexes with UO22+, the stabilizing effect of Cl– and ClO4– must be attributed to an ionic strength effect. As an increased ionic strength would facilitate particle aggregation and precipitation, the observed ionic strength effect must be attributed to processes prior to nucleation. In studtite, negatively charged peroxo groups link the positively charged uranyl ions and we speculate that the kinetics of the linking process becomes slower at increasing ionic strength as the process involves attractive electrostatic forces. In the solution containing 1 M Br–, it is evident that the UO22+ concentration remains constant during the experiment, while the H2O2 concentration is decreasing. The fact that only the H2O2 concentration decreases during the experiment indicates that studtite is not formed and the H2O2 consumption must be attributed to another process. It is interesting to note that the same behavior has been observed in solutions containing H2O2, UO22+, and HCO3–.12 The nature of this process will be further discussed later on.
The same type of experiment was repeated at 10, 50, 100, 250, and 500 mM Cl–, Br–, and ClO4–, respectively. The results of these experiments are shown in the Supporting Information (Figures S5–S9). In general, the stability of the solutions decreases with decreasing ionic strength. For the solutions containing Cl– and ClO4–, the decrease in UO22+ concentration parallels the decrease in H2O2 concentration, which indicates that studtite formation is taking place. In most cases, the concentration is initially stable but starts to decrease within a few hours. This could possibly be attributed to slow nucleation. The experiments also show that the stability of the solutions decreases with decreasing concentrations of Cl– or ClO4– and no statistically significant differences can be observed between the two anions.
To get a better overview, the half-lives of UO22+ and H2O2 are plotted as a function of anion concentration in Figure 2.
Figure 2.

Half-lives of H2O2 (a) and UO22+ (b) in solutions containing 0.2 mM H2O2 and 0.2 mM UO22+ with different concentrations of Cl–, Br–, and ClO4–.
Judging from how the half-life of UO22+ changes with anion concentration, the effects of Cl–, Br–, and ClO4– are more or less identical. However, when looking at the half-life for H2O2, it becomes evident that Br– differs from Cl– and ClO4– at higher concentrations. At 0.5 M Br– and higher, the half-life of H2O2 is considerably shorter compared to solutions containing Cl– and ClO4–. At lower concentrations, the half-lives are comparable for all anions, which indicates that the main process consuming H2O2 is studtite formation and the process decomposing H2O2 is of minor importance.
The consumption of H2O2 in solutions with high Br– concentrations where the concentration of UO22+ appears to be stable implies that the presence of Br– and UO22+ can catalyze the decomposition of H2O2. A control experiment with 0.2 mM H2O2 and 1 M Br– (without UO22+) showed that Br– alone does not catalyze the reaction. Hence, both UO22+ and Br– are required for this reaction to occur.
Catalytic decomposition of H2O2 could possibly involve more reactive intermediates assuming that the O–O bond is being broken in this process. If hydroxyl radicals are produced as an intermediate in this system, they would most likely react with Br– and produce Br2•– at the very high Br– concentrations used here. Br2•– is a strong one-electron oxidant that can be detected indirectly. Indigo carmine is a dye that has been used before to quantify the formation of reactive oxidants (radicals).41,42 In a series of experiments we used 40 μM indigo carmine to probe the possible formation of reactive intermediates. Indigo carmine was added to solutions containing 1 M Br–, 0.2 mM H2O2, and 0.2 mM U(VI). In addition, two control experiments were performed with 40 μM indigo carmine. One control experiment was a solution containing only 1 M Br– and 0.2 mM H2O2, and the other was a solution containing only 1 M Br– and 0.2 mM U(VI) in addition to the indigo carmine. The concentration of indigo carmine was measured spectrophotometrically at 610 nm and as a function of time. The results are shown in Figure 3. The pH values for the solution containing 0.2 mM H2O2, 0.2 mM U(VI), and 40 μM indigo carmine in 1 M Br– are 3.6 and 3.9 before and after the experiment, respectively.
Figure 3.

Indigo carmine concentration as a function of time in solutions containing (1) 0.2 mM UO22+, 0.2 mM H2O2, 1 M Br–, and 40 μM indigo carmine (black square); (2) 0.2 mM H2O2, 1 M Br–, and 40 μM indigo carmine (red circle); and (3) 0.2 mM UO22+, 1 M Br–, and 40 μM indigo carmine (blue triangle).
As can be seen, indigo carmine is consumed only in the solution containing 1 M Br–, 0.2 mM H2O2, and 0.2 mM UO22+, but not in any of the control experiments. Therefore, it is reasonable to state that the catalytic decomposition of H2O2 in solutions containing UO22+ and Br– proceeds via the formation of hydroxyl radicals (OH•) or hydroperoxyl radical (HO2•), as the latter has also been shown to be capable of oxidizing indigo carmine.41 As adding uranyl will lead to a decrease in pH, and therefore it is possible that the observed decomposition of H2O2 is acid-catalyzed rather than UO22+-catalyzed.43 For this reason, we performed an additional experiment, in which we adjust pH using HCl for the solution without adding uranyl to the same pH value as the solution adding uranyl. The results are shown in Table S3. As can be seen, the H2O2 decomposition rate in the sample containing 1 M NaBr acidified by HCl is approximately the same as for the sample only containing 1 M NaBr. Hence, we can rule out acid catalysis as the reason for the observed H2O2 decomposition. Interestingly, H2O2 decomposition has also been observed in systems containing H2O2/UO22+/HCO3–.12 As H2O2 decomposition is not observed in systems containing H2O2/UO22+/Cl–, we conclude that the presence of UO22+ in combination with a more easily oxidized ligand like Br– or CO32– is a prerequisite for catalytic decomposition to occur. It is also interesting to note that the rate of H2O2 decomposition is higher at 1 M Br– than at 0.5 M, i.e., there is a Br– concentration dependence (as shown in Figure 2). A plausible mechanism for this process would be: H2O2 + UO22+ + Br– → UO2(O2)Br– + 2H+ → OH• + OH– + UO2Br2+. Since Br– is in excess, it is reasonable to assume the reaction is followed by UO2Br2+ + 2Br– → UO2Br+ + Br2•–.
As the results presented above show that high ionic strength stabilizes UO22+ and H2O2 in solution by preventing the formation of solid studtite, we decided to also study the stability of solid studtite in solutions containing 1 and 5 M of NaCl, NaBr, and NaClO4. Both the H2O2 and the UO22+ concentrations were monitored as a function of time over a period of 10 days. Since H2O2 is quite sensitive to a number of external factors, no conclusive trends could be obtained from the H2O2 concentration variations. UO22+ is not as sensitive to external factors, and therefore we can discuss the studtite stability from these data. The UO22+ concentrations are plotted against time for the different experiments in Figure 4. Every experiment was repeated three times. The pH values for all of the samples were measured before and after the experiments (shown in Table S2).
Figure 4.

Uranyl concentration as a function of time for aqueous studtite powder suspensions containing 1 M or 5 M Cl–, Br–, and ClO4–.
In general, the UO22+ concentrations are low, but it is quite clear that the higher salt concentration has a stronger impact on the dissolution of studtite than the lower salt concentration. More importantly, UO22+ is dissolved more rapidly in solutions containing NaCl and NaBr than in solutions containing NaClO4 at both 1 and 5 M. However, the difference is more pronounced at 5 M. This indicates that this is not only an ionic strength effect. The higher rate of dissolution in NaCl and NaBr compared to NaClO4 could be attributed to the formation of complexes with UO22+ in addition to the ionic strength effect, which is also observed in the solution containing NaClO4. While a high ionic strength alone stabilizes solutions containing UO22+ and H2O2 as reflected by the absence of studtite formation, the observed effect of Br– and Cl– in the studtite dissolution experiments may simply be a kinetic effect attributed to surface complex formation.
Vibrational Spectroscopy
Vibrational spectroscopies, such as IR or Raman spectroscopy, are suitable techniques to characterize species containing UO22+, as previous investigations have shown that UO22+ displays strong active vibrational bands associated with the covalent axial bonds (O=U=O)2+.10,44−50 Specifically, one of the three fundamental vibration modes of UO22+, the symmetric stretch (ν1), is Raman-active, whereas the other two modes, bend (ν2) and antisymmetric stretch (ν3), are IR-active. From Raman spectra, an increase in the ν1 frequency will be observed when H2O is substituted by other inorganic ligands in uranyl–aquo complexes, and similarly, an increase in the ν3 frequency will be observed when the substitution reactions occur in the uranyl–hydrate complex
To obtain detectable concentrations of the uranyl complexes, higher concentrations of UO22+ and H2O2 must be used (higher than 20 mM). Under these conditions, the solutions are not stable even at a high ionic strength (see sample photographs at different times, Figures S10–S15) although the stability of the solutions is still ionic strength-dependent (more stable at high ionic strength). The precipitate formed is identified by XRD as studtite (Figures S16 and S17).51 For this reason, IR and Raman spectra were collected immediately using freshly prepared solutions. No precipitation was observed during the measurement unless otherwise stated. For clarity, Table 1 lists the ranges of concentrations of U(VI), H2O2, and salts used in various characterizing techniques and the time-resolved studies. The pH values for all of the samples were measured after sample preparation (shown in Table S2).
Table 1. Concentrations of U(VI), H2O2 and Salts Used in Present Work.
| [U(VI)] (mM) | [H2O2] (mM) | salt used in experiments | |
|---|---|---|---|
| time-monitoring experiments | 0.2 | 0.2 | 10/50/100/250/500/1000 mM Cl–, Br–, and ClO4– |
| dissolution experiments | no added | no added | 1/5 M Cl–, Br, and ClO4– |
| Raman | 20 | 20 | 5 M Cl–/Br– |
| IR | 20/60 | 20/40 | 5 M Cl–/Br– |
| 35Cl NMR | 20 | 20 | 5 M Cl–, 200 mM HCO3– |
| 17O NMR | 20 | 20 | 5 M Cl–/Br–, 200 mM HCO3– |
Raman Spectroscopy
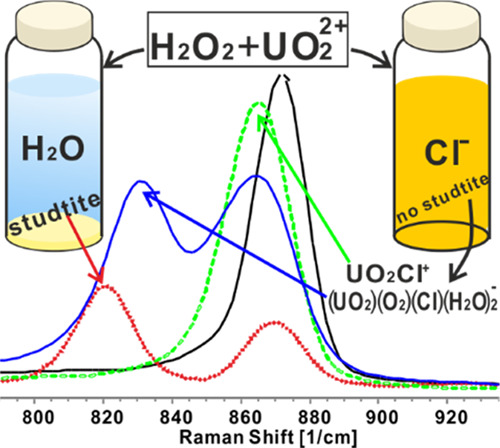
As can be seen in Figures 5 and 6, the solution containing only 20 mM uranyl nitrate (black line) has a peak at 1049 cm–1, which is attributed to NO3–, in line with that reported in the literature.52,53 This peak shifts to 1052 cm–1 at a high ionic strength (i.e., in solutions containing 5 M NaCl or 5 M NaBr). The solution containing only uranyl nitrate also displays a peak at 871.5 cm–1, which can be attributed to the uranyl–aquo complex. This is also in good agreement with the literature (870,10 871,54 872 cm–1 55). According to X-ray scattering experiments and computational studies, the penta–aquo complex UO2(H2O)52+ is the dominating uranyl–aquo species in this system.48 For the solution containing only 20 mM H2O2 (orange dots), a weak peak appears at 877.1 cm–1. This is indicative of the stretching of the O–O bond.56,57 In the solution containing 20 mM U(VI) and 20 mM H2O2 (sky blue dots), a studtite suspension is formed. The Raman spectrum for this system has one uranyl–aquo complex peak and two new peaks at 821 and 735 cm–1. The peak at 821 cm–1 is in agreement with the spectrum for solid studtite found in the literature,17,39,58,59 and the peak at 735 cm–1 indicates amorphous uranyl peroxide.58 The solution containing 20 mM U(VI) and 5 M NaCl (green dashes) shows one peak at 865.3 cm–1 but no peak at 871.5 cm–1, which indicates that the uranyl–aquo complex is quantitatively converted into a complex between U(VI) and Cl–. According to previous studies, the peak at 865.3 cm–1 is attributed to the disubstituted uranyl–chloro complex UO2Cl+.10 In the solution containing 20 mM U(VI) and 5 M NaBr (pink dashes), only a peak at 871 cm–1 is observed. A previous study has reported that a monocoordinated uranyl–bromo complex could exist under these conditions and display a Raman peak that overlaps with that of the uranyl–aquo complex.10 The solution containing 20 mM H2O2, 20 mM U(VI), and 5 M NaCl (blue line) shows one peak at 865.3 cm–1, indicating the presence of the uranyl–chloro complex and one new peak at 831 cm–1 that has not been reported before and that cannot be attributed to any of the individual constituents of the solution. We therefore attribute this peak to a uranyl–peroxo–chloro complex. Interestingly, the solution containing 20 mM H2O2 and 20 mM U(VI) and 5 M NaBr (red line) displays a new peak in addition to the one observed in the solution containing only 20 mM U(VI) and 5 M NaBr. The new peak occurs at 829.5 cm–1, which is quite close to the peak that was attributed to a uranyl–peroxo–chloro complex. This serves as an indication of the existence of a uranyl–peroxo–bromo complex. Judging from the relative peak heights within the Br– and Cl– systems containing H2O2, the uranyl–peroxo–bromo complex is weaker than the uranyl–peroxo–chloro complex. All peaks measured in Raman are summarized in Table S4.
Figure 5.

Raman spectra of aqueous solutions containing UO22+, H2O2, NaBr, or NaCl.
Figure 6.

Raman spectra of aqueous solutions containing UO22+, H2O2, NaBr, or NaCl (stacked plot).
IR Spectroscopy
As can be seen from Figure 7, the solution containing only 20 mM uranyl nitrate (black dots) has a peak at 962 cm–1, which is attributed to the uranyl–aquo complex. This is in good agreement with the literature.48,60 The spectra for 20 mM H2O2 in water, in 5 M NaCl, and in 5 M NaBr were collected. These spectra are not shown in Figure 7 because no clear peak can be found in the region of 800–1000 cm–1. In the solution containing 20 mM U(VI) and 20 mM H2O2 (blue dots), a studtite suspension is formed with a peak at 905 cm–1. The peak position is close to previously reported solid-phase studtite samples (906,61 909,59 and 915 cm–1 58). The solution containing 20 mM U(VI) and 5 M NaCl (orange dashes) shows one peak at 948 cm–1, indicating the uranyl–chloro complex close to the peak for UO2Cl+ at 956 cm–1 reported previously.62 Moreover, in the solution containing 20 mM U(VI) and 5 M NaBr (pink dashes), the solution shows one peak at 960 cm–1, which is separated from the uranyl–aquo complex peak (962 cm–1); therefore, we conclude that the peak at 960 cm–1 in the IR spectrum can be attributed to the uranyl–bromo complex. The solution containing 40 mM H2O2, 60 mM U(VI), and 5 M NaCl (blue line) shows two peaks at 948 and 925 cm–1 attributed to the uranyl–chloro complex and uranyl–peroxo–chloro complex, respectively. The solution containing 40 mM H2O2 and 60 mM U(VI) and 5 M NaBr (red line) also displays two peaks at 960 and 927 cm–1 representing the uranyl–bromo and uranyl–peroxo–bromo complexes. All peaks measured in IR are summarized in Table S5.
Figure 7.

IR spectra of aqueous solutions containing UO22+, H2O2, NaBr, or NaCl.
NMR Spectroscopy
35Cl NMR
The applications of different dynamic NMR methods are very well documented in the literature; hence, only a short summary relevant to the recent results is given here.63 In the so-called slow-exchange region, separate peaks for the exchanging sites can be observed in the spectra. If the rate is too slow to have an effect on the line shape, one- and two-dimensional magnetization transfer experiments could provide kinetic information on the exchanging system. When the exchange rate is fast enough to affect the line shapes, but still too slow on the chemical shift scale to result in a coalescence of peaks, the exchange rate can be calculated from the linewidths of the exchanging species. If the exchange rate is fast on the chemical shift scale (i.e., when the exchange rate is faster than the chemical shift difference of the exchanging sites in Hertz), only one peak can be observed for the exchanging species, as a result of coalescence of the peaks. In this case, the shape of the exchange averaged signal can be calculated by the individual chemical shifts and the relative populations of the exchanging species by a special matrix formalism. Then, the kinetic parameters can be determined by a comparison of the measured and the calculated spectra.
The complex formation in the ternary uranyl–peroxide–chloride system was followed first by running 35Cl NMR experiments. Only one solution containing 5 M NaCl was used, and its composition was changed for all other NMR experiments as detailed below. The spectra are shown in Figure 8. The 5 M NaCl sample was measured first, and a relatively sharp (14 Hz) 35Cl signal was observed in the spectrum (Figure 8a). The chemical shift of this signal was set to 0 ppm and used as an external reference for all other spectra. After adding 20 mM uranyl to the sample, still only one signal can be observed, but with a much broader linewidth (58 Hz) and increased chemical shift at 0.67 ppm (Figure 8b). These changes in the spectral parameters clearly indicate the formation of uranyl–chloro complexes and from dynamic NMR point of view can be explained by the formation of new exchange sites for chloride. The observation of only one broad signal indicates that the exchange between the coordinated and free chloride is fast on the NMR time scale. The addition of 20 mM H2O2 to the sample increased the shift of the signal to 1.38 ppm and the linewidth to 103 Hz (Figure 8c) due to the formation of additional exchanging site(s) for chloride by coordination of peroxide to the uranyl center in the uranyl–chloro complex(es). Since the individual chemical shifts and the relative populations of the exchanging complexes are not known, the spectra serve only qualitative kinetic information in the system. Independently of the number and stoichiometry of the complexes formed, it can be stated that the coordinated chloride is kinetically labile, and it is in fast exchange with the free chloride ion.
Figure 8.

35Cl NMR spectra measured in aqueous solutions of (a) 5 M NaCl, (b) 5 M NaCl + 20 mM UO22+, (c) 5 M NaCl + 20 mM UO22+ + 20 mM H2O2, and (d) 5 M NaCl + 20 mM UO22+ + 20 mM H2O2 + 200 mM NaHCO3.
In aqueous solutions, carbonate ion forms one of the thermodynamically most stable complexes with uranyl, and at higher carbonate concentrations, the formation of UO2(CO3)34– is dominating.12,61 We expected that carbonate would replace the weakly coordinated chlorides in the complexes formed; therefore, solid sodium bicarbonate was added to the test solution resulting in 200 mM total carbonate concentration (10 times excess relative to the uranyl concentration) and the 35Cl spectrum was measured again. As can be seen in Figure 8d, the signal is identical to the signal observed for free chloride in the 5 M NaCl sample (Figure 8a), indicating the presence of only free chloride ions in the solution. Hence, this observation proves unambiguously that the carbonate ion replaced the coordinated chlorides in the thermodynamically less stable uranyl–chloro and uranyl–peroxo–chloro complexes. This experiment is in accordance with our expectations and serves as indirect evidence for chloride coordination in the system.
17O NMR
Uranyl–Peroxide–Chloride System
The uranyl ion, UO22+, has two oxygen ligands, so-called “yl”-oxygens, that are chemically inert; however, by photochemical activation in 17O-enriched water, they can be replaced by 17O-isotopes. Hence, 17O NMR spectroscopy can also be used to follow the ligand exchange reactions.
First, the 17O NMR signal of a reference sample containing only uranyl–aquo complex, UO2(H2O)52+ was measured. The sample contained 20 mM 17O-enriched uranyl in 1 M HClO4 to avoid the formation of uranyl–hydroxo complexes, which can contribute to the loss of 17O enrichment. A relatively narrow signal (14 Hz) was observed at 1118 ppm, as shown in Figure 9a. Then, similarly to the setup for the 35Cl NMR experiments, the 17O NMR spectra were recorded in 5 M NaCl using the same test solution by adding uranyl first, followed by H2O2 addition next. The 17O signal from the sample containing 20 mM enriched uranyl in 5 M NaCl (Figure 9b) showed the same linewidth (15 Hz) but appeared at a higher chemical shift at 1119.8 ppm relative to the signal of the uranyl aquo-ion (Figure 9a). In accordance with the observations in the corresponding 35Cl NMR spectra, the formation of uranyl–chloro complex(es) could result in an increase in the shift. (The same increase of the chemical shift was observed in 5 M NaBr solution as discussed below.) The addition of 20 mM H2O2 resulted in the appearance of a new signal at 1120.9 ppm (with 23 Hz linewidth), besides the signal at 1119.8 ppm (Figure 9c). The appearance of this signal, in accordance with the 35Cl observations, is a clear evidence of the formation of the ternary uranyl–peroxo–chloro complex. The formation of binary uranyl–peroxo complexes (without chloride coordination) can be excluded since their 17O chemical shifts are in the range of 1070–1080 ppm (Figure 2 in ref (31)). The appearance of individual signals for the complex(es) formed by peroxide coordination, and for the other species indicates a slow exchange between them on the 17O NMR time scale. It can be concluded that the coordinated peroxide is kinetically inert and not involved in the ligand exchange reactions. One should note that a fast chloride exchange between the complexes and/or with the free chloride ion in this system does not affect the chemical shift of 17O NMR signals. Finally, to confirm the chloride coordination in the complexes formed, similarly to the 35Cl NMR experiment detailed above, solid sodium bicarbonate was added to the sample resulting in 200 mM total carbonate concentration, and the 17O NMR spectrum was measured again. A dramatic change was observed in the spectrum (Figure 9d), CO32– replaced the coordinated chlorides, and signals only for the thermodynamically most stable binary carbonate, UO2(CO3)34– (at 1100.8 ppm), and ternary uranyl–peroxo–carbonate complexes, (UO2)2O2(CO3)46– (at 1104.9 ppm) and UO2O2(CO3)24– (at 1097.9 ppm), can be observed as shown in Figure 9. These complexes have been identified earlier in a detailed 13C and 17O NMR study with slightly different chemical shifts due to the differences in the experimental conditions (Figures 3 and S5 in ref (31)).
Figure 9.

17O NMR spectra measured in aqueous solutions of (a) 20 mM UO22+ in 1 M HClO4, (b) 5 M NaCl + 20 mM UO22+, (c) 5 M NaCl + 20 mM UO22+ + 20 mM H2O2, and (d) 5 M NaCl + 20 mM UO22+ + 20 mM H2O2 + 200 mM NaHCO3.
Uranyl–Peroxide–Bromide System
The 17O NMR spectra were recorded analogously using one test solution in 5 M NaBr by adding uranyl first and then H2O2. The 17O uranyl signal appeared at 1119.3 ppm in 5 M NaBr, slightly lower than that observed for the corresponding sample in 5 M NaCl but still higher than the shift of the uranyl–aquo complex (Figure 10a,b) and can be explained by the formation of uranyl–bromo complex. After the addition of H2O2, the solution starts to be cloudy after ∼10 min indicating the formation of studtite and only one signal with the same shift can be observed (Figure 10c). This could be rationalized by the ternary uranyl–peroxo–bromo complex being considerably weaker than the corresponding chloro complex. The weak bromo complex is transformed into thermodynamically more stable studtite on a time scale shorter than that required for recording the NMR spectrum.
Figure 10.

17O NMR spectra measured in aqueous solutions of (a) 20 mM UO22+ in 1 M HClO4, (b) 5 M NaBr + 20 mM UO22+, and (c) 5 M NaBr + 20 mM UO22+ + 20 mM H2O2.
To the best of our knowledge, the spectroscopical results presented above constitute the first experimental observations of the formation of ternary uranyl–peroxo–chloro and uranyl–peroxo–bromo complexes.
Stoichiometry and Stability of the Ternary Complexes
Based on the Raman results, we propose the stoichiometry of the observed ternary complexes to be UO2(O2)(Cl)(H2O)2– and UO2(O2)(Br)(H2O)2–. The uranyl chloro and bromo complexes identified by Raman and IR spectra are UO2Cl+ and UO2Br+ according to the literature.10 After adding H2O2 to the solution, the 35Cl NMR indicates that the Cl is still in the complex and we therefore conclude that the ternary complex also contains one chloride. In addition, the Raman spectrum of studtite shows one peak at 821 cm–1. The ratio between UO22+ and O22– in studtite is 1:1, and given the fact that the Raman peaks of the uranyl–peroxo–halo complexes are found around 830 cm–1, which is close to that of studtite, we conclude that the ratio between UO22+ and O22– in the complexes is also 1:1. DFT calculations performed by Odoh and Schreckenbach33 to simulate the Raman peak of the symmetric stretch of UO22+ coordinated to different numbers of O22– show that the predicted symmetric stretch of UO22+ in UO2(O2)(H2O)4 and UO2(O2)2(H2O)2 should be at 789 and 704 cm–1, respectively. This indicates a significant redshift of UO22+ vibration frequency upon coordination to additional O22–. The relatively high wavenumbers of the UO22+ symmetric stretch of the uranyl–peroxo–halo complexes imply that the complex only contains one O22–. In addition, the unsaturated UO2(O2)(Cl)− or UO2(O2)(Br)− needs to bind two H2O molecules to achieve equatorial coordination numbers of 5.64 Based on Raman measurements, the estimated stability constants for (UO2)(O2)(Cl)(H2O)2– and (UO2)(O2)(Br)(H2O)2– are 0.17 and 0.04, respectively, at ionic strength ≈5 mol/L (based on eqs 1 and 2, X = Cl–/Br–).
| 1 |
| 2 |
The details of the estimations are given in the Supporting Information. Interestingly, speciation calculations based on the estimated stability constants (Figures S18 and S19) show that the ternary complexes dominate the speciation at lower UO22+ and H2O2 concentrations (0.2 mM). Moreover, speciation calculations performed as a function of pH show that the ternary complexes are the dominating species in 1 M Cl–/Br– solutions at pH higher than 3 (Figures S22 and S23).
The confirmation of the existence of the uranyl–peroxo–chloro and uranyl–peroxo–bromo complexes completes the picture of the recently performed study on H2O2-induced oxidative dissolution of UO2 in saline aqueous solutions.19 The ternary peroxo complexes act as unreactive sinks for H2O2 in the system while the fraction of free H2O2 displays reactivity toward the UO2 surface. The technique used for quantitative analysis of H2O2 is not specific for free H2O2 and instead, the total peroxide concentration is measured. This explains why, under certain conditions, the consumption of H2O2 appears to slow down considerably once the concentration of UO22+ has increased.
Conclusions
This work shows that ionic strength significantly influences the rate of studtite formation. At I ≈ 1 mol/L, the formation of studtite in solutions containing 0.2 mM UO22+ and 0.2 mM H2O2 can be completely suppressed for at least 24 h. Dissolution experiments also show that the rate of studtite dissolution increases with increasing ionic strength and that Cl– and Br– are more effective than ClO4–. In the presence of uranyl, H2O2 can be consumed in Br– solutions in two processes. One is catalytic decomposition, and the other is the formation of studtite. The catalytic decomposition was shown to involve a more reactive intermediate as evidenced by the oxidation of indigo carmine. The existence of ternary uranyl–peroxo–chloro and uranyl–peroxo–bromo complexes has been confirmed by Raman and IR spectroscopy. Raman spectra show that the symmetric stretch (ν1) of UO22+ in uranyl–peroxo–chloro and uranyl–peroxo–bromo complexes are at 831 and 829 cm–1, respectively. The estimated stability constants for (UO2)(O2)(Cl)(H2O)2– and (UO2)(O2)(Br)(H2O)2– are 0.17 and 0.04, respectively, at I ≈ 5 mol/L. Speciation calculations based on these stability constants show that the ternary complexes dominate the speciation at lower concentrations of UO22+ and H2O2 at pH ≥ 3. IR spectra show that the asymmetric stretch (ν3) of UO22+ in uranyl–peroxo–chloro and uranyl–peroxo–bromo complexes are at 925 and 927 cm–1, respectively. In addition, the 35Cl and 17O NMR spectra show that the coordinated chlorides are kinetically labile, and they are in fast exchange with the free chloride, while the exchange reactions between the coordinated and free peroxides are slow on the 17O NMR time scale that makes possible to observe separate signal for the uranyl–peroxo–chloro complex.
Acknowledgments
The Swedish Nuclear Fuel and Waste Management Company (SKB) and the China Scholarship Council (CSC) are gratefully acknowledged for financial support.
Supporting Information Available
The Supporting Information is available free of charge at https://pubs.acs.org/doi/10.1021/acs.inorgchem.2c00233.
Speciation calculations for uranyl chloride and uranyl bromide system; results from time-resolved studies of [UO22+] and [H2O2] in aqueous solutions; pH measurements for different samples; pH effect on H2O2 decomposition; summary of peaks measured in Raman and IR spectra; stability constants calculation; sample photographs at different times; XRD for precipitates formed in aqueous solutions; and speciation calculations based on the estimated stability constants for the characterized ternary complexes (PDF)
Author Contributions
J.L. and M.J. contributed to conceptualization. Data curation was done by J.L. and Z.S. Formal analysis was performed by J.L., Z.S., and M.J. Funding acquisition was done by M.J. J.L. and Z.S. carried out investigation. J.L., Z.S., and M.J. contributed to methodology. M.J. supervised the study. J.L. contributed to writing—original draft. J.L., Z.S., and M.J. contributed to writing—review and editing.
This work was supported by The Swedish Nuclear Fuel and Waste Management Company (SKB) [Grant Number 4501747777] and the China Scholarship Council (CSC) [Grant Number 201907930018].
The authors declare no competing financial interest.
Supplementary Material
References
- Kleykamp H. The Chemical State of the Fission Products in Oxide Fuels. J. Nucl. Mater. 1985, 131, 221–246. 10.1016/0022-3115(85)90460-X. [DOI] [Google Scholar]
- Min K. B.; Lee J.; Stephansson O. Implications of Thermally-Induced Fracture Slip and Permeability Change on the Long-Term Performance of a Deep Geological Repository. Int. J. Rock Mech. Min. Sci. 2013, 61, 275–288. 10.1016/j.ijrmms.2013.03.009. [DOI] [Google Scholar]
- Ewing R. C. Long-Term Storage of Spent Nuclear Fuel. Nat. Mater. 2015, 14, 252–257. 10.1038/nmat4226. [DOI] [PubMed] [Google Scholar]
- Spinks J.An Introduction to Radiation Chemistry, 3rd ed.; Wiley: New York, 1990. [Google Scholar]
- Ekeroth E.; Roth O.; Jonsson M. The Relative Impact of Radiolysis Products in Radiation Induced Oxidative Dissolution of UO2. J. Nucl. Mater. 2006, 355, 38–46. 10.1016/j.jnucmat.2006.04.001. [DOI] [Google Scholar]
- Shoesmith D. W. Fuel Corrosion Processes under Waste Disposal Conditions. J. Nucl. Mater. 2000, 282, 1–31. 10.1016/S0022-3115(00)00392-5. [DOI] [Google Scholar]
- Ekeroth E.; Jonsson M. Oxidation of UO2 by Radiolytic Oxidants. J. Nucl. Mater. 2003, 322, 242–248. 10.1016/j.jnucmat.2003.07.001. [DOI] [Google Scholar]
- Miró P.; Vlaisavljevich B.; Gil A.; Burns P. C.; Nyman M.; Bo C. Self-Assembly of Uranyl–Peroxide Nanocapsules in Basic Peroxidic Environments. Chem. – Eur. J. 2016, 22, 8571–8578. 10.1002/chem.201600390. [DOI] [PubMed] [Google Scholar]
- Burns P. C.; Nyman M. Captivation with Encapsulation: A Dozen Years of Exploring Uranyl Peroxide Capsules. Dalton Trans. 2018, 47, 5916–5927. 10.1039/c7dt04245k. [DOI] [PubMed] [Google Scholar]
- Nguyen-Trung C.; Begun G. M.; Palmer D. A. Aqueous Uranium Complexes. 2. Raman Spectroscopic Study of the Complex Formation of the Dioxouranium(VI) Ion with a Variety of Inorganic and Organic Ligands. Inorg. Chem. 1992, 31, 5280–5287. 10.1021/ic00051a021. [DOI] [Google Scholar]
- Vallet V.; Wahlgren U.; Grenthe I. Probing the Nature of Chemical Bonding in Uranyl(VI) Complexes with Quantum Chemical Methods. J. Phys. Chem. A 2012, 116, 12373–12380. 10.1021/jp3091123. [DOI] [PubMed] [Google Scholar]
- Li J.; Szabó Z.; Jonsson M. Meta-Studtite Stability in Aqueous Solutions. Impact of HCO3–, H2O2 and Ionizing Radiation on Dissolution and Speciation. Dalton Trans. 2021, 50, 6568–6577. 10.1039/D1DT00436K. [DOI] [PubMed] [Google Scholar]
- Weck P. F.; Kim E. Uncloaking the Thermodynamics of the Studtite to Metastudtite Shear-Induced Transformation. J. Phys. Chem. C 2016, 120, 16553–16560. 10.1021/acs.jpcc.6b05967. [DOI] [Google Scholar]
- Kubatko K. A. H.; Helean K. B.; Navrotsky A.; Burns P. C. Stability of Peroxide-Containing Uranyl Minerals. Science 2003, 302, 1191–1193. 10.1126/science.1090259. [DOI] [PubMed] [Google Scholar]
- Hanson B. D.; McNamara B.; Buck E.; Friese J.; Jenson E.; Krupka K.; Arey B. Corrosion of Commercial Spent Nuclear Fuel. 1. Formation of Studtite and Metastudtite. Radiochim. Acta 2005, 93, 159–168. 10.1524/ract.93.3.159.61613. [DOI] [Google Scholar]
- Burakov B. E.; Strykanova E. E.; Anderson E. B. Secondary Uranium Minerals on the Surface of Chernobyl ′lava’. Mater. Res. Soc. Symp. Proc. 1996, 465, 1309–1311. 10.1557/proc-465-1309. [DOI] [Google Scholar]
- Colmenero F.; Bonales L. J.; Cobos J.; Timón V. Study of the Thermal Stability of Studtite by in Situ Raman Spectroscopy and DFT Calculations. Spectrochim. Acta, Part A 2017, 174, 245–253. 10.1016/j.saa.2016.11.040. [DOI] [PubMed] [Google Scholar]
- Loida A.; Metz V.; Kienzler B.; Geckeis H. Radionuclide Release from High Burnup Spent Fuel during Corrosion in Salt Brine in the Presence of Hydrogen Overpressure. J. Nucl. Mater. 2005, 346, 24–31. 10.1016/j.jnucmat.2005.05.020. [DOI] [Google Scholar]
- El Jamal G.; Li J.; Jonsson M. H2O2-Induced Oxidative Dissolution of UO2 in Saline Solutions. Eur. J. Inorg. Chem. 2021, 2021, 4175–4182. 10.1002/EJIC.202100462. [DOI] [Google Scholar]
- Takao K.; Takao S.; Ikeda Y.; Bernhard G.; Hennig C. Uranyl–Halide Complexation in N, N-Dimethylformamide: Halide Coordination Trend Manifests Hardness of [UO2]2+. Dalton Trans. 2013, 42, 13101–13111. 10.1039/c3dt51191j. [DOI] [PubMed] [Google Scholar]
- Grenthe I.; Fuger J.; Konings R. J. M.; Lemire R. J.; Muller A. B.; Wanner H.; Forest I.. Chemical Thermodynamics of Uranium; OECD Publications: Paris, 2004.
- Soderholm L.; Skanthakumar S.; Wilson R. E. Structural Correspondence between Uranyl Chloride Complexes in Solution and Their Stability Constants. J. Phys. Chem. A 2011, 115, 4959–4967. 10.1021/jp111551t. [DOI] [PubMed] [Google Scholar]
- Burns P. C.; Ewing R. C.; Navrotsky A. Nuclear Fuel in a Reactor Accident. Science 2012, 335, 1184–1188. 10.1126/science.1211285. [DOI] [PubMed] [Google Scholar]
- Armstrong C. R.; Nyman M.; Shvareva T.; Sigmon G. E.; Burns P. C.; Navrotsky A. Uranyl Peroxide Enhanced Nuclear Fuel Corrosion in Seawater. Proc. Natl. Acad. Sci. U.S.A. 2012, 109, 1874–1877. 10.1073/pnas.1119758109. [DOI] [PMC free article] [PubMed] [Google Scholar]
- Nogrady B. Scientists OK Plan to Release One Million Tonnes of Waste Water from Fukushima. Nature 2021, 10.1038/D41586-021-01225-2. [DOI] [PubMed] [Google Scholar]
- Men W.; He J.; Wang F.; Wen Y.; Li Y.; Huang J.; Yu X. Radioactive Status of Seawater in the Northwest Pacific More than One Year after the Fukushima Nuclear Accident. Sci. Rep. 2015, 5, 7757 10.1038/srep07757. [DOI] [PMC free article] [PubMed] [Google Scholar]
- Von Berlepsch T.; Haverkamp B. Salt as a Host Rock for the Geological Repository for Nuclear Waste. Elements 2016, 12, 257–262. 10.2113/gselements.12.4.257. [DOI] [Google Scholar]
- Summary Sub-Areas Interim Report According to Section 13 StandAG, 830270; Bundesgesellschaft für Endlagerung mbH: Peine, 2020.
- Lempert J. P.; Biurrun E.. Deep Geological Radioactive Waste Disposal in Germany, IAEA-SM-357/16, 1999; pp 29–32.
- Hata K.; Inoue H.; Kojima T.; Iwase A.; Kasahara S.; Hanawa S.; Ueno F.; Tsukada T. Hydrogen Peroxide Production by Gamma Radiolysis of Sodium Chloride Solutions Containing a Small Amount of Bromide Ion. Nucl. Technol. 2016, 193, 434–443. 10.13182/NT15-32. [DOI] [Google Scholar]
- Zanonato P. L.; Di Bernardo P.; Szabó Z.; Grenthe I. Chemical Equilibria in the Uranyl(VI)-Peroxide-Carbonate System; Identification of Precursors for the Formation of Poly-Peroxometallates. Dalton Trans. 2012, 41, 11635–11641. 10.1039/c2dt31282d. [DOI] [PubMed] [Google Scholar]
- Zanonato P. L.; Di Bernardo P.; Grenthe I. Chemical Equilibria in the Binary and Ternary Uranyl(VI)-Hydroxide-Peroxide Systems. Dalton Trans. 2012, 41, 3380–3386. 10.1039/c1dt11276g. [DOI] [PubMed] [Google Scholar]
- Odoh S. O.; Schreckenbach G. DFT Study of Uranyl Peroxo Complexes with H2O, F–, OH–, CO32–, and NO3–. Inorg. Chem. 2013, 52, 5590–5602. 10.1021/ic400652b. [DOI] [PubMed] [Google Scholar]
- Patrick W. A.; Wagner H. B. Determination of Hydrogen Peroxide in Small Concentrations. Anal. Chem. 1949, 21, 1279–1280. 10.1021/ac60034a038. [DOI] [Google Scholar]
- Ghormley J. A.; Stewart A. C. Effects of γ-Radiation on Ice. J. Am. Chem. Soc. 1956, 78, 2934–2939. 10.1021/ja01594a004. [DOI] [Google Scholar]
- Savvin S. B. Analytical Use of Arsenazo III. Talanta 1961, 8, 673–685. 10.1016/0039-9140(61)80164-1. [DOI] [Google Scholar]
- Tyrode E.; Hedberg J. A Comparative Study of the CD and CH Stretching Spectral Regions of Typical Surfactants Systems Using VSFS: Orientation Analysis of the Terminal CH3 and CD3 Groups. J. Phys. Chem. C 2012, 116, 1080–1091. 10.1021/jp210013g. [DOI] [Google Scholar]
- Li J.; Maier A. C.; Jonsson M. Stability of Studtite in Aqueous Suspension: Impact of HCO3– and Ionizing Radiation on the Dynamics of Dissolution. ACS Appl. Energy Mater. 2020, 3, 352–357. 10.1021/acsaem.9b01611. [DOI] [Google Scholar]
- Thompson N. B A.; Frankland V. L.; Bright J. W. G.; Read D.; Gilbert M. R.; Stennett M. C.; Hyatt N. C. The Thermal Decomposition of Studtite: Analysis of the Amorphous Phase. J. Radioanal. Nucl. Chem. 2021, 327, 1335–1347. 10.1007/s10967-021-07611-4. [DOI] [Google Scholar]
- Lobeck H. L.; Isner J. K.; Burns P. C. Transformation of Uranyl Peroxide Studtite, [(UO2)(O2)(H2O)2](H2O)2, to Soluble Nanoscale Cage Clusters. Inorg. Chem. 2019, 58, 6781–6789. 10.1021/acs.inorgchem.9b00230. [DOI] [PubMed] [Google Scholar]
- Liao H.; Stenman D.; Jonsson M. Study of Indigo Carmine as Radical Probe in Photocatalysis. J. Photochem. Photobiol. A 2009, 202, 86–91. 10.1016/j.jphotochem.2008.11.008. [DOI] [Google Scholar]
- Kettle A. J.; Clark B. M.; Winterbourn C. C. Superoxide Converts Indigo Carmine to Isatin Sulfonic Acid: Implications For The Hypothesis That Neutrophils Produce Ozone. J. Biol. Chem. 2004, 279, 18521–18525. 10.1074/JBC.M400334200. [DOI] [PubMed] [Google Scholar]
- Bray W. C.; Livingston R. S. The Catalytic Decomposition of Hydrogen Peroxide in A Bromine-Bromide Solution, and A Study of the Steady State. J. Am. Chem. Soc. 1923, 45, 1251–1271. 10.1021/ja01658a021. [DOI] [Google Scholar]
- Groenewold G. S.; van Stipdonk M. J.; Oomens J.; de Jong W. A.; Gresham G. L.; McIlwain M. E. Vibrational Spectra of Discrete UO22+ Halide Complexes in the Gas Phase. Int. J. Mass Spectrom. 2010, 297, 67–75. 10.1016/j.ijms.2010.06.013. [DOI] [Google Scholar]
- Gibson J. K.; Hu H.-S.; Stipdonk M. J.; Van Berden G.; Oomens J.; Li J. Infrared Multiphoton Dissociation Spectroscopy of a Gas-Phase Complex of Uranyl and 3-Oxa-Glutaramide: An Extreme Red-Shift of the [UO2]2+ Asymmetric Stretch. J. Phys. Chem. A 2015, 119, 3366–3374. 10.1021/jp512599e. [DOI] [PubMed] [Google Scholar]
- Tatosian I.; Metzler L.; Graca C.; Bubas A.; Corcovilos T.; Martens J.; Berden G.; Oomens J.; Van Stipdonk M. J. Measurement of the Asymmetric UO22+ Stretching Frequency for [UVIO2(F)3]- Using IRMPD Spectroscopy. Int. J. Mass Spectrom. 2019, 446, 116231 10.1016/j.ijms.2019.116231. [DOI] [Google Scholar]
- Groenewold G. S.; Gianotto A. K.; Cossel K. C.; Van Stipdonk M. J.; Moore D. T.; Polfer N.; Oomens J.; De Jong W. A.; Visscher L. Vibrational Spectroscopy of Mass-Selected [UO2(Ligand)n]2+ Complexes in the Gas Phase: Comparison with Theory. J. Am. Chem. Soc. 2006, 128, 4802–4813. 10.1021/ja058106n. [DOI] [PubMed] [Google Scholar]
- Lu G.; Haes A. J.; Forbes T. Z. Detection and Identification of Solids, Surfaces, and Solutions of Uranium Using Vibrational Spectroscopy. Coord. Chem. Rev. 2018, 374, 314–344. 10.1016/j.ccr.2018.07.010. [DOI] [PMC free article] [PubMed] [Google Scholar]
- Forbes T.; Kravchuk D. V.; Dahlen N. N.; Kruse S. J.; Malliakas C. D.; Shand P. M. Isolation and Reactivity of Uranyl Superoxide. Angew. Chem., Int. Ed. 2021, 60, 15041–15048. 10.1002/anie.202103039. [DOI] [PubMed] [Google Scholar]
- Groenewold G. S.; Gianotto A. K.; McIlwain M. E.; Van Stipdonk M. J.; Kullman M.; Moore D. T.; Polfer N.; Oomens J.; Infante I.; Visscher L.; Siboulet B.; De Jong W. A. Infrared Spectroscopy of Discrete Uranyl Anion Complexes. J. Phys. Chem. A 2008, 112, 508–521. 10.1021/jp077309q. [DOI] [PubMed] [Google Scholar]
- Burns P. C.; Hughes K. A. Studtite, [(UO2)(O2)(H2O)2](H2O)2: The First Structure of a Peroxide Mineral. Am. Mineral. 2003, 88, 1165–1168. 10.2138/AM-2003-0725. [DOI] [Google Scholar]
- Xu M.; Devlin J. P.; Buch V.; Rempe S. B.; Mattsson T. R.; Leung K.; Vendrell O.; Meyer H.-D.; Bresme F.; Chacón E.; Tarazona P.; Cencek W.; Szalewicz K.; Leforestier C.; Van Harrevelt R.; Van Der Avoird A.; Chem P.; Schröck K.; Schröder F.; Heyden M.; Fischer R. A. Aqueous Divalent Metal–Nitrate Interactions: Hydration versus Ion Pairing. Phys. Chem. Chem. Phys. 2008, 10, 4793–4801. 10.1039/B807090N. [DOI] [PubMed] [Google Scholar]
- Zhang Y. H.; Choi M. Y.; Chan C. K. Relating Hygroscopic Properties of Magnesium Nitrate to the Formation of Contact Ion Pairs. J. Phys. Chem. A 2004, 108, 1712–1718. 10.1021/JP036524D. [DOI] [Google Scholar]
- Lu G.; Forbes T. Z.; Haes A. J. Evaluating Best Practices in Raman Spectral Analysis for Uranium Speciation and Relative Abundance in Aqueous Solutions. Anal. Chem. 2016, 88, 773–780. 10.1021/acs.analchem.5b03038. [DOI] [PubMed] [Google Scholar]
- Brooker M. H.; Huang C. B.; Sylwestrowicz J. Raman Spectroscopic Studies of Aqueous Uranyl Nitrate and Perchlorate Systems. J. Inorg. Nucl. Chem. 1980, 42, 1431–1440. 10.1016/0022-1902(80)80109-6. [DOI] [Google Scholar]
- Moreno T.; Morán López M. A.; Huerta Illera I.; Piqueras C. M.; Sanz Arranz A.; García Serna J.; Cocero M. J. Quantitative Raman Determination of Hydrogen Peroxide Using the Solvent as Internal Standard: Online Application in the Direct Synthesis of Hydrogen Peroxide. Chem. Eng. J. 2011, 166, 1061–1065. 10.1016/J.CEJ.2010.11.068. [DOI] [Google Scholar]
- Ramírez-Cedeño M. L.; Gaensbauer N.; Félix-Rivera H.; Ortiz-Rivera W.; Pacheco-Londoño L.; Hernández-Rivera S. P. Fiber Optic Coupled Raman Based Detection of Hazardous Liquids Concealed in Commercial Products. Int. J. Spectrosc. 2012, 2012, 463731 10.1155/2012/463731. [DOI] [Google Scholar]
- Fairley M.; Myers N. M.; Szymanowski J. E. S.; Sigmon G. E.; Burns P. C.; Laverne J. A. Stability of Solid Uranyl Peroxides under Irradiation. Inorg. Chem. 2019, 58, 14112–14119. 10.1021/acs.inorgchem.9b02132. [DOI] [PubMed] [Google Scholar]
- Bastians S.; Crump G.; Griffith W. P.; Withnall R. Raspite and Studtite: Raman Spectra of Two Unique Minerals. J. Raman Spectrosc. 2004, 35, 726–731. 10.1002/jrs.1176. [DOI] [Google Scholar]
- Quilès F.; Burneau A. Infrared and Raman Spectroscopic Study of Uranyl Complexes: Hydroxide and Acetate Derivatives in Aqueous Solution. Vib. Spectrosc. 1998, 18, 61–75. 10.1016/S0924-2031(98)00040-X. [DOI] [Google Scholar]
- Buck E. C.; Douglas M.; Mcnamara B. K.; Hanson B. D.. Possible Incorporation of Neptunium in Uranyl(VI) Alteration Phases, PNNL-14277; Pacific Northwest National Laboratory: Richland, Washington, 2003.
- Gál M.; Goggin P. L.; Mink J. Mid-, Far-Infrared and Raman Spectra of Uranyl Complexes in Aqueous Solutions. J. Mol. Struct. 1984, 114, 459–462. 10.1016/0022-2860(84)87186-0. [DOI] [Google Scholar]
- Szabó Z. Multinuclear NMR Studies of the Interaction of Metal Ions with Adenine-Nucleotides. Coord. Chem. Rev. 2008, 252, 2362–2380. 10.1016/j.ccr.2008.03.002. [DOI] [Google Scholar]
- Chaumont A.; Wipff G. Solvation of Uranyl(II) and Europium(III) Cations and Their Chloro Complexes in a Room-Temperature Ionic Liquid. A Theoretical Study of the Effect of Solvent “Humidity. Inorg. Chem. 2004, 43, 5891–5901. 10.1021/ic049386v. [DOI] [PubMed] [Google Scholar]
Associated Data
This section collects any data citations, data availability statements, or supplementary materials included in this article.