Abstract
Optimization of contrast-enhanced imaging and focused ultrasound therapy requires a comprehensive understanding of in vivo microbubble pharmacokinetics. Prior studies have focused pharmacokinetic analysis on indirect techniques, such as ultrasound imaging of the blood pool and gas chromatography of exhaled gases. The goal of this work was to measure the microbubble concentration directly in blood and correlate the pharmacokinetic parameters to the microbubble size and dose. Microbubble volume dose (MVD) was chosen to combine the size distribution and number into a single dose parameter. Different microbubbles sizes (2, 3, and 5 μm diameter) at 5-40 μL/kg MVD were intravenously injected. Blood samples were withdrawn at different times (1-10 min) and analyzed by image processing. We found that an MVD threshold < 40 μL/kg for 2 and 3 μm, and <10 μL/kg for 5 μm, microbubble clearance followed first-order kinetics. When matching MVD, microbubbles of different sizes had comparable half-lives indicating that gas dissolution and elimination by the lungs are the primary mechanisms for elimination. Above the MVD threshold, microbubble clearance followed bi-exponential kinetics, suggesting a second elimination mechanism mediated by organ retention, possibly in the lung, liver and spleen. In conclusion, we present the first direct microbubble pharmacokinetic study, demonstrate the utility of MVD as a unified dose metric, and provide insights into the mechanisms of microbubble clearance from circulation.
Keywords: Direct blood measurements, Microbubble pharmacokinetics, Microbubble volume dose, First-order kinetics, second-order kinetics
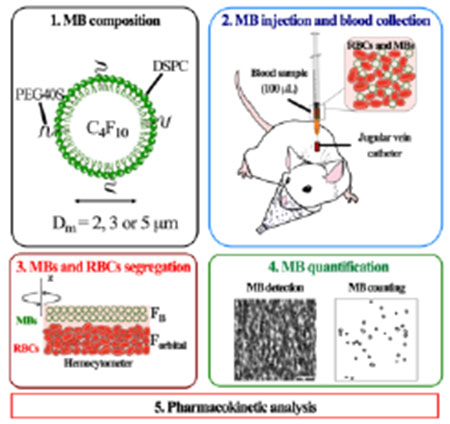
Graphical Abstract
1. Introduction
Microbubbles (0.1–10 μm diameter encapsulated gas spheres) are clinically approved ultrasound contrast agents for echocardiography, radiology and other imaging indications.1,2 Microbubbles (MBs) comprise a high-molecular-weight, low-solubility gas core stabilized by a phospholipid or protein shell that resists dissolution and coalescence.3 MBs are highly echogenic and versatile in their acoustic response and ability to be modified with targeting ligands, drug carriers and multimodal imaging dyes.4 Therefore, MBs have emerged as promising agents for several applications, including molecular imaging,5,6 super-resolution imaging 7 and therapeutic drug delivery through the blood-brain barrier (BBB) 8 and to solid tumors 9.
The potential of MBs as a drug delivery vehicle is rooted in their volumetric oscillations (cavitation) under ultrasound, which produces localized shear, contact and acoustic forces that result in membrane permeabilization and drug extravasation.10–12 The extent of cavitation can induce reversible or irreversible vascular biological effects, such as endothelial sonoporation, vascular rupture, hemorrhage, inflammation, vascular occlusion and thrombosis.13,14 However, understanding and predicting the bioeffects of MB cavitation remains challenging due to the diversity and variability of laboratory and commercial grade ultrasound contrast agents.15
Specifically, commercial MBs differ in gas, shell and diluent composition, concentration, size distribution and recommended dose, and size and concentration may even vary vial-to-vial even for a given product 16. These variations may result in different acoustic responses 17 and inconsistent permeability effects 18–20. We recently demonstrated that it is possible to collapse the MB size distribution and concentration into a single parameter, MB gas volume dose (MVD), to obtain consistent and comparable BBB disruption with non-overlapping size distributions 21. This result follows prior evidence that microbubble circulation half-life may scale with MVD, independently of size 22. Moreover, recent evidence has indicated that matching volume fractions for different commercial MBs could result in comparable permeabilization effects 23. Thus, MVD could represent a unified MB dose metric for retroactive analysis of prior studies and standardization of future studies. Since the MB is the key element in the acoustic interaction, it follows that all bioeffects are contingent on MB bioavailability, i.e., dose and pharmacokinetics. Thus, an accurate understanding of MB pharmacokinetics plays a key role in establishing safe and consistent treatment schemes and directs efforts to develop future MB formulations in both therapeutic and diagnostic applications.
Prior in vivo MB pharmacokinetic studies have relied on indirect methods, such as ultrasound contrast images 22,24–27, gas chromatography 23,28 and histology 29. These indirect techniques have limitations. For example, sonographic MB detection is limited to the sensitivity of the MB to the imaging pulse (e.g., acoustic destruction 24), the sensitivity of the imaging system to the echo signal, spatial resolution, the inability to distinguish the size or number of MBs within a voxel, and other factors. Prior research has shown that lower MB concentration may result in decreased contrast variations and rapid intensity decay 25,26, whereas high MB concentrations attenuate the ultrasound signal, making it difficult to determine the pharmacokinetics at potentially physiologically-relevant doses necessary for drug delivery 22,25,27. Moreover, gas chromatographic measurements may be difficult to interpret because MBs may continue to circulate and induce bioeffects after they have exchanged their original gas core with dissolved gases from the blood, such as N2, O2, and CO2 30,31. Finally, histologic methodologies are difficult to perform, are subject to artifacts in tissue preparation, and are limited to analyzing MBs at specific organs with sufficient MB uptake at a single end-point 29.
Therefore, the goal of this study was to provide direct measurements of MB concentration in the blood at multiple time points following intravenous injection. We also sought to use these measurements to model the pharmacokinetic behavior and to determine the effects of MB size and MVD on those pharmacokinetic parameters. The results presented here include comparisons of pharmacokinetic rate parameters, half-life, distribution volume, clearance rate and area-under-the-curve. With these results, we demonstrate the utility of MVD as a unified dose metric and shed light on the clearance mechanisms.
2. Materials and methods
2.1. Materials
All solutions were made using filtered, sterile, deionized water (Direct-Q 3 Millipore, Billerica, MA). All glassware was sanitized and cleaned with 70 vol% isopropyl alcohol (Supelco, Burlington, MA). 1,2-Distearoyl-sn-glycero-3-phosphocholine (DSPC) was purchased from Avanti Polar Lipids (Alabaster, AL). Perfluorobutane gas (C4F10, PFB) was purchased from FluroMed (Round Rock, TX). Polyoxyethylene-40 stearate (PEG40S), chloroform, and sterile filtered citrate dextrose solution (ACD) were purchased from Sigma-Aldrich (St. Louis, MO). Vybrant DiO was purchased from Invitrogen (Eugene, OR). Sterile saline solution and phosphate- buffered saline solution (PBS) were purchased from Fisher Scientific (Pittsburg, PA). Heparin sodium 1000 UI (Pfizer/Hospira Inc). The purity of all the reagents was ≥ 99%, and they were used as received without further purification.
2.2. Synthesis, size-isolation, and characterization of microbubbles
Lipid-coated MBs with a PFB gas core were prepared by sonication, as described previously 32. Briefly, under sterile conditions, a dried lipid film comprising DSPC:PEG40S (90:10) was hydrated with filtered and sterile PBS (1X) to a final lipid/emulsifier concentration of 2 mg/mL at 65 °C for 40 min. The lipid solution was sonicated with a 20-kHz probe (Model 250A, Branson Ultrasonics; Danbury, CT) at low power (3/10; 3 W) for 12 min. For fluorescent studies, 1 μL/mL of DiO solution (1 mM) was added to the lipid solution prior to sonication. After cooling to room temperature, PFB was delivered to the surface of lipid suspension for 10 s. Then the solution was sonicated at high power (10/10; 33 W) for 15 s to produce polydisperse MBs. Polydisperse MBs were then collected into 30-mL sterile syringes and isolated by differential centrifugation 33 into three sizes: 2, 3, and 5 μm diameter. MB concentration and number- and volume-weighted size distributions were measured using a Multisizer 3 Coulter Counter (Beckman Coulter). MB concentration (c, MBs/mL) vs MB volume (mL) was plotted, and MB gas volume fraction (φMB) were estimated as follows 15:
| (1) |
Three independent size-isolated MB preparations were evaluated after synthesis and one hour prior to injection to confirm the size distributions and concentration. Finally, after isolation, MB cakes were stored in the refrigerator at 4 °C for subsequent use.
2.3. Microbubble injection and blood withdrawal
All animal studies were conducted under approval by the University of Colorado Boulder IACUC. The studies were conducted using pre-catheterized jugular vein adult male/female Sprague-Dawley rats (Charles River, Wilmington, MA) weighing 280-470 g in accordance with National Institutes of Health Animal Care Guidelines. Rats were deeply anesthetized with isoflurane-medical air mixture (2-3%, SomnoSuite®, Kent Scientific, Torrington, CT) and placed on a heated pad to maintain the body temperature. The catheter was flushed with 100 μL of heparinized saline solution (500 UI) to avoid blood coagulation. Fluid volume dose (FVD) from each MB suspension was calculated to reach 5, 10, 20, or 40 μL/kg MVD of each MB sample 15:
| (2) |
To avoid alterations of MB size and concentration MBs were injected at 2 mL/min using a blunt 23 G needle 34,35 (SAI Infusion Technologies, Lake Villa, IL) at the pre-catheterized jugular site (Fig. 1A). After each MVD administered, 100 μL of heparinized saline solution was flushed to push all the MBs into circulation and avoid catheter retention. For each MVD, 100-μL blood samples were collected from the catheters every minute from 1 to 5 min, and a final draw at 10 min (Fig. 1B). Between collections, heparin solution was flushed again to withdraw fresh blood every time. Immediately after each time collection, blood was diluted in ACD solution at a 5:1 volumetric ratio to avoid the coagulation process, and then they were stored at 4 °C for MB measurement. Three different rats were used per MVD to test the three different MB sizes. At the end of each experiment, rats were euthanized by CO2 displacement (10%/min).
Figure 1.
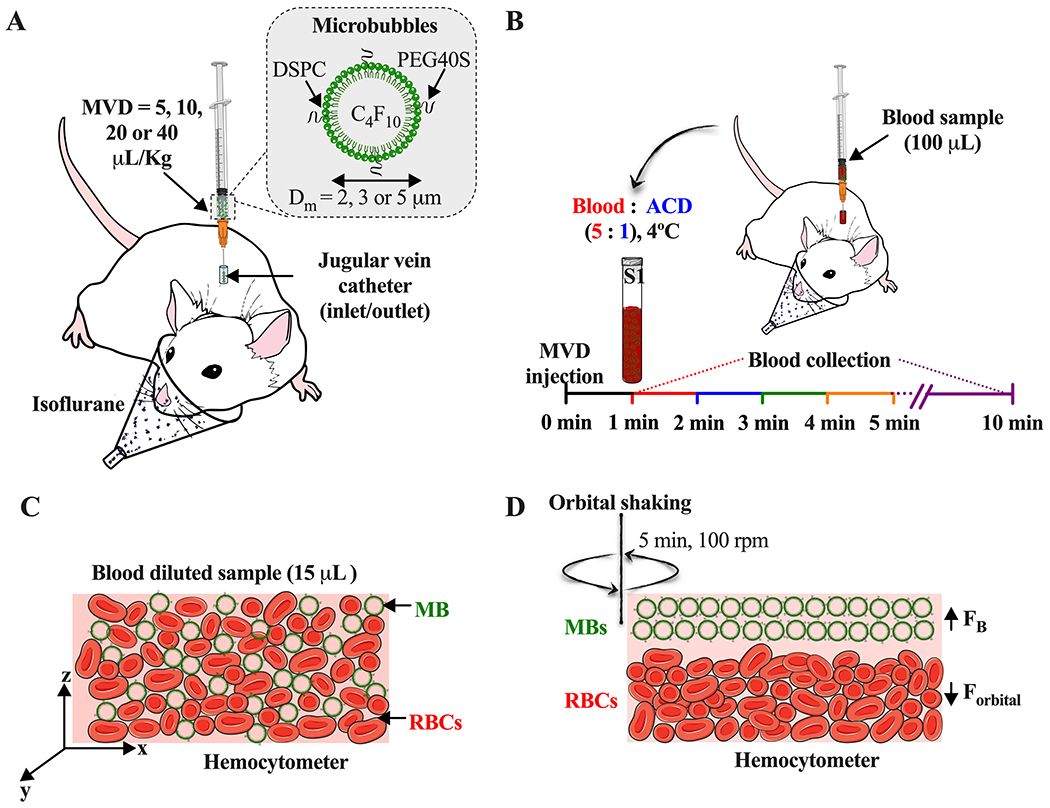
Experimental setup. A) Intravenous injection of size-selected microbubbles (MBs) at different microbubble volume doses (MVD) via jugular vein. B) Timepoint of blood sample collection after MBs injection. C) Homogeneous distribution of red blood cells (RBCs) and MBs in the hemocytometer. D) Isolation of MBs [hemocytometer top plane, buoyancy force (FB)] from the RBCs [hemocytometer bottom plane, orbital force (Forbital)] by orbital shaking.
2.4. Microbubble detection in the blood samples
Blood samples with MBs were collected at each timepoint and diluted with sterile-filtered deionized water, 50:50 for 5, 10, and 20 μL/kg MVD, or 25:75 for 40 μL/kg MVD. Then, 15 μL of each diluted sample was deposited in both hemocytometer chambers (Hausser Scientific Phase Counter Chamber, Horsham, PA) (Fig. 1C), allowing the samples to reach the chamber edge between the coverslip and the V-shaped groove in the chamber. To separate MBs from the red blood cells (RBCs), the hemocytometer was shaken at 100 rpm for 5 min (Fig. 1D) using an orbital shaker (LAB-LINE 3520). Then, for the first 4 min, 16 microscope images per chamber from the hemocytometer top (4 images per quadrant) was taken using a QI click 74-0083-A0 camera (exposure time = 40-60 ms, gain = 0.7) and 20× objective (Olympus BX52, Tokyo, Japan). For the 5- and 10-min samples, manual counting was done by DiO fluorescence detection (484/501 nm). All the obtained images were analyzed using ImageJ software (National Institutes of Health, Bethesda, MD). Prior to image analysis, images were cropped to the same size as the squares contained in the hemocytometer quadrants (795×795 pixels). To isolate MBs from the RBCs, different preprocessing filters were applied. First, to enhance the microbubbles edges, a normalization of a Kernel convolution filter with a center value between 30-35 was applied. Then, to subtract the background corresponding to RBCs, a convolution filter with a center value between 40-70 was applied. The images were then binarized, and the MBs were counted by using the Analyze Particles script. Finally, based on the hemocytometer-ruled surface, the concentration of MBs/mL of blood was calculated as:
| (3) |
To quantify MB pharmacokinetics independent of MB size, concentration, fluid volume dose and body weight, MVD variations were plotted as a function of time. MVD at each time was calculated as follows:
| (4) |
where MVD is the microbubble volume dose in μL/kg; #MBsBW is the total number of microbubbles per mass of bodyweight #MBsBW = (MBs/mL) hemocytometer × TVBBW; TVBBW is the total volume of blood in mL (TVBBW= 64 mL/kg × BW), and VMB is the volume-weighted-mean volume (μm3) for the corresponding size-isolated MB formulation.
2.5. Pharmacokinetic analysis
Two pharmacokinetic models (Fig. 2) were used to compare the data. Both models were computed in OriginPro 2021 software and fitted to each MVD-size profile. Depending on the shape of the MVD decay, fittings with an R2 ≥ 0.97 were selected as preferred model curves.
Figure 2.
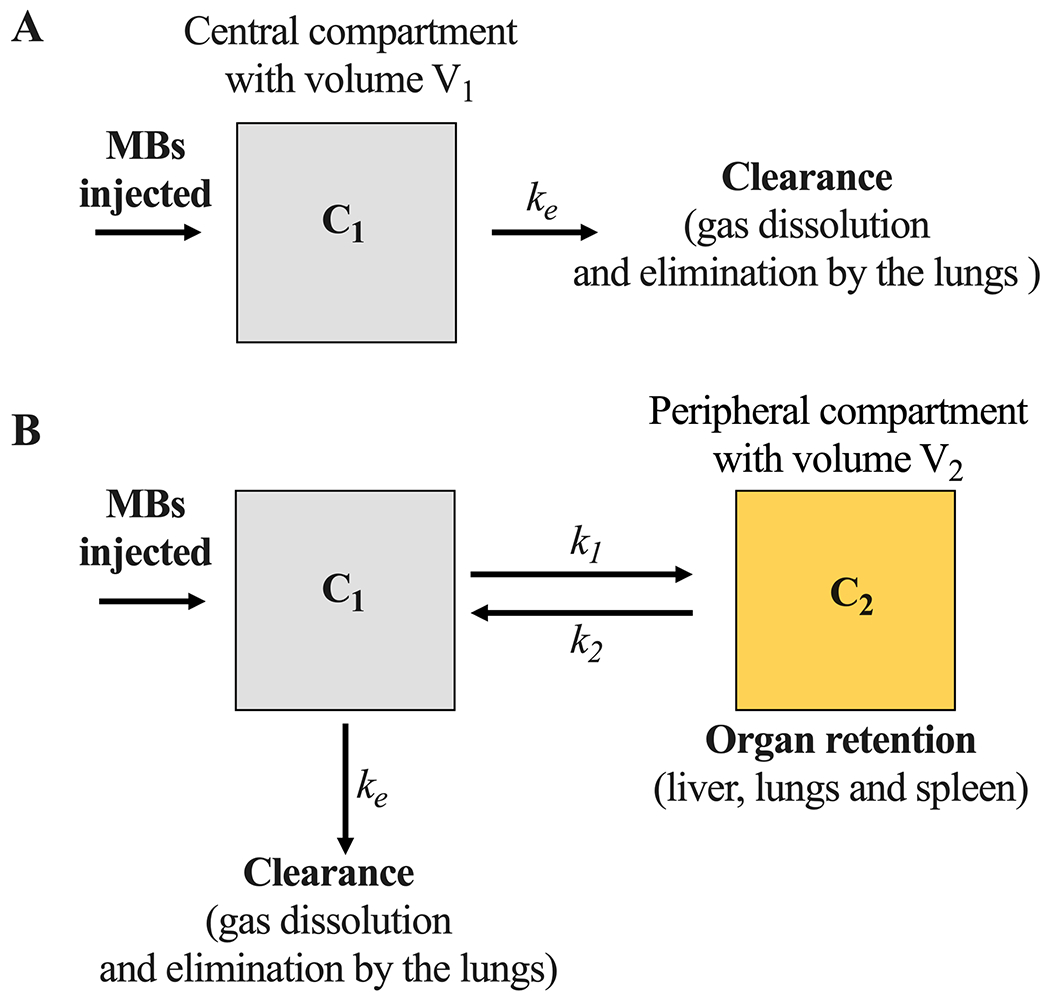
Microbubble pharmacokinetic models. A) One- and B) two-compartment models. C1 represents the freely circulating MBs (central compartment), while C2 represents the MBs retained in the peripheral compartment, ke is the clearance rate constant, k1 and k2 are the mass transfer constants.
At low MVDs (5, 10 and 20 μL/kg), circulation dynamics were determined by fitting the one-compartment pharmacokinetic model (Fig. 2A) to the MVD decay curve 36:
| (5) |
where C1 is the MVD of freely circulating MBs (central compartment), is the first MVD detected in blood at 1 min after injection, and ke is the first-order clearance rate constant. From this fit, pharmacokinetic parameter including distribution volume (V1= TVBBW), clearance rate (ClB= V1ke), half-life (t1/2= ln(2)/ke) and area-under-the-curve (AUC1= C0/ke) were calculated.
At large MVDs (20 and 40 μL/kg), circulation dynamics were determined by fitting the two-compartment pharmacokinetic model (Fig. 2B) to the MVD decay curve 36:
| (6) |
corresponding to a bi-exponential decay. Here, C1 is the MVD of freely circulating MBs in the central compartment, C0 is the first MVD detected in blood after 1 min of injection, α, λ1, and λ2 are hybrid constants to describe the distribution and the elimination phases. These constants are used to estimate the clearance rate constant (), mass transfer constants [, k2 = (1 − α)λ1 + αλ2], half-lives (t1/2(1) = ln(2)/ λ2 and t1/2(2) = ln(2)/ λ1), area-under-the-curve [], and clearance rate (ClB = V1ke). Where , V2 is the distribution volume of the peripheral compartment, and V1 is the distribution volume of the central compartment. This ratio was calculated taking in account the mass of blood and rat organs at body weight 37,38.
2.6. Statistical analysis
All data are expressed as the mean ± standard deviation. Differences between experimental groups were assessed using multiple unpaired t-tests. Data were plotted and evaluated using GraphPad software (San Diego, CA). A p-value ≤ 0.05 was considered to indicate statistical significance.
3. Results
3.1. Characterization of size-selected microbubbles
Size-isolation of 2, 3 and 5 μm diameter MBs by centrifugation resulted in a homogeneous spherical particle population, as shown in the microscope images (Fig. 3A–C). Multisizer MB sizing confirmed narrow number- and volume-weighted distributions with a single peak and little overlap between sizes (Fig. 3D–E). The three size-isolated MBs had mean volume diameters of 2.0, 3.4 and 5.0 μm. Therefore, MBs are referred to as 2, 3 and 5 μm. The microbubble gas volume fraction (φMB) for each size calculated from equation (1) were 7.8, 14.6 and 25.6 μL/mL, which represents the area-under-the-curve obtained from the MB concentration vs. volume profiles (Fig. 3F). Table 1 summarizes averaged number- and volume-weighted size and concentration parameters for each MB formulation.
Figure 3.
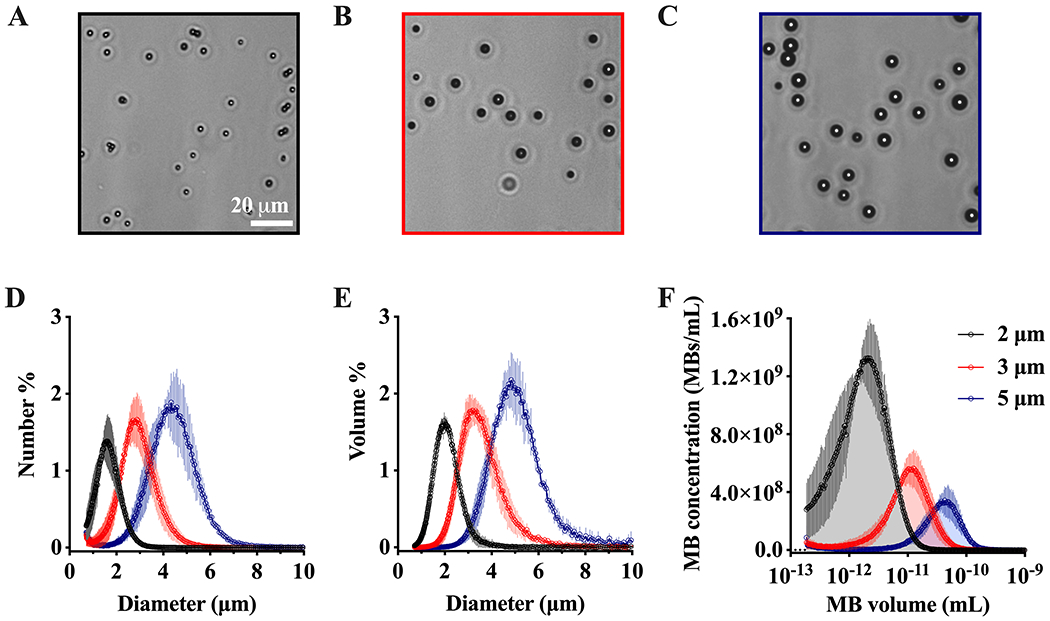
Size-selected microbubble characterization. A-C) Representative brightfield microscope images of 2, 3 and 5 μm diameter microbubbles (MBs). D-E) Number- and volume-weighted MB size distributions. F) MB concentration vs. MB volume, the area under the curve represents the MB gas volume fraction (φMB). Data represents the mean ± standard deviation for three different experiments.
Table 1.
Parameter values obtained from the number- and volume-weighted distributions for 2, 3, and 5 μm diameter microbubbles. φMB represents the MB gas volume fraction. Data represents the mean ± standard deviation for three different experiments.
| MB diameter (μm) | Number % (μm) | Volume % (μm) | φMB (μL/mL) | Concentration (1010 MBs/mL) |
|---|---|---|---|---|
| 2 | 1.6 ± 0.1 | 2.0 ± 0.1 | 7.8 ± 1.4 | 9.7 ± 0.5 |
| 3 | 2.7 ± 0.3 | 3.4 ± 0.2 | 14.6 ± 4.3 | 3.4 ± 0.2 |
| 5 | 4.2 ± 0.2 | 5.0 ± 0.2 | 25.6 ± 5.4 | 1.8 ± 0.1 |
3.2. Detection of microbubbles in the blood samples
After jugular vein injection, blood samples were withdrawn every minute from 1 to 5 min, and again at 10 min. Dilution of blood in deionized water helped to disrupt some RBCs due to the hypotonic environment, resulting in less dark background. However, differentiation of MBs from RBCs was difficult (Fig. 4A). Isolation of MBs from the RBCs was achieved by orbital shaking of the blood samples, resulting in the localization of RBCs on the bottom plane and MBs on the top plane (Fig. 4B–C). Fluorescent images corroborated that all the MBs present in the samples were efficiently segregated from the RBCs (Fig. S1). Application of a normalization of the convolution kernel filter resulted in a successful smoothing and brightness edge enhancement of the MBs (Fig. 4D). Subsequently, a convolution filter was used to isolate the MBs, and the RBCs background was subtracted (Fig. 4E). Finally, to count the total amount of MBs, the Analyze Particles plugin was used (Fig. 4F), and the concentration of MBs/mL was calculated using the hemocytometer volume and the dilution factor (equation (3)). This methodology provided an accurate and precise measurement of MB concentration and MVD at each time point. Tests using ex vivo blood mixed with a known concentrations of MBs validated that the MBs remain stable in size and concentration during the isolation and counting procedure (Fig. S2).
Figure 4.
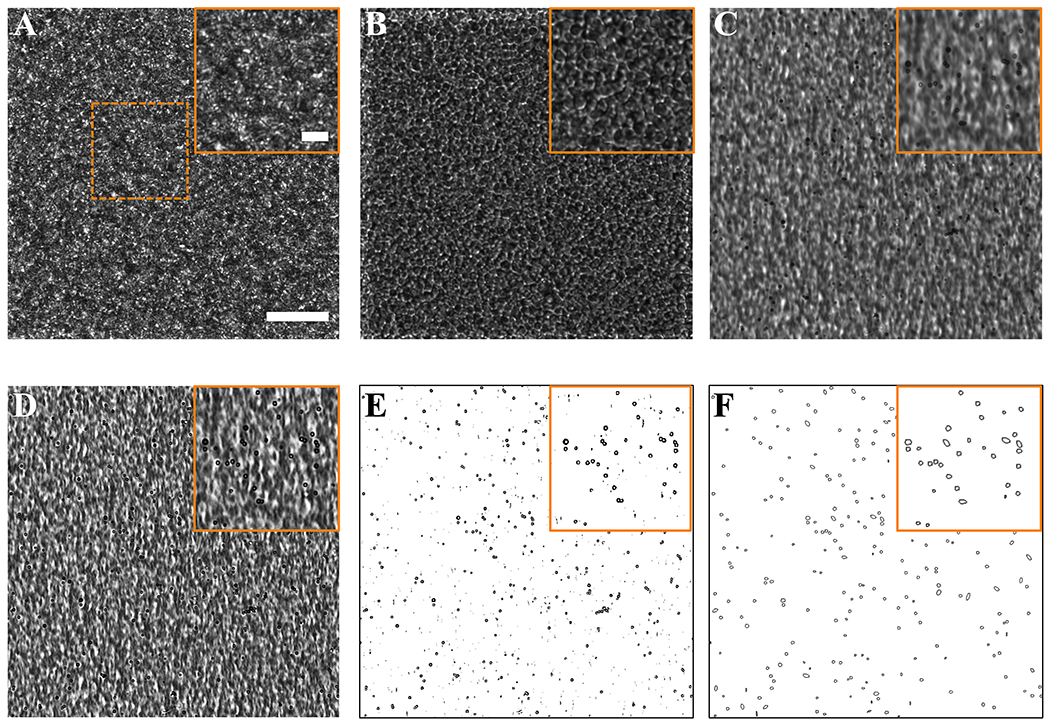
Image processing to detect microbubbles in the acquired blood samples. Brightfield microscope images at 20× magnification of A) Diluted blood + microbubble sample before orbital shaking; B-C) diluted blood + MB sample after orbital shaking results in the segregation of red blood cells (RBCs) and microbubbles (MBs) to different focal planes (bottom and top of the hemocytometer); D) detection of MBs by a normalized Kernel – Convolution filter; E) subtraction of RBCs background and isolation of MBs detected by a convolution filter; F) MB detection using the Analyze particle script included in ImageJ software. Squares with solid lines represent a magnification of the dashed area. Scale bar = 50 μm.
3.3. Pharmacokinetic analysis
3.3.1. One-compartment pharmacokinetic model
The order of MB pharmacokinetics from 5 to 20 µL/kg MVD were determined by comparing the R2 fitting of the one- and two compartment models. The one- compartment model resulted in an R2 ≥ 0.97 (Fig. 5), whereas the two-compartment model in an R2 < 0.97 (Fig. S3). Comparison of R2 values is shown in Table S1. The one-compartment model shown in Fig. 2A. Equation (5) was used to characterize the MB circulation dynamics at low MVDs (Fig. 5A–C). For 2 and 3 μm diameter MBs administered at 5, 10, and 20 µL/kg MVD (Fig. 5A–B), and for 5 μm diameter at 5 and 10 µL/kg MVD (Fig. 5C), MB concentration decreased mono-exponentially as a function of time (Fig. 5A–C, solid lines). Initial MVD values (C0) measured in blood after 1 min of each MVD injection for all MB sizes were close to the expected MVD values (5, 10, and 20 µL/kg) (Table 2). C0 values ranged from 3.1 to 4.6 µL/kg for 5 MVD, 9.6 to 10.7 µL/kg for 10 MVD, and 16.3 to 18.2 µL/kg for 20 MVD. The clearance rate constant values (ke) varied between 0.34 and 0.74 min−1 (Table 2). For all MVDs injected, MBs were eliminated from circulation by 10 min.
Figure 5.

One-compartment pharmacokinetic behavior for 2 and 3 (A, B) and 5 μm diameter MBs (C) administered at low MVDs. Solid lines represent a mono-exponential decay fit with R2 ≥ 0.97. *p ≤ 0.05 vs. 5 MVD and $p < 0.05 vs. 10 MVD between same timepoints, top symbols represent the comparison of 20 MVD vs 10 and 5 MVD, whereas bottom symbols represent the comparison of 10 MVD vs 5 MVD. p values were obtained from unpaired t-test comparison. The first point in each curve represents the initial MVD injected, and the corresponding time was calculated theoretically using the model fit. Data represents the mean ± standard deviation for three different experiments.
Table 2.
Fitting parameters for the one-compartment pharmacokinetic model. C0 represents the first MVD value detected in blood at 1 min after injection and ke the clearance rate constant. Data represents the mean ± standard deviation for three different experiments.
|
|
||||||
|---|---|---|---|---|---|---|
| C0 (μL/kg) | ke (min−1) | |||||
|
| ||||||
| MVD (μL/kg) | 2 μm | 3 μm | 5 μm | 2 μm | 3 μm | 5 μm |
| 5 | 3.1 ± 0.9 | 4.0 ± 0.5 | 4.6 ± 0.4 | 0.74 ± 0.12 | 0.50 ± 0.11 | 0.44 ± 0.05 |
| 10 | 9.6 ±0.7 | 9.8 ±0.5 | 10.7 ± 1.5 | 0.38 ±0.06 | 0.35 ± 0.02 | 0.34 ±0.06 |
| 20 | 16.3 ±2.0 | 18.2 ± 1.1 | - | 0,50 ±0.06 | 0.53 ±0.10 | - |
To complete the first-order pharmacokinetics characterization, relevant pharmacokinetics parameters such as distribution volume, clearance rate, half-life and area-under-the-curve were obtained (Fig. 6). Distribution volumes (Fig. 6A) corresponding to the total volume of blood at rat weight (TVBBW) ranged from 19.7 ± 2.3 to 28.1 ± 0.3 mL. MB clearance rate (ClB) ranged from 8.7 ± 0.8 to 18.4 ± 1.3 mL/min (Fig. 6B). Clearance represents the flow rate of a hypothetical stream in which all MBs are eliminated and is proportional to the decay rate (ke). Our data showed that for the lowest MVD, ClB decreased as MB size increased, with the fastest clearance for the smaller MBs. This trend was not as prominent for the larger MVDs.
Figure 6.
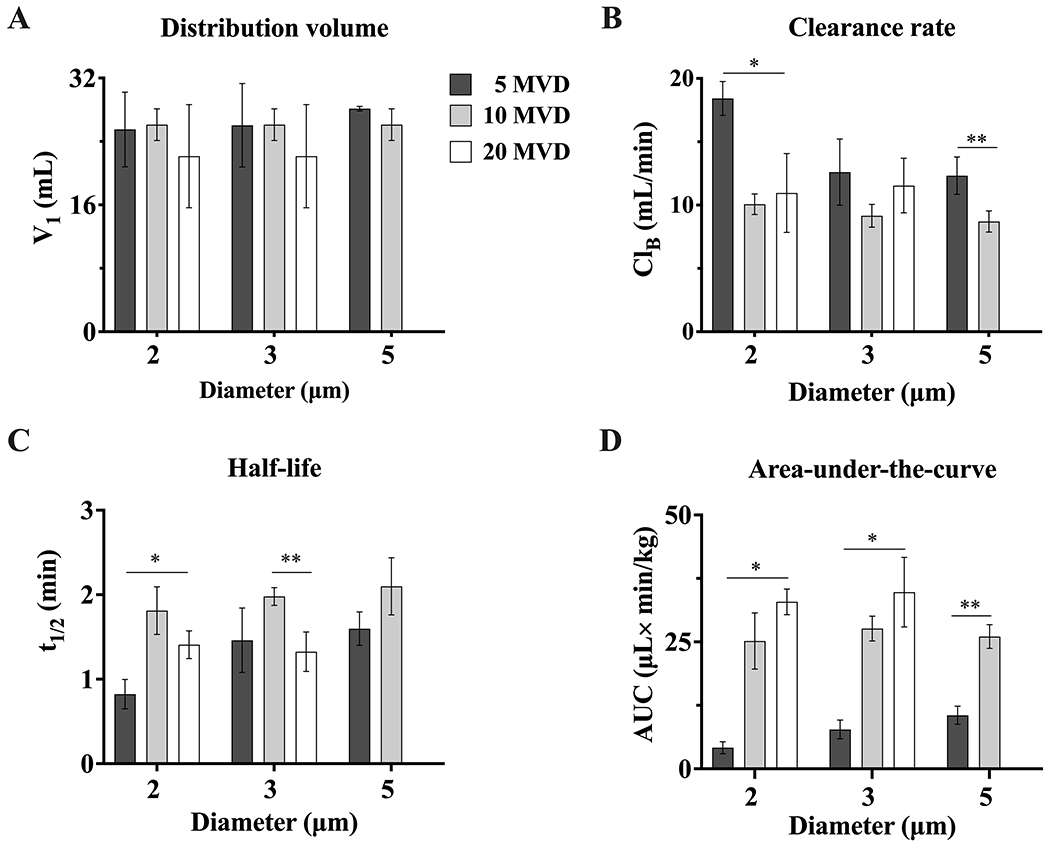
Microbubble pharmacokinetic parameters for the one-compartment model. A) distribution volume (V1), B) clearance rate (ClB), C) half-life (t1/2), and D) area-under-the-curve (AUC). *p < 0.05 and **p ≤ 0.01. p values were obtained from unpaired t-test comparisons. Data represents the mean ± standard deviation for three different experiments.
The half-life (Fig. 6C) for 2-μm MBs increased (0.8 ± 0.2 to 1.4 ± 0.2 min) from 5 to 10 MVD, but it decreased again slightly from 10 to 20 MVD. A similar trend was observed for 3-μm and 5-μm MBs (1.3 ± 0.2 to 2.1 ± 0.3 min). Importantly, the half-life appeared to be relatively independent of MB size at a given MVD.
Finally, we assessed the area-under-the-curve, which is a measure of total circulating MB gas volume bioavailability in the central compartment 39. The AUC ranged from 4.2 ± 1.2 to 32.3 ± 2.5 μL×min/kg for 2 μm MBs, and from 7.7 ± 1.8 to 34.8 ± 6.8 μL×min/kg for 3 and 5 μm MBs. Overall, the AUC increased with MVD, but appeared to be relatively insensitive to MB size (again, except for the small MB size at the lowest MVD).
3.3.2. Two-compartment pharmacokinetic model
The order of MB pharmacokinetics at high MVDs were determined by comparing the R2 fitting of the one- and two- compartment models. The one- compartment model resulted in an R2 ≤ 0.97 (Fig. S4), whereas the two-compartment model in an R2 > 0.99 (Fig. 7). Comparison of R2 values is shown in Table S2. The two-compartment model shown in Fig. 2B Equation (6) was used to characterize the MB circulation dynamics at high MVDs. For 2 and 3 μm diameter MBs administered at 40 µL/kg MVD, and for 5 μm diameter at 20 µL/kg MVD, MVD decreased bi-exponentially as a function of time (Fig. 7, solid lines). The fitting parameters are shown in Table 3. Interestingly, the α and λ1 values decreased as MB size increased, while λ2 values were similar between sizes. All MBs were eliminated from circulation by 10 min.
Figure 7.
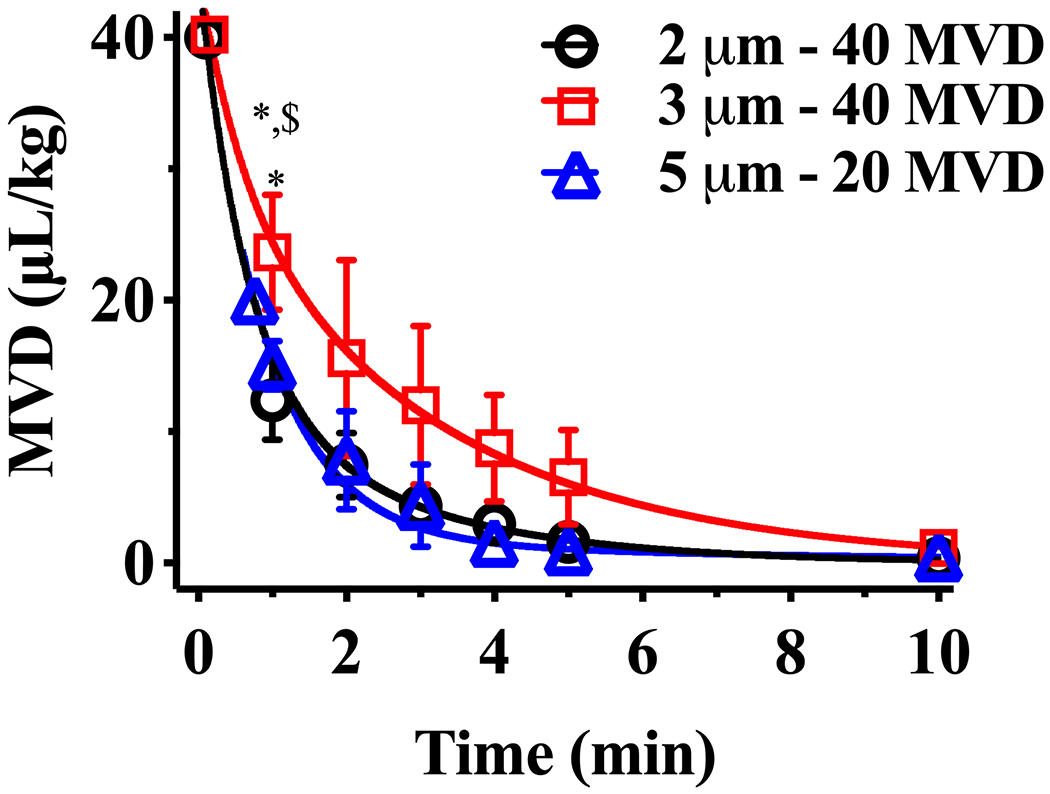
Two-compartment pharmacokinetic behavior for 2, 3, and 5 μm diameter MBs administered at larger MVDs. Solid lines represent a bi-exponentially decay fit with R2 > 0.99. *p < 0.05 vs. 2 μm, and $p < 0.05 vs. 5 μm between same timepoints, top symbols represent the comparison of 20 MVD vs 10 and 5 MVD, whereas bottom symbols represent the comparison of 10 MVD vs 5 MVD. p values were obtained from t-test comparisons. The first point in each curve represents the initial MVD injected, and the corresponding time was calculated theoretically using the model fit. Data represents the mean ± standard deviation for three different experiments.
Table 3.
Fitting parameters for the two-compartment pharmacokinetic model. C0 represents the first MVD value detected in blood at 1 min after injection, while α, λ1 (min−1), and λ2 (min−1) are hybrid constants to describe the fast and the slow decay. Data represents the mean ± standard deviation for three different experiments.
|
|
||||||
|---|---|---|---|---|---|---|
| C0 (μL/kg) | α, λ1, λ2 | |||||
|
| ||||||
| MVD (μL/kg) | 2 μm | 3 μm | 5 μm | 2 μm | 3 μm | 5 μm |
| 20 | - | - | 15.0 ± 1.9 | - | - | 0.12 ± 0.04, 0.20 ± 0.04, 1.52 ± 0.40 |
| 40 | 12.4 ± 3.0 | 23.7 ± 4.4 | - | 0.42 ± 0.16, 0.45 ± 0.10, 2.52 ± 0.30 | 0.43 ± 0.18, 0.25 ± 0.01, 1.32 ± 0.42 | - |
Figure 8 shows the resulting pharmacokinetic parameters from the two-compartment model. The central compartment distribution volume (V1) was similar for all the groups and ranged from 16.0 ± 2.5 to 21.4 ± 2.1 mL (Fig. 8A). The clearance rate (ClB) from the central compartment, which is proportional to its V1, decreased with increasing MB size between 2 and 3 μm from 16.8 ± 2.0 to 9.5 ± 2.0 mL/min, and was similar for 5 μm MBs (16.0 ± 2.5 mL/min) (Fig. 8B). The half-life (t1/2(1)) increased as the MB size increased from 0.3 to 0.6 min (Fig. 8C). Hence, as the AUC1 is inversely proportional to ClB, higher ClB values resulted in lower bioavailability (Fig. 8D). The AUC1 in the central compartment was maximum for 3 μm MBs at 40 MVD, indicating that this diameter and MVD is optimal for maximal MB bioavailability. In the peripheral compartment, the half-life increased with increasing MB size from 1.6 to 4.0 min (Fig. 8F), again indicating that larger MBs tend to be trapped faster in this compartment. The AUC2 in the peripheral (non-circulating) compartment increased between 2 and 3 μm MBs at 40 MVD but was similar between 2 μm MBs at 40 MVD and 5 μm MBs at 20 MVD (Fig. 8E). Again, this result indicates that larger MBs at higher MVDs are trapped faster in the peripheral compartment. However, the AUCs were much smaller in the peripheral compartment than for the central compartment, indicating that most MBs remained in circulation despite some trapping.
Figure 8.
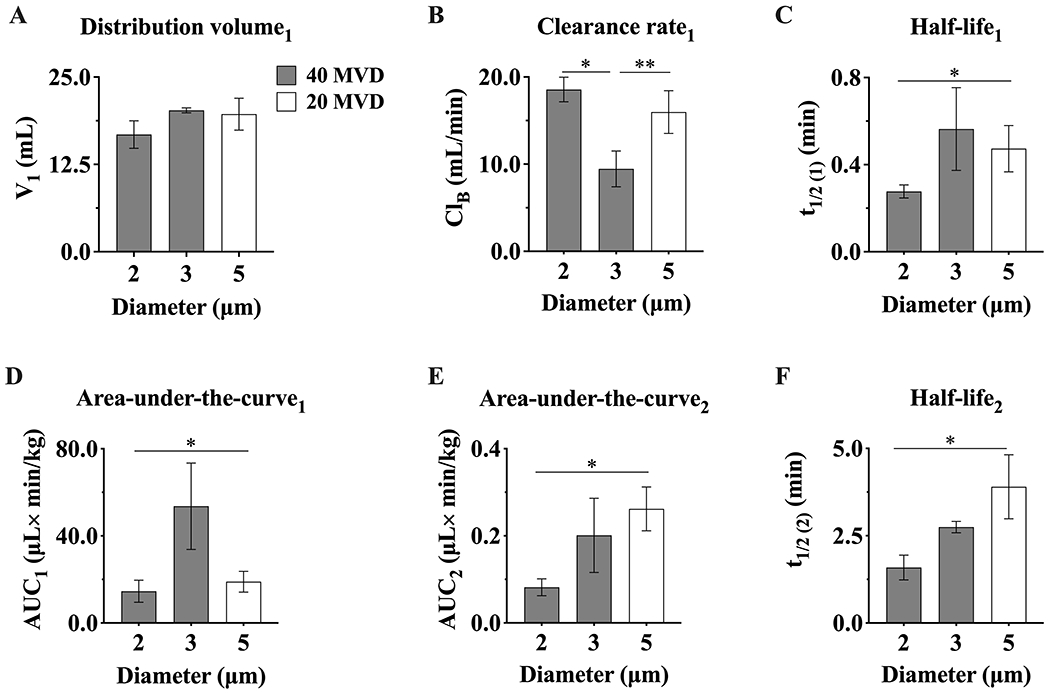
Microbubble pharmacokinetic parameters for the two-compartment model. Parameters that describe the elimination phase in the central compartment (C1): A) distribution volume (V1), B) clearance rate (ClB), C) half-life (t1/2(1)) and D) area-under-the-curve (AUC1). Parameters that describe the distribution phase in the peripheral compartment (C2): E) half-life (t1/2(1)) and F) area-under-the-curve (AUC2). *, **p ≤ 0.05. p values were obtained from unpaired t-test comparisons. Data represents the mean ± standard deviation for three different experiments.
4. Discussion
In this work, we made direct microbubble-in-blood measurements that enabled a more complete characterization of the bioavailability and pharmacokinetics of differently sized MBs at matched microbubble gas volume doses (MVD). First, we found that MB circulation dynamics at low MVDs (5-20 µL/kg for 2-3 µm MBs and 5-10 µL/kg for 5 µm MBs) followed a one-compartment model with first-order elimination. This result indicates that the MBs were distributed uniformly throughout the blood pool without significant accumulation in peripheral tissue compartments 36. Since MB gas volume is excreted through the lungs, this result suggests that MBs are cleared by dissolution and elimination of their gas contents through gas exchange mechanisms at the alveolus. It is known, for example, that MB dissolution rate is affected by the lipid shell composition, thus the half-life of MBs in circulation could presumably be increased by changing the length of acyl-chain phospholipid from C18:0 to C22:0.26,40
Second, we found that when the decay curves are plotted as MVD vs. time, the half-life depended primarily on the MVD given to the animal, and not the MB size. The same was observed for AUC, indicating that MB bioavailability is primarily a function of MVD at these lower doses. The half-life values are inversely proportional to the first-order clearance rate constant (ke). As shown in Table 2, ke decreased from 5 to 10 μL/kg and increased from 10 to 20 μL/kg. The increase in stability from 5 to 10 μL/kg may be due to the faster approach to dissolved perfluorocarbon saturation of the blood and tissue compartments, and hence slower MB dissolution. On the other hand, the decrease in stability from 10 to 20 μL/kg may be due to faster MB trapping in the peripheral compartment. Together, these data provide strong support for the use of MVD as a unifying dose metric for classifying the MB pharmacokinetics at lower doses. MVD may thus be a valuable metric for comparisons of the effects of different MB formulations and ultrasound parameters for imaging and drug delivery.
At the larger MVDs (40 µL/kg for 2-3 µm MBs and 20 µL/kg for 5 µm MBs), the MB circulation dynamics followed a two-compartment model with first-order elimination from the central compartment. Analysis of the pharmacokinetic parameters indicated that that smaller MBs are more susceptible to clearance by the primary elimination mechanism of gas dissolution, as evidenced by high clearance rate (ClB) and short half-life values in the central compartment (C1). As the size increased, MBs were trapped faster in the peripheral compartment. This was evidenced by the longer peripheral-compartment half-life and larger peripheral compartment AUC2. Based on prior PET imaging studies,41 it is likely that the peripheral compartment consists of organs with fine capillaries that capture the larger MBs, such as the lung, liver and spleen. While this may be viewed as a second elimination mechanism, the model allows trapped MBs to become untrapped and re-enter the central compartment. This effect is undesirable for MB bioavailability, and in fact was lethal for the largest MBs at the highest MVD.
Interestingly, we found that the animals did not tolerate 5 µm diameter MBs at 40 µL/kg MVD, hence their omission from the pharmacokinetic analysis. A previous study conducted by our group21 showed that Sprague Dawley rats of identical sex, age and weight can tolerate 40 µL/kg MVD doses of similarly-sized MBs, administered via similarly sized catheters. A possible explanation for this discrepancy is the route of administration: while the previous study utilized tail-vein injections, the current study utilizes intra-jugular catheterization. It has been shown that tail-vein injections introduce some retrograde flow to the liver,42,43 which may divert a portion of the injected MB dose away from the vena cava and lungs. Intra-jugular injections, on the other hand, would deliver the bulk of the MB dose directly to the lungs (via the subclavian and brachiocephalic veins, vena cava and pulmonary artery). In such cases, the resulting pulmonary capillary obstruction may lead to pulmonary hemodynamic changes such as progressive increases in pulmonary artery pressure and pulmonary vascular resistance, as well as decreased arterial oxygen saturation, cardiac output and stroke volume.44–46 Further investigation is necessary to verify this interpretation.
Current indirect techniques such as gas chromatography 23,28 and US contrast images 22,24–27 used to study the pharmacokinetics have limitations related to the sensitivity to gas content and sonographic microbubble detection, which hinders a precise and complete characterization of the MB pharmacokinetic behaviors. Moreover, the accuracy of gas chromatography is limited by the exchange of MBs gas core during the dissolution process with blood gases, whereby microbubbles may still be in circulation even after the perfluorocarbon has been expired from the lungs. 31,47 On the other hand, US accuracy is limited because it cannot to distinguishing the number and size of circulating MBs providing the echo within an imaging voxel.48 In contrast, our direct method demonstrates that is possible obtain pharmacokinetics profiles with a clear initial and terminal phase, making it possible to compare and quantify relevant pharmacokinetic parameters. Although these results are consistent with these previous indirect pharmacokinetic results, we believe that our direct method is preferable and suggests that using MVD as metric for MB dose is superior to fluid volume dose or number concentration.
Overall, these data indicate that MB circulation kinetics depend primarily on MVD, and not size, at low MVDs. This result is important for imaging studies that tend to use lower doses. Commonly, the dose of UCAs used in echo-contrast vary between 0.1 and 0.5 µL/kg, while preclinical and benchtop studies involving BBBD have used from 1 to 40 µL/kg.15,49 However, for therapeutic applications, however, it may be desirable to maximize the amount of circulating MBs over the procedure timeframe. In this study, we found that the maximum achieved bioavailability (measured by the central-compartment AUC) was for the medium-sized 3 µm MBs at 40 µL/kg MVD.
5. Conclusion
In conclusion, we present the first direct microbubble pharmacokinetic study that allowed us to determine the pharmacokinetic behavior between different MB sizes and MVDs. We showed the utility of MVD as a unified dose parameter. We also established thresholds in which the in vivo dynamics change from one central compartment to two compartments (central + peripheral). This study also determined the range in which the MVD injection is safe, and the maximal MB bioavailability for this composition. This simple experimental and modeling technique may be helpful to study and compare other formulations used in clinical and research applications.
Supplementary Material
Acknowledgements
This work was supported by the US National Institutes of Health award R01CA239465.
Footnotes
Supporting Information. Description of isolation protocol; microscopy images of fluorescent microbubbles after isolation (Fig. S1); plots of microbubble concentration and size before and after isolation (Fig. S2); two-compartment model description; results of one-compartment model fit to all data sets (Fig. S3, Table S1); results of two-compartment model fits to all data sets (Fig. S4, Table S4).
References
- (1).Frinking P; Segers T; Luan Y; Tranquart F Three Decades of Ultrasound Contrast Agents: A Review of the Past, Present and Future Improvements. Ultrasound Med. Biol 2020, 46 (4), 892–908. 10.1016/j.ultrasmedbio.2019.12.008. [DOI] [PubMed] [Google Scholar]
- (2).Stride E; Segers T; Lajoinie G; Cherkaoui S; Bettinger T; Versluis M; Borden M Microbubble Agents: New Directions. Ultrasound Med. Biol 2020, 46 (6), 1326–1343. 10.1016/j.ultrasmedbio.2020.01.027. [DOI] [PubMed] [Google Scholar]
- (3).Borden MA; Song K-H Reverse Engineering the Ultrasound Contrast Agent. Adv. Colloid Interface Sci 2018, 262, 39–49. 10.1016/j.cis.2018.10.004. [DOI] [PMC free article] [PubMed] [Google Scholar]
- (4).Roovers S; Segers T; Lajoinie G; Deprez J; Versluis M; De Smedt SC; Lentacker I The Role of Ultrasound-Driven Microbubble Dynamics in Drug Delivery: From Microbubble Fundamentals to Clinical Translation. Langmuir 2019, 35 (31), 10173–10191. 10.1021/acs.langmuir.8b03779. [DOI] [PubMed] [Google Scholar]
- (5).Willmann JK; Bonomo L; Testa AC; Rinaldi P; Rindi G; Valluru KS; Petrone G; Martini M; Lutz AM; Gambhir SS Ultrasound Molecular Imaging With BR55 in Patients With Breast and Ovarian Lesions: First-in-Human Results. J. Clin. Oncol 2017, 35 (19), 2133–2140. 10.1200/JCO.2016.70.8594. [DOI] [PMC free article] [PubMed] [Google Scholar]
- (6).Smeenge M; Tranquart F; Mannaerts CK; de Reijke TM; van de Vijver MJ; Laguna MP; Pochon S; de la Rosette JJMCH; Wijkstra H First-in-Human Ultrasound Molecular Imaging With a VEGFR2-Specific Ultrasound Molecular Contrast Agent (BR55) in Prostate Cancer: A Safety and Feasibility Pilot Study. Invest. Radiol 2017, 52 (7), 419–427. 10.1097/RLI.0000000000000362. [DOI] [PubMed] [Google Scholar]
- (7).Errico C; Pierre J; Pezet S; Desailly Y; Lenkei Z; Couture O; Tanter M Ultrafast Ultrasound Localization Microscopy for Deep Super-Resolution Vascular Imaging. Nature 2015, 527 (7579), 499–502. 10.1038/nature16066. [DOI] [PubMed] [Google Scholar]
- (8).Hynynen K; McDannold N; Vykhodtseva N; Jolesz FA Noninvasive MR Imaging–Guided Focal Opening of the Blood-Brain Barrier in Rabbits. Radiology 2001, 220 (3), 640–646. 10.1148/radiol.2202001804. [DOI] [PubMed] [Google Scholar]
- (9).Bellary A; Villarreal A; Eslami R; Undseth QJ; Lec B; Defnet AM; Bagrodia N; Kandel JJ; Borden MA; Shaikh S; Chopra R; Laetsch TW; Delaney LJ; Shaw CM; Eisenbrey JR; Hernandez SL; Sirsi SR Perfusion-Guided Sonopermeation of Neuroblastoma: A Novel Strategy for Monitoring and Predicting Liposomal Doxorubicin Uptake in Vivo. Theranostics 2020, 10 (18), 8143–8161. 10.7150/thno.45903. [DOI] [PMC free article] [PubMed] [Google Scholar]
- (10).Kooiman K; Vos HJ; Versluis M; de Jong N Acoustic Behavior of Microbubbles and Implications for Drug Delivery. Adv. Drug Deliv. Rev 2014, 72, 28–48. 10.1016/j.addr.2014.03.003. [DOI] [PubMed] [Google Scholar]
- (11).Lammertink BHA; Bos C; Deckers R; Storm G; Moonen CTW; Escoffre J-M Sonochemotherapy: From Bench to Bedside. Front. Pharmacol 2015, 6. 10.3389/fphar.2015.00138. [DOI] [PMC free article] [PubMed] [Google Scholar]
- (12).Song K-H; Fan AC; Brlansky JT; Trudeau T; Gutierrez-Hartmann A; Calvisi ML; Borden MA High Efficiency Molecular Delivery with Sequential Low-Energy Sonoporation Bursts. Theranostics 2015, 5 (12), 1419–1427. 10.7150/thno.13033. [DOI] [PMC free article] [PubMed] [Google Scholar]
- (13).Qin P; Han T; Yu ACH; Xu L Mechanistic Understanding the Bioeffects of Ultrasound-Driven Microbubbles to Enhance Macromolecule Delivery. J. Controlled Release 2018, 272, 169–181. 10.1016/j.jconrel.2018.01.001. [DOI] [PubMed] [Google Scholar]
- (14).Deprez J; Lajoinie G; Engelen Y; De Smedt SC; Lentacker I Opening Doors with Ultrasound and Microbubbles: Beating Biological Barriers to Promote Drug Delivery. Adv. Drug Deliv. Rev 2021, 172, 9–36. 10.1016/j.addr.2021.02.015. [DOI] [PubMed] [Google Scholar]
- (15).Song K-H; Harvey BK; Borden MA State-of-the-Art of Microbubble-Assisted Blood-Brain Barrier Disruption. Theranostics 2018, 8 (16), 4393–4408. 10.7150/thno.26869. [DOI] [PMC free article] [PubMed] [Google Scholar]
- (16).Goertz DE; de Jong N; van der Steen AFW Attenuation and Size Distribution Measurements of Definity™ and Manipulated Definity™ Populations. Ultrasound Med. Biol 2007, 33 (9), 1376–1388. 10.1016/j.ultrasmedbio.2007.03.009. [DOI] [PubMed] [Google Scholar]
- (17).Sonne C; Xie F; Lof J; Oberdorfer J; Phillips P; Carr Everbach E; Porter TR Differences in Definity and Optison Microbubble Destruction Rates at a Similar Mechanical Index with Different Real-Time Perfusion Systems. J. Am. Soc. Echocardiogr 2003, 16 (11), 1178–1185. 10.1067/j.echo.2003.07.001. [DOI] [PubMed] [Google Scholar]
- (18).Choi JJ; Feshitan JA; Baseri B; Wang S; Tung Y-S; Borden MA; Konofagou EE Microbubble-Size Dependence of Focused Ultrasound-Induced Blood–Brain Barrier Opening in Mice In Vivo. IEEE Trans. Biomed. Eng 2010, 57 (1), 145–154. 10.1109/TBME.2009.2034533. [DOI] [PMC free article] [PubMed] [Google Scholar]
- (19).Sirsi S; Feshitan J; Kwan J; Homma S; Borden M Effect of Microbubble Size on Fundamental Mode High Frequency Ultrasound Imaging in Mice. Ultrasound Med. Biol 2010, 36 (6), 935–948. 10.1016/j.ultrasmedbio.2010.03.015. [DOI] [PMC free article] [PubMed] [Google Scholar]
- (20).Samiotaki G; Vlachos F; Tung Y-S; Konofagou EE A Quantitative Pressure and Microbubble-Size Dependence Study of Focused Ultrasound-Induced Blood-Brain Barrier Opening Reversibility in Vivo Using MRI. Magn. Reson. Med 2012, 67 (3), 769–777. 10.1002/mrm.23063. [DOI] [PMC free article] [PubMed] [Google Scholar]
- (21).Song K-H; Fan AC; Hinkle JJ; Newman J; Borden MA; Harvey BK Microbubble Gas Volume: A Unifying Dose Parameter in Blood-Brain Barrier Opening by Focused Ultrasound. Theranostics 2017, 7 (1), 144–152. 10.7150/thno.15987. [DOI] [PMC free article] [PubMed] [Google Scholar]
- (22).Bing C; Hong Y; Hernandez C; Rich M; Cheng B; Munaweera I; Szczepanski D; Xi Y; Bolding M; Exner A; Chopra R Characterization of Different Bubble Formulations for Blood-Brain Barrier Opening Using a Focused Ultrasound System with Acoustic Feedback Control. Sci. Rep 2018, 8 (1), 7986. 10.1038/s41598-018-26330-7. [DOI] [PMC free article] [PubMed] [Google Scholar]
- (23).Li P; Hoppmann S; Du P; Li H; Evans PM; Moestue SA; Yu W; Dong F; Liu H; Liu L Pharmacokinetics of Perfluorobutane after Intra-Venous Bolus Injection of Sonazoid in Healthy Chinese Volunteers. Ultrasound Med. Biol 2017, 43 (5), 1031–1039. 10.1016/j.ultrasmedbio.2017.01.003. [DOI] [PubMed] [Google Scholar]
- (24).Chomas JE; Dayton P; Allen J; Morgan K; Ferrara KW Mechanisms of Contrast Agent Destruction. IEEE Trans. Ultrason. Ferroelectr. Freq. Control 2001, 48 (1), 232–248. 10.1109/58.896136. [DOI] [PubMed] [Google Scholar]
- (25).Chen CC; Sirsi SR; Homma S; Borden MA Effect of Surface Architecture on In Vivo Ultrasound Contrast Persistence of Targeted Size-Selected Microbubbles. Ultrasound Med. Biol 2012, 38 (3), 492–503. 10.1016/j.ultrasmedbio.2011.12.007. [DOI] [PMC free article] [PubMed] [Google Scholar]
- (26).Reusser TD; Song K-H; Ramirez D; Benninger RK; Papadopoulou V; Borden MA Phospholipid Oxygen Microbubbles for Image-Guided Therapy. Nanotheranostics 2020, 4 (2), 83–90. 10.7150/ntno.43808. [DOI] [PMC free article] [PubMed] [Google Scholar]
- (27).Abenojar EC; Nittayacharn P; de Leon AC; Perera R; Wang Y; Bederman I; Exner AA Effect of Bubble Concentration on the in Vitro and in Vivo Performance of Highly Stable Lipid Shell-Stabilized Micro- and Nanoscale Ultrasound Contrast Agents. Langmuir 2019, 35 (31), 10192–10202. 10.1021/acs.langmuir.9b00462. [DOI] [PubMed] [Google Scholar]
- (28).Morel DR; Schwieger I; Hohn L; Terrettaz J; Llull JB; Cornioley YA; Schneider M Human Pharmacokinetics and Safety Evaluation of SonoVue™, a New Contrast Agent for Ultrasound Imaging: Invest. Radiol 2000, 35 (1), 80. 10.1097/00004424-200001000-00009. [DOI] [PubMed] [Google Scholar]
- (29).Barrefelt Å; Saghafian M; Kuiper R; Ye F; Egri G; Klickermann M; Brismar TB; Aspelin P; Muhammed M; Dähne L; Hassan M Biodistribution, Kinetics, and Biological Fate of SPION Microbubbles in the Rat. Int. J. Nanomedicine 2013, 8, 3241–3254. 10.2147/IJN.S49948. [DOI] [PMC free article] [PubMed] [Google Scholar]
- (30).Kwan JJ; Borden MA Microbubble Dissolution in a Multigas Environment. Langmuir 2010, 26 (9), 6542–6548. 10.1021/la904088p. [DOI] [PubMed] [Google Scholar]
- (31).Kwan JJ; Borden MA Lipid Monolayer Dilatational Mechanics during Microbubble Gas Exchange. Soft Matter 2012, 8 (17), 4756–4766. 10.1039/C2SM07437K. [DOI] [Google Scholar]
- (32).Feshitan JA; Chen CC; Kwan JJ; Borden MA Microbubble Size Isolation by Differential Centrifugation. J. Colloid Interface Sci 2009, 329 (2), 316–324. 10.1016/j.jcis.2008.09.066. [DOI] [PubMed] [Google Scholar]
- (33).Feshitan JA; Chen CC; Kwan JJ; Borden MA Microbubble Size Isolation by Differential Centrifugation. J. Colloid Interface Sci 2009, 329 (2), 316–324. 10.1016/j.jcis.2008.09.066. [DOI] [PubMed] [Google Scholar]
- (34).Talu E; Powell RL; Longo ML; Dayton PA Needle Size and Injection Rate Impact Microbubble Contrast Agent Population. Ultrasound Med. Biol 2008, 34 (7), 1182–1185. 10.1016/j.ultrasmedbio.2007.12.018. [DOI] [PMC free article] [PubMed] [Google Scholar]
- (35).Barrack T; Stride E Microbubble Destruction During Intravenous Administration: A Preliminary Study. Ultrasound Med. Biol 2009, 35 (3), 515–522. 10.1016/j.ultrasmedbio.2008.07.008. [DOI] [PubMed] [Google Scholar]
- (36).Truskey GA; Yuan F; Katz DF Transport Phenomena in Biological Systems, Second Edition.; Pearson Prentice Hall: New Jersey, 2009. [Google Scholar]
- (37).Vitello DJ; Ripper RM; Fettiplace MR; Weinberg GL; Vitello JM Blood Density Is Nearly Equal to Water Density: A Validation Study of the Gravimetric Method of Measuring Intraoperative Blood Loss. J. Vet. Med 2015, 2015, 1–4. 10.1155/2015/152730. [DOI] [PMC free article] [PubMed] [Google Scholar]
- (38).Schoeffner DJ ORGAN WEIGHTS AND FAT VOLUME IN RATS AS A FUNCTION OF STRAIN AND AGE. J. Toxicol. Environ. Health A 1999, 56 (7), 449–462. 10.1080/009841099157917. [DOI] [PubMed] [Google Scholar]
- (39).Vandeginste BGM; Massart DL; Buydens LMC; De Jong S; Lewi PJ; Smeyers-Verbeke J Pharmacokinetic Models. In Data Handling in Science and Technology; Elsevier, 1998; Vol. 20, pp 449–506. 10.1016/S0922-3487(98)80049-X. [DOI] [Google Scholar]
- (40).Garg S; Thomas AA; Borden MA The Effect of Lipid Monolayer In-Plane Rigidity on in Vivo Microbubble Circulation Persistence. Biomaterials 2013, 34 (28), 6862–6870. 10.1016/j.biomaterials.2013.05.053. [DOI] [PMC free article] [PubMed] [Google Scholar]
- (41).Tartis MS; Kruse DE; Zheng H; Zhang H; Kheirolomoom A; Marik J; Ferrara KW Dynamic MicroPET Imaging of Ultrasound Contrast Agents and Lipid Delivery. J. Control. Release Off. J. Control. Release Soc 2008, 131 (3), 160–166. 10.1016/j.jconrel.2008.07.030. [DOI] [PMC free article] [PubMed] [Google Scholar]
- (42).Socher M; Kuntz J; Sawall S; Bartling S; Kachelrieß M The Retrobulbar Sinus Is Superior to the Lateral Tail Vein for the Injection of Contrast Media in Small Animal Cardiac Imaging. Lab. Anim 2014, 48 (2), 105–113. 10.1177/0023677213517500. [DOI] [PubMed] [Google Scholar]
- (43).Kanefuji T; Yokoo T; Suda T; Abe H; Kamimura K; Liu D Hemodynamics of a Hydrodynamic Injection. Mol. Ther. - Methods Clin. Dev 2014, 1, 14029. 10.1038/mtm.2014.29. [DOI] [PMC free article] [PubMed] [Google Scholar]
- (44).Kirkton SD; Wagner H; Landicho MM; Struthers JJ; Busan N; Wagner PD Effects of Imagent® on Pulmonary Hemodynamics and Gas Exchange in Dogs. Ultrasound Med. Biol 2006, 32 (6), 949–959. 10.1016/j.ultrasmedbio.2006.02.1422. [DOI] [PubMed] [Google Scholar]
- (45).Yamaya Y; Niizeki K; Kim J; Entin PL; Wagner H; Wagner PD Effects of Optison® on Pulmonary Gas Exchange and Hemodynamics. Ultrasound Med. Biol 2002, 28 (8), 1005–1013. 10.1016/S0301-5629(02)00549-5. [DOI] [PubMed] [Google Scholar]
- (46).Grayburn PA; Erickson JM; Escobar J; Womack L; Velasco CE Peripheral Intravenous Myocardial Contrast Echocardiography Using a 2% Dodecafluoropentane Emulsion: Identification of Myocardial Risk Area and Infarct Size in the Canine Model of Ischemia. J. Am. Coll. Cardiol 1995, 26 (5), 1340–1347. 10.1016/0735-1097(95)00306-1. [DOI] [PubMed] [Google Scholar]
- (47).Kwan JJ; Borden MA Lipid Monolayer Collapse and Microbubble Stability. Adv. Colloid Interface Sci 2012, 183–184, 82–99. 10.1016/j.cis.2012.08.005. [DOI] [PubMed] [Google Scholar]
- (48).Gore JC; Yankeelov TE; Peterson Todd. E.; Avison MJ Molecular Imaging Without Radiopharmaceuticals? J. Nucl. Med 2009, 50 (6), 999–1007. 10.2967/jnumed.108.059576. [DOI] [PMC free article] [PubMed] [Google Scholar]
- (49).Hyvelin J-M; Gaud E; Costa M; Helbert A; Bussat P; Bettinger T; Frinking P Characteristics and Echogenicity of Clinical Ultrasound Contrast Agents: An In Vitro and In Vivo Comparison Study: Comparison of Clinical Ultrasound Contrast Agents. J. Ultrasound Med 2017, 36 (5), 941–953. 10.7863/ultra.16.04059. [DOI] [PubMed] [Google Scholar]
Associated Data
This section collects any data citations, data availability statements, or supplementary materials included in this article.


