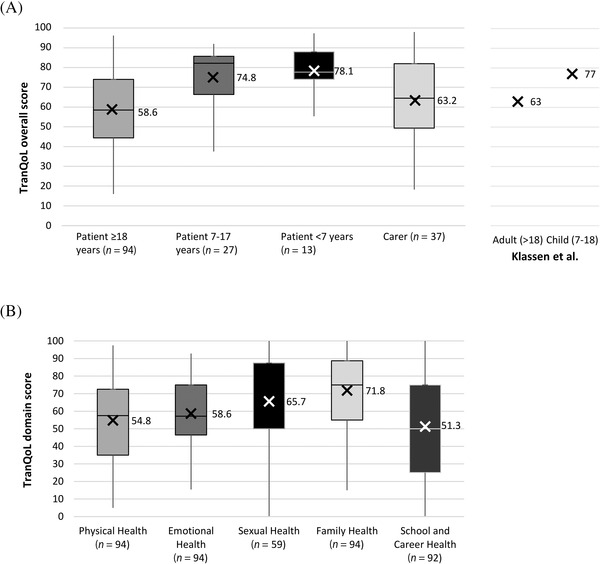
FIGURE 4.

Patient and carer TDT‐related quality of life assessed using the TranQoL questionnaire. Panel A: Patient and carer TranQoL overall scores; X indicates the mean. Panel B: Patient TranQoL domain scores. TranQoL score and individual domain scores range from 0 (worst thalassaemia‐related QoL) to 100 (best thalassaemia‐related QoL). X indicates the mean. (Note: boxes represent the 25th percentile, 50th percentile [median] and 75th percentile of ranked scores; for the Sexual Health domain scores the 25th and 50th percentiles were 50, and consequently both are indicated by the bottom line of the box)
